

Abstract
The regulatory elements that direct tissue-specific gene expression in the developing mammalian embryo remain largely unknown. Although chromatin profiling has proven to be a powerful method for mapping regulatory sequences in cultured cells, chromatin states characteristic of active developmental enhancers have not been directly identified in embryonic tissues. Here we use whole-transcriptome analysis coupled with genome-wide profiling of H3K27ac and H3K27me3 to map chromatin states and enhancers in mouse embryonic forelimb and hindlimb. We show that gene-expression differences between forelimb and hindlimb, and between limb and other embryonic cell types, are correlated with tissue-specific H3K27ac signatures at promoters and distal sites. Using H3K27ac profiles, we identified 28,377 putative enhancers, many of which are likely to be limb specific based on strong enrichment near genes highly expressed in the limb and comparisons with tissue-specific EP300 sites and known enhancers. We describe a chromatin state signature associated with active developmental enhancers, defined by high levels of H3K27ac marking, nucleosome displacement, hypersensitivity to sonication, and strong depletion of H3K27me3. We also find that some developmental enhancers exhibit components of this signature, including hypersensitivity, H3K27ac enrichment, and H3K27me3 depletion, at lower levels in tissues in which they are not active. Our results establish histone modification profiling as a tool for developmental enhancer discovery, and suggest that enhancers maintain an open chromatin state in multiple embryonic tissues independent of their activity level.
Mammalian embryonic development requires highly complex spatial and temporal gene expression patterns that are determined by tissue-specific changes in the activity of cis-regulatory elements, including promoters and enhancers. Identifying these elements continues to be a significant challenge. Studies of histone modifications using chromatin immunoprecipitation followed by high-throughput sequencing (ChIP-seq) in cultured cells have defined chromatin signatures associated with active enhancers and promoters (Ernst and Kellis 2010; Ernst et al. 2011). These studies indicate that enhancer activation is highly cell-type specific and is correlated with cell-type-specific gene expression. Chromatin profiling in the mammalian embryo, coupled with whole transcriptome analysis, would identify tissue-specific enhancers and gene-expression patterns. However, as histone modifications have not been extensively mapped in embryonic tissues, insight into chromatin states during development remains limited.
Efforts to identify developmental enhancers have focused on ChIP-seq analyses of trans-acting factors, notably the histone acetyltransferase EP300 (Visel et al. 2009; Blow et al. 2010). Sites bound by EP300 in mouse embryonic tissues are significantly enriched for tissue-specific enhancers. Although these studies discovered several thousand putative developmental enhancers, this is a fraction of the hundreds of thousands of enhancers estimated to be present in mammalian genomes (Heintzman et al. 2009). Moreover, in these studies, EP300 ChIP-seq required milligram quantities of chromatin and technically difficult amplification techniques (Visel et al. 2009; Blow et al. 2010), rendering EP300 a challenging target for enhancer identification in limiting embryonic tissues. ChIP-seq analyses of histone modifications are a potentially more robust method to identify enhancers, and would reveal tissue-specific chromatin profiles.
To establish methods for chromatin state analysis and enhancer identification in the embryo, we mapped H3K27ac and H3K27me3 and conducted whole-transcriptome profiling in mouse embryonic forelimb and hindlimb. H3K27ac is deposited by EP300 and is strongly associated with active promoters and enhancers in cultured cells and Drosophila embryonic mesoderm (Heintzman et al. 2009; Tie et al. 2009; Pasini et al. 2010; Ernst et al. 2011; Bonn et al. 2012). H3K27me3 is deposited by PRC2 and is associated with repressed portions of the genome (Boyer et al. 2006; Ernst et al. 2011). Combined, these marks allow genome-wide identification of active and repressed chromatin domains in the limb. As a classic model for understanding how spatial control of gene expression determines the patterning of embryonic structures, the limb offers benchmark data sets well suited for our study. Several genes required for limb development are known, including genes specific to the forelimb or hindlimb. In addition, 148 active enhancers have been experimentally validated and 3839 EP300 sites identified in the embryonic day 11.5 (E11.5) limb (Pennacchio et al. 2006; Visel et al. 2007; Blow et al. 2010). However, the overall regulatory architecture of limb development is not well characterized. Comparing forelimb and hindlimb chromatin profiles will also provide novel insight into regulatory differences between these two tissues, which have similar, but distinct developmental trajectories.
We show that H3K27ac detects active enhancers in the developing limb. We identified 28,377 putative enhancers in E10.5 and E11.5 limb buds, many of which are likely to be limb specific based on comparisons with EP300 sites and known enhancers. Gene expression differences between the forelimb and hindlimb, and between the limb and heterologous developmental states, are correlated with tissue-specific H3K27ac marks at promoters and enhancers. We describe a characteristic chromatin state signature of active enhancers, defined by high levels of H3K27ac marking, nucleosome displacement, hypersensitivity to sonication, and strong depletion of H3K27me3. We also find that developmental enhancers exhibit H3K27ac enrichment, H3K27me3 depletion, and hypersensitivity at lower levels in tissues in which they are not active. Taken together, our results provide novel genomic insights into the regulatory architecture of mammalian limb development and identify common features of developmental enhancers.
Results
Chromatin states correlate with gene expression differences between forelimb and hindlimb
We characterized the transcriptomes of whole E10.5 forelimb and hindlimb buds using high-throughput RNA sequencing (RNA-seq). Overall expression levels are highly similar between both tissues: We detected only 186 significantly differentially expressed genes (log-linear model with likelihood ratio test [LRT]; Benjamini-Hochberg P-value [BHP] ≤0.05) (Fig. 1A; Supplemental Table S1). This set includes known forelimb or hindlimb-specific genes, such as Tbx4, Tbx5, and Pitx1, and is enriched for Gene Ontology terms associated with limb development (Fig. 1B; Supplemental Table S2; DeLaurier et al. 2006; King et al. 2006). Several genes with unknown functions are also strongly differentially expressed (Fig. 1B; Supplemental Table S1). We identified 2334 novel transcriptionally active regions (nTARs) in limb, of which 580 show significant homology with at least one mouse RefSeq protein (Supplemental Table S18). We identified 210 nTARs differentially expressed between forelimb and hindlimb (BHP <0.05) (Supplemental Table S2). Although we detected 258 novel splices in limb, we did not observe extensive alternative isoform usage differences between forelimb and hindlimb (Supplemental Table S3). Using quantitative real time PCR (RT–qPCR), we confirmed differential expression for 18 of 20 genes and validated all 11 nTARs we tested as well as 12 of 15 novel splices (Supplemental Fig. S2A–C).
Figure 1.

Whole-transcriptome analysis of mouse E10.5 limb. (A) Log2 (RPKM) values for 27,189 genes compared between a single biological replicate of forelimb and hindlimb. Genes identified as differentially expressed by log-linear LRT (BHP <0.05) are shown as black circles. (B) Heatmap of selected genes significantly differentially expressed between forelimb and hindlimb. For each gene listed, RPKMs were averaged across all replicates and values for individual replicates are plotted as a log2 fold change relative to this average value.
To compare the differential gene expression patterns that we observed with chromatin states at cis-regulatory elements, we used ChIP-seq to generate independent genome-wide maps of H3K27ac and H3K27me3 in E10.5 forelimb and hindlimb. Raw signals at enriched regions for each histone modification were correlated between replicates, and we confirmed selected peaks for each modification by ChIP-qPCR (Supplemental Figs. S3, S4). We identified 21,994 H3K27ac and 9312 H3K27me3-enriched regions combined in both tissues (Supplemental Tables S4, S5). The ratio of H3K27ac to H3K27me3 at the promoters of the 186 genes differentially expressed between forelimb and hindlimb is correlated with the level of differential expression (Fig. 2,B). High relative levels of H3K27ac in forelimb or hindlimb correspond to increased gene expression in that tissue, while high relative levels of H3K27me3 correspond to decreased expression. Three canonical forelimb or hindlimb-specific genes that are also strongly differentially expressed in our data set, Tbx4, Tbx5, and Pitx1, are marked by large H3K27ac regions in the tissue in which they are expressed, and large H3K27me3 regions in the tissue in which they are not. In the case of Pitx1, the tissue-specific H3K27ac and H3K27me3 regions encompass a similar genomic interval and mark several islands of strong noncoding sequence conservation that may include nearby cis-regulatory elements (Fig. 2A). Chromatin states at promoters also correspond to regional expression patterns within the limb bud. Using ChIP-qPCR in E10.5 anterior and posterior forelimb, we measured H3K27ac and H3K27me3 enrichment at promoters of several genes with known anteroposterior expression gradients, which displayed both marks in whole limb. Each promoter showed regional H3K27ac- or H3K27me3-dominant enrichment corresponding to the regional expression pattern of each gene (Fig. 2C).
Figure 2.

Relative H3K27ac and H3K27me3 enrichments at promoters correlate with gene expression in E10.5 limb buds. (A) Gene expression (blue), H3K27ac signal (green), and H3K27me3 signal (red) at the hindlimb-specific gene Pitx1. All signal plots represent reads per million mapped total reads. Green and red bars below signal plots, respectively, illustrate H3K27ac or H3K27me3-enriched regions in limb. H3K27me3-enriched regions in MES and NPC cell lines are shown at bottom. The figure was generated using the UCSC Genome Browser. (B) Scatterplot of the ratio of log2(RPKM) values for genes differentially expressed between forelimb and hindlimb versus the log2(ratio of H3K27ac vs. H3K27me3 signals at their promoters). Selected known and novel limb genes that show strong correlations between these values are indicated in orange. The P-value shown was calculated using a linear regression t-test. (C) Bar chart depicting relative levels of H3K27ac and H3K27me3 enrichment at indicated gene promoters in the anterior and posterior halves of E10.5 forelimb buds. (Right) The dominant mark present for representative genes that are ubiquitously expressed (Tbx5), completely repressed (Pitx1), or regionally restricted (Hand2).
To detect putative enhancers contributing to differential gene expression between E10.5 forelimb and hindlimb, we identified 1121 intergenic and intronic sites (see Methods) that were significantly differentially marked by H3K27ac between the two tissues (greater than or equal to twofold change and log linear LRT BHP <0.01; Supplemental Table S8). Compared with random sites, regions more strongly marked in forelimb or hindlimb showed a weak but significant enrichment near genes up-regulated in forelimb or hindlimb, respectively (Supplemental Fig. S5; see Supplemental Methods). Although this suggests that tissue-specific gene expression may correlate with tissue-specific enhancer activation in forelimb or hindlimb, the very limited set of differentially expressed genes and differentially marked sites precludes a robust analysis.
H3K27ac identifies developmental enhancers in limb
Given the similarity we observed between forelimb and hindlimb, we chose to identify chromatin signatures associated with active enhancers and gene expression changes that generally distinguish the limb bud from heterologous developmental states. We combined forelimb and hindlimb RNA-seq and ChIP-seq data sets to generate composite limb gene expression and chromatin state profiles, and compared these with the equivalent profiles from mouse embryonic stem cells (MES) and neuronal progenitor cells (NPC) (Mikkelsen et al. 2007; Creyghton et al. 2010; Guttman et al. 2010). To our knowledge, these are the only embryonic cell types for which transcriptome, H3K27ac, and H3K27me3 data are publicly available. We identified 1363 genes up-regulated in limb compared with both MES and NPC (BHP ≤0.05) (Supplemental Tables S9, S10). This gene set showed strong Gene Ontology enrichments for limb development and related functions (Supplemental Fig. S1C,D).
To detect putative limb-specific enhancers, we identified 10,968 H3K27ac intergenic and intronic-enriched regions as described above. We filtered H3K27ac regions in MES and NPC using the same criteria, and generated a merged set of regions to compare H3K27ac signals across all three tissues (Methods). K-means clustering identified 6027 “limb-specific” regions marked most strongly in limb compared with MES or NPC (Fig. 3A; Supplemental Table S11). The remaining 4941 regions are marked more strongly in MES, NPC, or both. The limb-specific regions are, on average, 693-bp long and over half are located >50 kb from the nearest transcription start site (TSS). GREAT analysis demonstrates that these regions are strongly associated with annotated limb development genes (Fig. 3B; McLean et al. 2010). Intergenic and intronic H3K27ac regions marked most strongly in MES or NPC are associated with stem cell maintenance or neuronal functions, respectively. Regions strongly marked in each tissue or cell type showed increased sequence conservation relative to random genomic regions, supporting their functional significance (Supplemental Fig. S6). Compared with random regions, limb-specific H3K27ac regions are significantly enriched near genes up-regulated in limb (Fig. 3C). Limb-specific regions were also enriched up to 190 kb from limb up-regulated genes compared with regions strongly marked in MES or NPC, suggesting that they include distant acting limb enhancers (Fig. 3D).
Figure 3.

Tissue-specific H3K27ac intergenic and intronic regions are associated with genes up-regulated in E10.5 limb. Intergenic and intronic H3K27ac regions in limb, MES, and NPC were identified and merged as described in the main text. (A) K-means clustering of H3K27ac signals (in RPKM) across 39,750 merged regions, using an 8-kb window centered on the midpoint of each region, revealed three tissue-specific classes of H3K27ac-enriched regions. (B) Selected GO Biological Process category enrichments identified by GREAT analysis of “limb-specific” H3K27ac regions. (C) Counts of limb-specific H3K27ac regions (red) relative to random sites (black) near genes up-regulated in limb. Each region was assigned to the nearest transcription start site up to 200 kb away, and enrichment of limb-specific regions near limb up-regulated genes was calculated in 10-kb bins. Error bars represent the 95% quartile of values from 1000 randomized sets of intergenic and intronic sequences. (D) Enrichment of assigning a limb (red), MES (blue), or NPC-specific region (green) to a limb up-regulated gene versus random regions used in C up to 200 kb away.
Transcription factor (TF) binding-site analysis of limb-specific H3K27ac regions provides further support that H3K27ac marks tissue-specific enhancers. We selected the top 500 H3K27ac regions from each cluster in Figure 3A based on overall signal, and identified 29 TF motifs from the JASPAR database specifically enriched in limb-specific regions compared with regions strongly marked in MES and NPC (Supplemental Table S12). These motifs are significantly enriched for homeobox TFs (Supplemental Table S13). Six TFs in this set are highly expressed in limb compared with MES and NPC: Alx3, Hoxa9, Hoxb3, Hoxd10, Hoxd13, and Lmx1b. The aggregate H3K27ac signal around each motif, both in the top 500 limb-specific regions as well as all 6027 regions, exhibits a signature of nucleosome displacement consistent with trans-factor binding (Fig. 4A; Supplemental Fig. S7A; He et al. 2010; Ernst et al. 2011). Individual elements also show strong displacement of H3K27ac signal away from the putative binding site (Fig. 4B; Supplemental Fig. S7B). H3K27ac signal within the top 500 limb-specific regions did not show displacement at limb-enriched motifs for TFs expressed at low levels in limb (RPKM <1), or at MES-enriched motifs for TFs highly expressed only in MES (Fig. 4A; Supplemental Fig. S7A). This suggests that the displacement signature we detected is due to recruitment of highly expressed TFs rather than an artifact of the analysis. We also observe a nucleosome displacement signature in limb-specific regions around motifs for trans-acting factors that are expressed in all three biological conditions, whose motifs are significantly enriched in all three enhancer sets (Supplemental Table S12; Supplemental Fig. S7A). This includes general factors such as SP1 and TBP, suggesting that developmental enhancers recruit a combination of general and tissue-specific factors.
Figure 4.

Strongly marked limb H3K27ac regions are enriched for limb transcription-factor binding sites. (A) E10.5 limb H3K27ac signal density plots normalized for input in a 20-kb window centered on limb-enriched transcription-factor (TF) motifs (Methods) for factors expressed highly in limb versus those that are expressed at low levels (RPKM <1). Those TF motifs that are enriched in limb and whose corresponding factors are highly expressed show signatures of H3K27ac modified nucleosome displacement (red). Motifs enriched in limb, but whose factors are expressed at low levels do not exhibit nucleosome displacement (blue). MES H3K27ac signal at limb-enriched motifs for TFs highly expressed in limb shows low signal and no nucleosome displacement (gray). (B) Displacement of H3K27ac signal in H3K27ac-enriched regions relative to the presence of predicted binding sites for Alx3 (top) and Hoxd13 (bottom).
We next evaluated the sensitivity and specificity of H3K27ac for detecting developmental enhancers relative to two benchmark data sets: EP300 sites identified in E11.5 limb and other tissues, and the large set of enhancers in the Vista Enhancer Browser that have been experimentally characterized at E11.5 (Visel et al. 2009; Blow et al. 2010). Although a subset of the sequences in the Vista browser was tested based on EP300 binding, to our knowledge none of the sequences were selected based on H3K27ac status. We profiled H3K27ac in E11.5 forelimb and hindlimb and generated a composite limb data set as described above. We identified 35,755 regions, of which 14,260 intergenic and intronic regions are more strongly marked in limb compared with MES and NPC (Supplemental Fig. S8). H3K27ac regions more strongly marked in E10.5 forelimb or hindlimb compared with E11.5 were weakly enriched near genes up-regulated at this timepoint, while H3K27ac regions more strongly marked in E11.5 limb showed no significant enrichment near E11.5 up-regulated genes (Supplemental Tables S14, S15; Supplemental Fig. S9; Taher et al. 2011). This is consistent with the small number of genes differentially expressed between E10.5 and E11.5 limbs (328 genes in forelimb and 348 in hindlimb, BHP ≤0.01; see Methods).
H3K27ac significantly enriches for positive enhancers at a similar level as known EP300 sites, but at lower tissue specificity (Table 1). However, the specificity of H3K27ac is increased when tissue-specific increases in H3K27ac signal are taken into account. Limb enhancers were highly significantly enriched in the set of 14,260 “limb-specific” regions compared with the 8532 H3K27ac limb regions that are more strongly marked in MES and NPC (67 vs. 7; P < 2.2 × 10⁻¹⁶, Fisher exact test). Over 45% of all limb enhancers in the Vista browser were marked by a limb-specific H3K27ac region, a significant enrichment over enhancers active in other tissues (Fig. 5A). Although E11.5 limb intergenic and intronic regions more strongly marked in either MES or NPC identified active enhancers, we did not observe any enrichment for limb enhancers (Fig. 5B). Limb-specific H3K27ac regions, but not limb regions more strongly marked in MES or NPC, also displayed a strong enrichment for limb-specific EP300 sites (Fig. 5C,D). We also ranked all H3K27ac intergenic and intronic regions in E11.5 limb by RPKM (Supplemental Fig. S10). The most highly marked (top 20%) H3K27ac regions exhibit the strongest enrichment for known limb enhancers and limb-specific EP300 sites. Strongly marked H3K27ac regions also show a greater enrichment near known limb genes, although we observe significant enrichment at all levels of H3K27ac marking. These results support a direct correlation between the quantitative level of H3K27ac marking and tissue-specific enhancer activity.
Table 1.
Identification of active enhancers by H3K27ac and EP300 in E11.5 limb
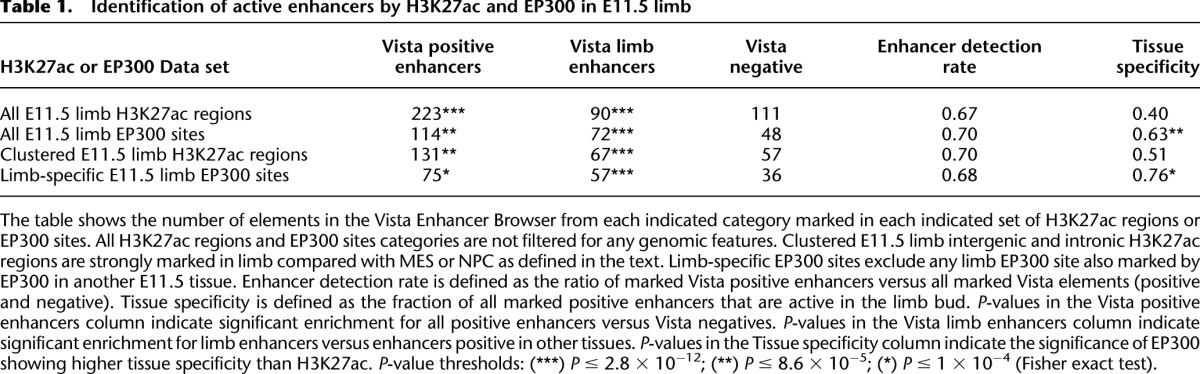
Figure 5.

H3K27ac identifies tissue specific enhancers. (A) Percentage of known enhancers from the Vista Enhancer Browser that overlap E11.5 H3K27ac regions strongly marked in limb compared with MES or NPC (from Supplemental Fig. S8). (Bars) Percentage of total positive enhancers active in the indicated tissue that are marked by H3K27ac in limb. Limb enhancers are significantly enriched versus enhancers active in other tissues (Fisher exact test). (B) Overlap of H3K27ac regions in limb that are more strongly marked in either MES or NPC and Vista enhancers. (C) Overlap of E11.5 H3K27ac regions strongly marked in limb compared with MES and NPC with tissue-specific EP300 sites. Limb EP300 sites are significantly over-represented (Fisher exact test). (D) Overlap of H3K27ac regions that are more strongly marked in either MES or NPC and tissue-specific EP300 sites. (E) Venn diagram of Vista limb enhancers marked by limb EP300, limb H3K27ac, both, or neither. (F) Representative Vista limb enhancers identified by E11.5 H3K27ac alone.
Most limb enhancers marked by H3K27ac are also marked by EP300. However, H3K27ac identifies 23 limb enhancers in the absence of EP300, suggesting that the marks are not completely redundant (Fig. 5E,F). Using the sensitivity and specificity metrics in Table 1, we estimate that in our total data set of 28,377 intergenic and intronic H3K27ac regions from E10.5 and E11.5 limbs, we have identified 19,012 enhancers active in any tissue, of which 7605 will be active in limb. The total number of developmental enhancers is likely to be considerably larger, since 36% of known active limb enhancers are not detected by either H3K27ac or EP300 (Fig. 5E). This may be due to a lack of sensitivity in the ChIP-seq data sets, or these enhancers may be marked by alternative histone modifications or trans factors.
Chromatin state signatures associated with enhancers in embryonic tissues
We characterized aggregate H3K27ac, H3K27me3, and EP300 ChIP-seq signals at known and putative enhancers to gain additional insight into overall chromatin states at these sites. As expected from the results shown in Figures 4 and 5, E11.5 limb H3K27ac signal was strongly enriched at known limb enhancers and limb EP300 sites, and exhibited a typical nucleosome displacement profile (Fig. 6A,B). E10.5 limb H3K27ac signal at limb EP300 sites showed a similar profile (Supplemental Fig. S11A). Limb EP300 signal was also enriched at limb enhancers and limb-specific H3K27ac regions (Fig. 6C,D). In contrast, H3K27me3 signal in E10.5 limb was strongly depleted at limb-specific H3K27ac regions and EP300 sites (Fig. 6E,F). These patterns are consistent with previous studies in cultured cells, which demonstrated that addition of H3K27ac and removal of H3K27me3 at enhancers accompanies the transition from a poised to an active state (Creyghton et al. 2010; Rada-Iglesias et al. 2011). We observed enrichment in our limb input control at limb-specific H3K27ac regions and EP300 sites, indicating that these sites are hypersensitive to sonication (Supplemental Fig. S11B,C). We also observed input enrichment at H3K27ac regions identified in the independent MES data set (Supplemental Fig. S11D). Based on these findings, we conclude that enhancers display a characteristic chromatin signature in the embryonic tissue in which they are active: high levels of H3K27ac, nucleosome displacement resulting in hypersensitivity, and depletion of H3K27me3.
Figure 6.

Active and inactive enhancers are marked by both EP300 and H3K27ac. (A) E11.5 limb H3K27ac signal density normalized for input was determined in a 20-kb window surrounding the center of Vista limb enhancers or positive enhancers with no limb annotation. The strongest signal and nucleosome displacement are observed at known limb positive enhancers. Active enhancers with no observed limb activity are marked with low levels of H3K27ac. Black lines represent signal at random intergenic and intronic regions. (B) E11.5 limb H3K27ac signal density normalized for input at tissue-specific intergenic and intronic EP300 sites. Signal is strongest at limb-specific EP300 sites and shows a strong signal of H3K27ac modified nucleosome displacement. Other tissue-specific EP300 sites are enriched for H3K27ac compared with random regions (black), but at lower levels. (C) Limb EP300 signal density at Vista limb enhancers or positive enhancers with no limb annotation. Signal was normalized versus random regions since no input was performed for these experiments. Limb EP300 signal is strongest at known limb enhancers, but is also present at low levels at enhancers with no limb activity. (D) EP300 signal density from four mouse tissues at E11.5 H3K27ac clustered sites. Signal was normalized versus random regions as in C. EP300 signal from limb is strongest at limb-specific H3K27ac regions, but EP300 signal from other tissues is also present at limb-specific H3K27ac regions. (E) E10.5 limb H3K27me3 signal density normalized for input at tissue-specific H3K27ac intronic and intergenic regions identified in this study. All classes show depletion of H3K27me3 versus random genomic regions (black), but limb-specific regions are most depleted. (F) E10.5 limb H3K27me3 signal density normalized for input at tissue-specific intergenic and intronic EP300 sites. All classes show depletion of H3K27me3 relative to their surrounding genomic locations. Limb and heart-specific sites exhibit depletion versus random genomic regions (black).
In contrast to previous studies, we find that enhancers exhibit components of this signature in tissues in which they are not active. H3K27ac regions in E11.5 limb mark experimentally validated enhancers with no demonstrated activity in that tissue (Fig. 5A,B; Supplemental Fig. S12). Limb H3K27ac regions also mark tissue-specific EP300 sites identified in heart, midbrain, and forebrain (Fig. 5C,D). It is unlikely that these are spurious peak calls, as we used a stringent P-value threshold of 1.0 × 10⁻⁵ in MACS to identify enriched regions. In aggregate, H3K27ac is present in the limb at these sites at lower levels compared with active limb enhancers or limb-specific EP300 sites (Fig. 6A,B; Supplemental Fig. S11A). This phenomenon is not unique to H3K27ac. EP300 is also present in limb at known enhancers with no limb activity (Fig. 6C; Table 1; Visel et al. 2009). Limb-specific H3K27ac regions show an aggregate enrichment for EP300 in E11.5 forebrain, midbrain, and heart (Fig. 6D). H3K27me3 was also depleted in limb at EP300 sites specific to other tissues, and these sites showed an aggregate signal of hypersensitivity in our E11.5 limb input control (Fig. 6F; Supplemental Fig. S9B; Auerbach et al. 2009). These results suggest that some developmental enhancers adopt a constitutive open chromatin state in multiple tissues, characterized by low levels of H3K27ac, EP300 recruitment, and H3K27me3 depletion. Tissue-specific activation for these enhancers, rather than being due to the absolute presence or absence of H3K27ac or H3K27me3, is correlated with a quantitative increase or decrease in the level of these marks.
Discussion
Determining the genes and regulatory elements that direct the formation of embryonic structures is a fundamental task in developmental biology. In this study, we used chromatin profiling to identify enhancers and characterize enhancer-associated chromatin states in the embryonic forelimb and hindlimb. Our results establish H3K27ac ChIP-seq as an efficient method for enhancer discovery in embryonic tissues. Compared with previous studies targeting EP300, H3K27ac profiling detected a greater number of putative enhancers while requiring ∼20-fold less input chromatin. Using this approach, we identified thousands of novel limb enhancers, which are enriched near known limb genes and novel genes up-regulated in limb compared with heterologous embryonic cell types. This data set constitutes a powerful resource for genetic analyses of limb development.
Notably, gene expression patterns and chromatin states in the embryonic forelimb and hindlimb are very similar at the stages we examined. We only identified 186 genes that were differentially expressed between the two tissues at E10.5. Although these expression differences were strongly correlated with chromatin state differences at promoters, we could only detect a weak association with tissue-specific chromatin states at distal sites. Moreover, we are overestimating the number of differentially expressed genes and differentially marked putative enhancers that functionally distinguish the forelimb and hindlimb. The development of the forelimb is more advanced than the hindlimb at E10.5, and several of the differentially expressed genes we identified will be the result of this delay (Wanek et al. 1989). Based on these results, it is likely that a small number of tissue-specific regulatory differences drive developmental differences between the mouse forelimb and hindlimb during the course of early limb formation.
Our study also provides insight into general chromatin signatures associated with developmental enhancers. We find that enhancers known or likely to be active in the limb show strong enrichment for H3K27ac, depletion of H3K27me3, nucleosome displacement, and hypersensitivity to sonication. Although this is consistent with studies in cultured cells and, more recently, Drosophila embryonic development (Creyghton et al. 2010; Rada-Iglesias et al. 2011; Bonn et al. 2012), such signatures have not previously been associated with tissue-specific enhancer function in the mammalian embryo. Moreover, our results suggest that developmental enhancers show low levels of H3K27ac enrichment, H3K27me3 depletion, and hypersensitivity in tissues in which they are not active. Nearly 60% of known enhancers marked by H3K27ac in E11.5 limb do not show reproducible activity in that tissue, though they are active in other tissues at that timepoint (Table 1). This is true of other active marks as well: 37% of active enhancers marked by EP300 in E11.5 limb are not active there. This signature could be derived from enhancers that are active in a small number of cells, which cannot be detected in the transgenic assay used to validate enhancers. However, it is unlikely that our ChIP-seq methods are sensitive enough to detect such enhancers. Instead, we hypothesize that developmental enhancers may adopt a constitutive “open” state in multiple tissues, characterized by low levels of active marks. Tissue-specific activation of an enhancer is associated with an increase in the abundance of each active mark above a base level, rather than binary addition or subtraction. Our results support this model: Known limb enhancers are highly enriched in H3K27ac regions showing strong tissue-specific marking in limb compared with weakly marked regions (Fig. 5; Supplemental Fig. S10). Limb-specific EP300 sites also show greater tissue specificity for known limb enhancers compared with all EP300 sites (Table 1).
Binding of pleiotropic transcription factors is one potential mechanism that could maintain developmental enhancers in an open state. Developmental enhancers consist of dense homotypic and heterotypic clusters of transcription-factor binding sites, and tissue-specific enhancer activation is thought to depend on the recruitment of tissue-specific combinations of transcription factors (Pennacchio et al. 2007, 2006; Gotea et al. 2010; Levine 2010). Our results support this hypothesis: The putative enhancers we identify show evidence of being bound by both general and tissue-specific transcription factors, resulting in nucleosome displacement and potential activation (Fig. 4; Supplemental Fig. S7). However, enhancers have the potential to recruit transcription factors in any tissue where those factors are expressed. These binding events could result in weak recruitment of coactivators including EP300, which, in turn, would introduce low levels of H3K27ac or other active chromatin modifications. Such collateral marking could be due to constitutively expressed transcription factors, or factors that are shared between developing tissues with a similar regulatory architecture. For example, normal limb and heart development depends in part on several common transcription factors, including Tbx4, Tbx5, and Hand2 (Plageman and Yutzey 2005; Koshiba-Takeuchi et al. 2006; Yang et al. 2006). We note that heart-specific EP300 sites show the greatest level of collateral H3K27ac enrichment and H3K27me3 depletion in limb, and limb-specific H3K27ac sites show the highest collateral marking by EP300 in heart (Fig. 6). Although this mechanism may maintain enhancers in a low-level open state, the absence of critical tissue-specific transcription factors could prevent downstream gene activation. Enhancers would become active and increase target gene expression only in tissues where the sufficient combination of transcription factors is available (Göke et al. 2011).
This model and our results both indicate that comparisons of chromatin-state signatures across tissues are necessary to globally identify tissue-specific enhancers. Although we have shown H3K27ac alone can be used to detect a large number of enhancers active in any tissue, cross-tissue comparisons of H3K27ac increase its specificity. Moreover, neither H3K27ac nor EP300 is sufficient to capture all enhancers, as nearly 40% of known limb enhancers are not identified by either mark. Future studies to identify enhancers should therefore include additional histone modifications or other factors and target multiple tissues at different developmental stages. The approach and technical methods we describe here allow rapid, high-throughput profiling of chromatin states in limiting amounts of embryonic tissues, making such comprehensive large-scale in vivo enhancer mapping feasible.
Methods
RNA-seq and ChIP-seq
All animals were sacrificed according to approved Yale IACUC protocols. For RNA-seq, forelimb and hindlimb buds were each dissected from two separate litters of six E10.5 murine embryos in cold PBS and placed in RNALater (Qiagen). Total RNA was extracted using the RNEasy Kit (Qiagen) and prepared for sequencing with the Illumina mRNA-seq Sample Prep Kit. Samples were sequenced on an Illumina GA IIx (35-bp single end (SE) reads).
For each ChIP-seq experiment, forelimb and hindlimb buds from ∼50 E10.5 or ∼20 E11.5 embryos were dissected as above. For each litter, dissected limb buds were briefly homogenized and cross-linked with 1% formaldehyde at room temperature with rotation for 15 min. Cross-linking was quenched, then tissue was washed and flash frozen. Nuclei were extracted, lysed, and sonicated (30 min, 10-sec pulses) to produce sheared chromatin with an average length of ∼250 bp. Fifty micrograms of final soluble chromatin was used for each ChIP and combined with Protein G Dynabeads (Invitrogen) prebound with 10 μg of antibodies to H3K27me3 (Millipore 07-449) or H3K27ac (Abcam ab4729). Immunoprecipitated chromatin was washed five times with 1 mL of wash buffer and once with TE. Immunoprecipiated chromatin was eluted, cross-links were reversed, and DNA was purified. Chromatin H3K27me3 experiments were prepared for sequencing using the Illumina ChIP-seq kit. For H3K27ac experiments chromatin was prepared for sequencing using the Illumina ChIP-seq kit with the substitution of Illumina multiplexing adapters and indexing primers. H3K27me3 libraries were sequenced on an Illumina GA IIx (75-bp SE reads). H3K27ac multiplexed libraries were sequenced on an Illumina HiSeq (75-bp PE reads).
QPCR validation of ChIP-seq peaks, differentially expressed genes, novel TARs, and novel splices
For validation of enriched regions identified in ChIP-seq experiments, 100 pg of chromatin from input or ChIP samples was used as template in a 20-μL reaction containing 1× PowerSybr Master Mix (ABI) and 1.25 μM Primers. Ct values were determined in triplicate on an ABI StepOnePlus instrument. Enrichments were calculated from ΔCt values between ChIP and input samples for each target.
For validation of all RNA species, total RNA was extracted as described above and 5 ug was reverse transcribed using random hexamers and SuperScript III First strand synthesis kit (Invitrogen). Reverse transcription and negative control reactions were diluted 10-fold and 1 μL was used as template for qPCR with conditions as above. Differential gene expression was determined as a ΔΔCt value for a target normalized for Actb levels in each tissue. Novel splice reactions were analyzed on an agarose gel to ensure correct size novel splice product, as canonical splice forms were frequently detected and prevented accurate Ct value assignment. Primers for all regions, RNAs, and cloning are located in Supplemental Table S16.
Read alignment, splice identification, and expression-level quantification
RNA-seq and ChIP-seq reads were aligned to mouse reference genome sequences (mm9) using Bowtie (Langmead et al. 2009), keeping only uniquely mapped reads. ChIP-seq reads were aligned to all nonrandom (chr1–chr19, chrX, chrY, chrM) chromosome sequences. The reference for RNA-seq data was built using all mm9 nonrandom chromosomes plus a custom splice junction library built from UCSC Known Genes annotation. All annotated transcripts for a single gene were combined to produce a composite gene model. Portions of a gene model that overlap another gene model were excluded from analysis. The splice junction library consisted of 60-bp sequences that extended 30 bp from the splice site. All pairwise combinations of exons that maintained annotated transcriptional order were considered. The junction library was built using RSEQtools (Habegger et al. 2011). We used RSEQtools and custom perl scripts to derive RPKM (reads per kilobase of exon model per million mapped reads) (Mortazavi et al. 2008) values for composite gene models. Novel splices were identified using RNA-seq reads that map to unannotated splice junctions in the junction library. Statistics for all sequencing runs and resulting alignments are listed in Supplemental Table S17. We identified genes differentially expressed between E10.5 and E11.5 using mouse-limb microarray data from Taher et al. (2011). Differential expression analysis was performed using the limma R package (Smyth 2004).
Novel TARs
Novel TARs were called based on minimum 0.5× coverage at each base per million reads outside UCSC Known Genes regions, with a maximum 20-bp gap and a minimum 100-bp length. Novel TARs from all four limb replicates were merged into one set if they overlapped by 1 bp or more. RPKM values for novel TARs were calculated on this merged set. Homology with mouse RefSeq proteins was assessed using blastx with an E value cutoff of 0.1 (Supplemental Table S18; McGinnis and Madden 2004).
Identifying histone modification enriched regions
MACS was used to identify peaks in ChIP-seq data compared with an input sample fore each tissue (nomodel model and 1 × 10⁻⁵ P-value cut-off) (Zhang et al. 2008; Feng et al. 2011). Peaks in respective limb, MES, and NPC replicates within 1 kb of each other were merged. To identify intergenic and intronic marked regions, merged peaks that were within 1.5 kb upstream of a known promoter, overlapped an exon, or had a novel TAR (called at 0.2× minimum coverage) within 2 kb were filtered out. For K-means clustering, merged regions in all three tissue/celltypes were again merged using a minimum 1-bp overlap. BEDTools were used for merging and filtering of these regions (Quinlan and Hall 2010).
MES, NPC, and limb expression data
Paired-end 75-bp RNA-seq reads for MES and NPC RNA-seq data were obtained from Guttman et al. (2010). We trimmed reads to 35 bp and treated them as single end during alignment in order to minimize biases in identifying differentially expressed genes between mouse limb and MES/NPC. Single-end 35-bp MES and NPC H3K27ac ChIP-seq reads were obtained from Creyghton et al. (2010). Single-end 27–36-bp MES H3K4me3 and H3K27me3 ChIP-seq reads were obtained from Mikkelsen et al. (2007). E10.5 and E11.5 microarray data were obtained from Taher et al. (2011).
Fisher exact test
To identify gene differences between forelimb and hindlimb for each biological replicate and between two replicates for each tissue, we applied the Fisher exact test, which is commonly used as two-sample comparisons in count data (Bullard et al. 2010). Replicates were tested using a 2 × 2 contingency table (Supplemental Table S19) with rows corresponding to each gene and columns corresponding to tissue type. We performed this test between tissues in each replicate as an individual analysis. The P-value is computed by summation of probabilities less than or equal to the probability of the observed table based on the hypergeometric distribution.
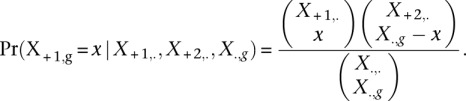 |
If the P-value is significant by a given cutoff, the null distribution that there is no difference between tissues is rejected. This same approach was used to identify differentially marked H3K27ac regions between E10.5 and E11.5 limb.
Log linear regression model based with Poisson distribution
We compared the transcriptomes of mouse E10.5 forelimb and hindlimb buds using a log linear model based on a Poisson link coupled with a likelihood ratio test to allow a combined analysis of both biological replicates by pooling samples (Marioni et al. 2008; Bullard et al. 2010). With a Poisson link, 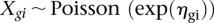 and read count for given gene g represented by
  for gene g in sample
  belonging to group
  , the log linear model is
  , where
  is the parameter of interest representing the biological effect (e.g., a tissue-specific expression difference between forelimb and hindlimb) and
  is a secondary factor representing the individual replicate effect. The same approach was applied to identify differentially expressed genes that distinguish the limb from MES and NPC, and to identify H3K27ac regions differentially marked between forelimb and hindlimb.
Likelihood ratio test statistics for log linear regression model
For each gene, by controlling the difference of two biological replicates as a secondary factor in the log linear model, we identified tissue-specific differentially expressed genes using a likelihood ratio test for the log linear model with a Poisson link. Under the null hypothesis,
Two nested models (Model 1: There is a significant difference between two limb buds; Model 2: no difference) are compared by likelihood ratio statistics for each given gene and the maximum likelihood estimation for (λ, θ) is calculated. Twice the log likelihood ratio is obtained between maximum likelihood when parameters satisfy the null hypothesis, and maximum likelihood when parameters satisfy the alternative hypothesis. This difference is then tested by χ2 distribution in the following equation:
Similarly, we conducted a log linear model coupled with a likelihood ratio test for examining genes that distinguish the limb from heterologous developmental states. In the analysis, we identified differentially expressed genes between E10.5 limb bud and mouse embryonic stem cells (MES) or mouse neuronal progenitor cells (NPC).
K-means clustering
Merged H3K27ac regions for limb, MES, and NPC were separated into three tissue/cell-type-specific clusters using k-means clustering. We defined an 8-kb window centered on the midpoint of each element and divided this into 40 bins (200 bp each). RPKMs for each bin were calculated in each tissue or cell type (for multiple replicates, the average of RPKMs in individual replicates were used), such that each element was represented by a vector of 120 values (40 values for each condition, three conditions in total). Values for each element were then normalized (each value in the vector for a given element subtracted by a mean of 120 values and then divided by their standard deviation) and subject to k-means clustering using R (http://cran.r-project.org/).
Gene ontology analysis of differentially expressed genes and intergenic H3K27 regions
Genes identified by hierarchical clustering as being more highly expressed in a particular tissue were used as gene lists for the DAVID web tool v6.7 (Dennis et al. 2003). All 27,189 genes used for differential expression were input as a background list. H3K27ac or H3K27me3 regions identified in limb, MES, or NPC were submitted to the GREAT web tool v1.8.1 (McLean et al. 2010). The whole mouse genome was used as a background sequence for all analysis. Default association rules and settings were used.
Tissue-specific enhancer and gene association
Each limb-specific region identified by k-means clustering was assigned to the nearest TSS. Assignment of a limb-specific region to a limb up-regulated gene was counted in 10-kb bins up to 200 kb away. The same analysis was performed for randomly selected regions by shuffling the same number, size, and chromosome distribution of H3K27ac regions in the mm9 genome excluding exonic and promoter regions. Calculations for random regions were done for 1000 times. Error bars represent a 95% quantile of values from 1000 randomizations. For enhancer enrichment limb, MES or NPC-specific regions were assigned to the nearest TSS. Assignment of a tissue-specific region to a limb up-regulated gene was counted as above. Enrichment is calculated as the fold difference versus random regions in each bin for each tissue-specific class of regions. The same approach was used to associate differentially marked regions between E10.5 forelimb and hindlimb or between E10.5 and E11.5 limb with genes up-regulated in the respective context.
Transcription-factor motif analysis
Position weight matrices for mouse transcription factors were retrieved from JASPAR (Sandelin et al. 2004). The genomic sequence 500 bp upstream of and downstream from the center of the top 500 H3K27ac regions based on signal for each tissue-specific cluster was retrieved from UCSC (mm9). Binding sites were identified within each set of 500 sequences using FIMO (P < 0.00001) (Grant et al. 2011). One-thousand shuffled sets of each tissue-specific set of regions were generated and analyzed with FIMO. Enrichment of a transcription factor motif was indicated if the total number of counts in a tissue-specific set was greater than the top 95% of values obtained from shuffled sequence sets.
ChIP-seq signal aggregation
Aggregation plots were generated with a custom perl script as follows: For every region tested, a window of ±10,000 bp from the center of the region was defined and broken into 400 equal 50-bp windows. For every window in each region, a signal density was determined by averaging a normalized read count in that 50-bp window. To generate the genome-wide aggregation plots, the signal density from each window was averaged across all regions. This gives a genome-wide, average signal intensity plot from −10,000 to +10,000 bp around the center of every region of interest. For H3K27ac and H3K27me3 aggregations, input density scores were subtracted from ChIP-seq density scores. For EP300 aggregations, the signal at random regions was subtracted from the tissue-specific regions specified.
Data access
The raw sequence data, alignments, signal tracks, and peak calls from this study have been submitted to the NCBI Gene Expression Omnibus (GEO) (http://www.ncbi.nlm.nih.gov/geo/) under accession number GSE30641.
Acknowledgments
We thank the Yale Center for Genome Analysis for sequencing services. This work was supported by NIH GM094780 (J.P.N.), a career award from the Edward J. Mallinckrodt Jr. Foundation (J.P.N.), an Andersen Foundation Fellowship (J.C.), an NSF Graduate Research Fellowship (S.K.R.), the A.L. Williams Professorship funds (M.B.G.), and funds from the Yale School of Medicine.
Footnotes
[Supplemental material is available for this article.]
Article published online before print. Article, supplemental material, and publication date are at http://www.genome.org/cgi/doi/10.1101/gr.129817.111.
References
- Auerbach RK, Euskirchen G, Rozowsky J, Lamarre-Vincent N, Moqtaderi Z, Lefrançois P, Struhl K, Gerstein M, Snyder M 2009. Mapping accessible chromatin regions using Sono-Seq. Proc Natl Acad Sci 106: 14926–14931 [DOI] [PMC free article] [PubMed] [Google Scholar]
- Blow MJ, McCulley DJ, Li Z, Zhang T, Akiyama JA, Holt A, Plajzer-Frick I, Shoukry M, Wright C, Chen F, et al. 2010. ChIP-seq identification of weakly conserved heart enhancers. Nat Genet 42: 806–810 [DOI] [PMC free article] [PubMed] [Google Scholar]
- Bonn S, Zinzen RP, Girardot C, Gustafson EH, Perez-Gonzalez A, Delhomme N, Ghavi-Helm Y, Wilczyński B, Riddell A, Furlong EEM 2012. Tissue-specific analysis of chromatin state identifies temporal signatures of enhancer activity during embryonic development. Nat Genet 48: 148–156 [DOI] [PubMed] [Google Scholar]
- Boyer LA, Plath K, Zeitlinger J, Brambrink T, Medeiros LA, Lee TI, Levine SS, Wernig M, Tajonar A, Ray MK, et al. 2006. Polycomb complexes repress developmental regulators in murine embryonic stem cells. Nature 441: 349–353 [DOI] [PubMed] [Google Scholar]
- Bullard JH, Purdom E, Hansen KD, Dudoit S 2010. Evaluation of statistical methods for normalization and differential expression in mRNA-seq experiments. BMC Bioinformatics 11: 94 doi: 10.1186/1471-2105-11-94 [DOI] [PMC free article] [PubMed] [Google Scholar]
- Creyghton MP, Cheng AW, Welstead GG, Kooistra T, Carey BW, Steine EJ, Hanna J, Lodato MA, Frampton GM, Sharp PA, et al. 2010. Histone H3K27ac separates active from poised enhancers and predicts developmental state. Proc Natl Acad Sci 107: 21931–21936 [DOI] [PMC free article] [PubMed] [Google Scholar]
- DeLaurier A, Schweitzer R, Logan M 2006. Pitx1 determines the morphology of muscle, tendon, and bones of the hindlimb. Dev Biol 299: 22–34 [DOI] [PubMed] [Google Scholar]
- Dennis G, Sherman BT, Hosack DA, Yang J, Gao W, Lane HC, Lempicki RA 2003. DAVID: Database for annotation, visualization, and integrated discovery. Genome Biol 4: 3 doi: 10.1183/gb-2003-4-5-p3 [PubMed] [Google Scholar]
- Ernst J, Kellis M 2010. Discovery and characterization of chromatin states for systematic annotation of the human genome. Nat Biotechnol 28: 817–825 [DOI] [PMC free article] [PubMed] [Google Scholar]
- Ernst J, Kheradpour P, Mikkelsen TS, Shoresh N, Ward LD, Epstein CB, Zhang X, Wang L, Issner R, Coyne M, et al. 2011. Mapping and analysis of chromatin state dynamics in nine human cell types. Nature 473: 43–49 [DOI] [PMC free article] [PubMed] [Google Scholar]
- Feng J, Liu T, Zhang Y 2011. Using MACS to identify peaks from ChIP-seq data. Curr Protoc Bioinformatics doi: 10.1002/0471250953bi0214s34 [DOI] [PMC free article] [PubMed] [Google Scholar]
- Gotea V, Visel A, Westlund JM, Nobrega MA, Pennacchio LA, Ovcharenko I 2010. Homotypic clusters of transcription factor binding sites are a key component of human promoters and enhancers. Genome Res 20: 565–577 [DOI] [PMC free article] [PubMed] [Google Scholar]
- Göke J, Jung M, Behrens S, Chavez L, O'Keeffe S, Timmermann B, Lehrach H, Adjaye J, Vingron M 2011. Combinatorial binding in human and mouse embryonic stem cells identifies conserved enhancers active in early embryonic development. PLoS Comput Biol 7: e1002304 doi: 10.1371/journal.pcbi.1002304 [DOI] [PMC free article] [PubMed] [Google Scholar]
- Grant CE, Bailey TL, Noble WS 2011. FIMO: Scanning for occurrences of a given motif. Bioinformatics 27: 1017–1018 [DOI] [PMC free article] [PubMed] [Google Scholar]
- Guttman M, Garber M, Levin JZ, Donaghey J, Robinson J, Adiconis X, Fan L, Koziol MJ, Gnirke A, Nusbaum C, et al. 2010. Ab initio reconstruction of cell type-specific transcriptomes in mouse reveals the conserved multi-exonic structure of lincRNAs. Nat Biotechnol 28: 503–510 [DOI] [PMC free article] [PubMed] [Google Scholar]
- Habegger L, Sboner A, Gianoulis TA, Rozowsky J, Agarwal A, Snyder M, Gerstein M 2011. RSEQtools: A modular framework to analyze RNA-seq data using compact, anonymized data summaries. Bioinformatics 27: 281–283 [DOI] [PMC free article] [PubMed] [Google Scholar]
- He HH, Meyer CA, Shin H, Bailey ST, Wei G, Wang Q, Zhang Y, Xu K, Ni M, Lupien M, et al. 2010. Nucleosome dynamics define transcriptional enhancers. Nat Genet 42: 343–347 [DOI] [PMC free article] [PubMed] [Google Scholar]
- Heintzman ND, Hon GC, Hawkins RD, Kheradpour P, Stark A, Harp LF, Ye Z, Lee LK, Stuart RK, Ching CW, et al. 2009. Histone modifications at human enhancers reflect global cell-type-specific gene expression. Nature 459: 108–112 [DOI] [PMC free article] [PubMed] [Google Scholar]
- King M, Arnold JS, Shanske A, Morrow BE 2006. T-genes and limb bud development. Am J Med Genet A 140: 1407–1413 [DOI] [PubMed] [Google Scholar]
- Koshiba-Takeuchi K, Takeuchi JK, Arruda EP, Kathiriya IS, Mo R, Hui C-C, Srivastava D, Bruneau BG 2006. Cooperative and antagonistic interactions between Sall4 and Tbx5 pattern the mouse limb and heart. Nat Genet 38: 175–183 [DOI] [PubMed] [Google Scholar]
- Langmead B, Trapnell C, Pop M, Salzberg SL 2009. Ultrafast and memory-efficient alignment of short DNA sequences to the human genome. Genome Biol 10: R25 doi: 10.1186/gb-2009-10-3-r25 [DOI] [PMC free article] [PubMed] [Google Scholar]
- Levine M 2010. Transcriptional enhancers in animal development and evolution. Curr Biol 20: R754–R763 [DOI] [PMC free article] [PubMed] [Google Scholar]
- Marioni JC, Mason CE, Mane SM, Stephens M, Gilad Y 2008. RNA-seq: an assessment of technical reproducibility and comparison with gene expression arrays. Genome Res 18: 1509–1517 [DOI] [PMC free article] [PubMed] [Google Scholar]
- McGinnis S, Madden TL 2004. BLAST: at the core of a powerful and diverse set of sequence analysis tools. Nucleic Acids Res 32: W20–W25 [DOI] [PMC free article] [PubMed] [Google Scholar]
- McLean CY, Bristor D, Hiller M, Clarke SL, Schaar BT, Lowe CB, Wenger AM, Bejerano G 2010. GREAT improves functional interpretation of cis-regulatory regions. Nat Biotechnol 28: 495–501 [DOI] [PMC free article] [PubMed] [Google Scholar]
- Mikkelsen TS, Ku M, Jaffe DB, Issac B, Lieberman E, Giannoukos G, Alvarez P, Brockman W, Kim T-K, Koche RP, et al. 2007. Genome-wide maps of chromatin state in pluripotent and lineage-committed cells. Nature 448: 553–560 [DOI] [PMC free article] [PubMed] [Google Scholar]
- Mortazavi A, Williams BA, McCue K, Schaeffer L, Wold B 2008. Mapping and quantifying mammalian transcriptomes by RNA-seq. Nat Methods 5: 621–628 [DOI] [PubMed] [Google Scholar]
- Pasini D, Malatesta M, Jung HR, Walfridsson J, Willer A, Olsson L, Skotte J, Wutz A, Porse B, Jensen ON, et al. 2010. Characterization of an antagonistic switch between histone H3 lysine 27 methylation and acetylation in the transcriptional regulation of Polycomb group target genes. Nucleic Acids Res 38: 4958–4969 [DOI] [PMC free article] [PubMed] [Google Scholar]
- Pennacchio LA, Ahituv N, Moses AM, Prabhakar S, Nobrega MA, Shoukry M, Minovitsky S, Dubchak I, Holt A, Lewis KD, et al. 2006. In vivo enhancer analysis of human conserved non-coding sequences. Nature 444: 499–502 [DOI] [PubMed] [Google Scholar]
- Pennacchio LA, Loots GG, Nobrega MA, Ovcharenko I 2007. Predicting tissue-specific enhancers in the human genome. Genome Res 17: 201–211 [DOI] [PMC free article] [PubMed] [Google Scholar]
- Plageman TF, Yutzey KE 2005. T-box genes and heart development: putting the “T” in heart. Dev Dyn 232: 11–20 [DOI] [PubMed] [Google Scholar]
- Quinlan AR, Hall IM 2010. BEDTools: a flexible suite of utilities for comparing genomic features. Bioinformatics 26: 841–842 [DOI] [PMC free article] [PubMed] [Google Scholar]
- Rada-Iglesias A, Bajpai R, Swigut T, Brugmann SA, Flynn RA, Wysocka J 2011. A unique chromatin signature uncovers early developmental enhancers in humans. Nature 470: 279–283 [DOI] [PMC free article] [PubMed] [Google Scholar]
- Sandelin A, Alkema W, Engström P, Wasserman WW, Lenhard B 2004. JASPAR: an open-access database for eukaryotic transcription factor binding profiles. Nucleic Acids Res 32: D91–D94 [DOI] [PMC free article] [PubMed] [Google Scholar]
- Smyth GK 2004. Linear models and empirical Bayes methods for assessing differential expression in microarray experiments. Stat Appl Genet Mol Biol 3: 3 doi: 10.2202/1544-6115.1027 [DOI] [PubMed] [Google Scholar]
- Taher L, Collette NM, Murugesh D, Maxwell E, Ovcharenko I, Loots GG 2011. Global gene expression analysis of murine limb development. PLoS ONE 6: e28358 doi: 10.1371/journal.pone.0028358 [DOI] [PMC free article] [PubMed] [Google Scholar]
- Tie F, Banerjee R, Stratton CA, Prasad-Sinha J, Stepanik V, Zlobin A, Diaz MO, Scacheri PC, Harte PJ 2009. CBP-mediated acetylation of histone H3 lysine 27 antagonizes Drosophila Polycomb silencing. Development 136: 3131–3141 [DOI] [PMC free article] [PubMed] [Google Scholar]
- Visel A, Minovitsky S, Dubchak I, Pennacchio LA 2007. VISTA Enhancer Browser–a database of tissue-specific human enhancers. Nucleic Acids Res 35: D88–D92 [DOI] [PMC free article] [PubMed] [Google Scholar]
- Visel A, Blow MJ, Li Z, Zhang T, Akiyama JA, Holt A, Plajzer-Frick I, Shoukry M, Wright C, Chen F, et al. 2009. ChIP-seq accurately predicts tissue-specific activity of enhancers. Nature 457: 854–858 [DOI] [PMC free article] [PubMed] [Google Scholar]
- Wanek N, Muneoka K, Holler-Dinsmore G, Burton R, Bryant SV 1989. A staging system for mouse limb development. J Exp Zool 249: 41–49 [DOI] [PubMed] [Google Scholar]
- Yang L, Cai C-L, Lin L, Qyang Y, Chung C, Monteiro RM, Mummery CL, Fishman GI, Cogen A, Evans S 2006. Isl1Cre reveals a common Bmp pathway in heart and limb development. Development 133: 1575–1585 [DOI] [PMC free article] [PubMed] [Google Scholar]
- Zhang Y, Liu T, Meyer CA, Eeckhoute J, Johnson DS, Bernstein BE, Nusbaum C, Myers RM, Brown M, Li W, et al. 2008. Model-based analysis of ChIP-seq (MACS). Genome Biol 9: R137 doi: 10.1186/gb-2008-9-9-r137 [DOI] [PMC free article] [PubMed] [Google Scholar]