Abstract
Background
Barrett’s esophagus (BE) is the predominant risk factor for the development of esophageal adenocarcinoma. BE is characterized by intestinal metaplasia with goblet cells. Reflux of bile acids is known to induce intestinal metaplasia, but the mechanisms are unclear. Inhibition of Notch signaling accompanied by increased Hath1 and induction of caudal homeobox 2 (CDX2) may be involved in development of intestinal goblet cells.
Methods
Esophageal adenocarcinoma cell lines OE19 and OE33 were exposed for up to 8 hours to DCA (100–300 μM), and for up to 24 hours with and without the γ-secretase inhibitor, DAPT (20μM). Notch signaling components and CDX2 levels were measured by real-time PCR (for mRNA) and by Western blot analysis (for proteins).
Results
DCA induced a time and concentration dependent decrease in Notch pathway components mRNAs in OE33 and in the proteins in both cell lines. CDX2 mRNA and Hath1 protein were increased in OE19 by 3-fold. Inhibition of Notch pathway by DAPT decreased downstream Notch signaling mRNAs and proteins in both cell lines and increased Hath1 and CDX2 proteins only in OE19.
Conclusion
Bile acid inhibition of Notch signaling in esophageal cells is correlated with an increase in Hath1 and CDX2 and may be one of the key processes contributing to the formation of BE.
The cellular and molecular events underlying the metaplastic process clinically recognized as Barrett’s esophagus (BE) are largely unknown. It is clear that in a proportion of patients with gastroesophageal reflux disease normal squamous epithelium of the lower esophagus is replaced by columnar epithelium, which may have several histologic phenotypes.1 The presence of an esophageal mucosa resembling intestinal epithelium and containing mucus producing goblet cells, defines Barrett’s esophagus in most countries.2 Barrett’s esophagus is known to be a key risk factor for the development of esophageal adenocarcinoma, a lethal malignancy with a rapidly rising incidence.3,4 Current hypotheses suggest that Barrett’s esophagus develops as a consequence of an altered differentiation pathway of stem cells present in the esophageal wall.5 Exposure of the esophageal stem cells to the pathologic milieu of luminal contents known to be present in patients with gastroesophageal reflux, including acid and bile salts, may affect their cellular biology and differentiation. Among these luminal stimulants are bile salts. Whether the putative stem cell population resides in the basal layer of the esophageal epithelium, in the submucosal glands, or is derived from circulating bone marrow precursors is unknown; experimental and limited clinical data support each hypothesis.5–7
Advances in genetic and stem cell technology have led to a basic understanding of the events responsible for normal intestinal development. Several signaling pathways, including Wnt, BMP, and sonic Hedgehog have been shown to play a fundamental role in both embryonic intestinal development, and, importantly, adult intestinal homeostasis.8,9 Notch signaling is among these, and is thought to be one of the major pathways controlling differentiation toward a secretory cell lineage, including goblet cells.10 Active Notch signals inhibit differentiation, functionally preserving precursor cells in an undifferentiated state in the basal layer of the epithelium, while inhibition of the pathway leads to the production of secretory cells.11–14
Notch receptor-ligand interactions are a highly conserved mechanism, originally described in developmental studies using Drosophila, that regulate intercellular communication and direct individual cell fate. Notch receptors and ligands have been identified in mammalian cells and function as transmembrane proteins.10 Studies using constitutively activated Notch receptors missing their intracellular domains (Notch IC) have shown that Notch signaling determines differentiation, proliferation and apoptosis in several mammalian cell types.13–15 Notch IC is translocated to the nucleus where it interacts with the CSL family of transcription factors to become a transcriptional activator and can then modulate the expression of Notch target genes that regulate cell fate decisions. These targets include the “hairy/enhancer of split” (Hes) gene, HES related transcription factors (Hrt), and downstream target gene Math1 that are critically involved in mammalian cell differentiation.15–23
Caudal homeobox gene 2 (CDX2) is a transcription factor known to be important in embryonic intestinal differentiation.24–30 We, and others, previously have shown that bile salts induce CDX2 in esophageal and other epithelial cell lines.24–26 The aim of this study was to test the hypothesis that exposure of esophageal cells to the bile acid, deoxycholic acid (DCA), results in inhibition of the Notch pathway, with alterations in its downstream effectors Hes, Hrt, and Hath and induction of CDX2 expression. To mechanistically connect bile acid inhibition of Notch signaling and induction of CDX2, we also studied the effect of a well-characterized inhibitor of γ-secretase (DAPT), the key activation enzyme of the Notch receptor protein, on CDX2 expression.
MATERIALS AND METHODS
Cell lines culture and treatments
Cell lines were obtained from European Collection of Cell Culture (ECACC) (Salisbury, Wiltshire, UK). OE19, ECACC #96071721 is a moderately differentiated esophageal adenocarcinoma cell (EAC) line and OE33, #9670808 is a poorly differentiated EAC. Both cell lines were cultured in RPMI1640 (Mediatech Inc., Manassas, VA) supplemented with 10% FBS, 100 u/ml penicillin and 100 μg/ml streptomycin. At 70–80% confluence, the cells were incubated with increasing concentration of DCA at neutral pH for up to 8h or with the γ-secretase inhibitor N-{N-93,5-Difluorophenacetyl-L-alanyl}-S-phenylglycine t-but (DAPT) for 24h. RNAs or proteins were extracted as previously described.24 Incubation time, DCA (as the most potent CDX2 inducer and as amounts in pathological refluxate) and its concentrations were chosen according to previously published results (preliminary data not shown).1,24,25
Real-time reverse transcriptase Polymerase Chain Reaction (PCR) (real-time PCR)
RNA extraction, complementary DNA (cDNA) synthesis and Real-Time PCR analysis and the primers for CDX2 were performed exactly as previously described.24 Primers used are: Notch1, forward 5′-cagggtgtgcactgtgagat-3′, reverse 5′-gacaggcactcgttgacatc-3′, Notch3, forward 5′-tgtggacgagtgctctatcg-3′, reverse 5′-aatgtccacctcgcaatagg-3′, Hrt-1 forward 5′-cgaggtggagaaggagagtg-3′, reverse 5′-ctgggtaccagc cttctcag-3′, Hrt-2 forward 5′-tactttgacgcacacgctct-3′, reverse 5′-tactttgacgcacacgctct-3′, Hes-5 forward 5′-gagtgtgcctggtggtctg-3′, reverse 5′-ggcttccacgtgactgagag-3′, Hes-1 forward 5′-ccctgtagccgcagagaa-3′, reverse 5′-gctaccatcactccccagag-3′. GAPD was used as normalizer.
Western blot and densitometry analyses
Western blot analysis was performed exactly as previously described with actin as normalizer.2 Antibodies used in this study and their concentrations are: Secondary antibodies were from Jackson ImmunoResearch Laboratories, Inc. (West Grove, PA) unless otherwise indicated. From Cell Signaling Technology (Danvers, MA): Both primary and secondary antibodies for γ-secretase Cleaved Notch1 (Notch1C) (Val1744) (1:1,000, secondary 1:5,000) and Notch3 (1:1,000, secondary 1:1,000). From Bethyl Laboratories, Inc. (Montgomery, TX): CDX2 (1:1,000, secondary 1:10,000). From Developmental Studies Hybridoma Bank (DSHB), Department of Biology, University of Iowa (Iowa City, IA): bTAN20 (human Notch1) (1:1,000, secondary 1:10,000). (Source acknowledgments: The monoclonal antibody, bTAN20, developed by Spyros Artavanis-Tsakonas was obtained from the DSHB developed under the auspices of the NICHD and maintained by the University of Iowa, Department of Biological Sciences, Iowa City, IA.)
From BioVision Research Products, (Mountain View, CA): Hath1/Math1/Atoh1 (1:500, anti rabbit, secondary 1:40,000). From Aviva Antibody Corporation (San Diego, CA): Hes1 (1:500, secondary 1:40,000).
Statistical analysis
Results are presented as mean ± SEM. When appropriate, 1-way ANOVA with Newman-Keuls post-test or paired t test was used. All experiments including those of data not shown were performed with n ≥ 3.
RESULTS
Deoxycholic acid inhibits Notch receptor protein and mRNA expression
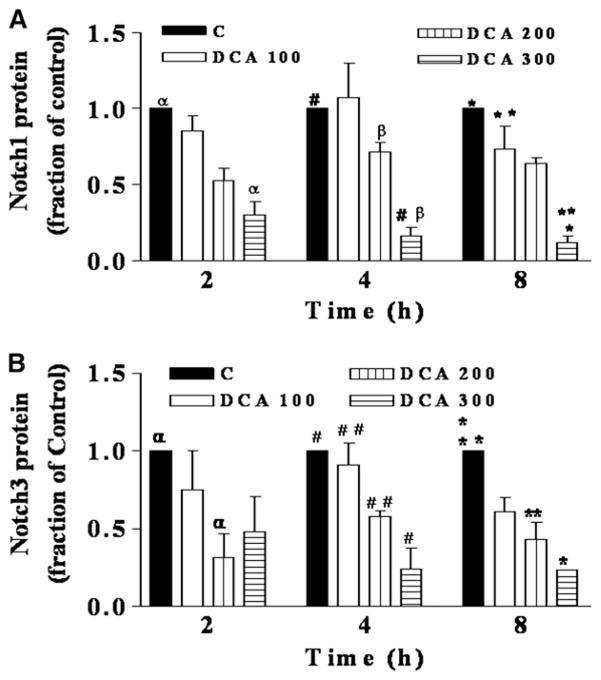
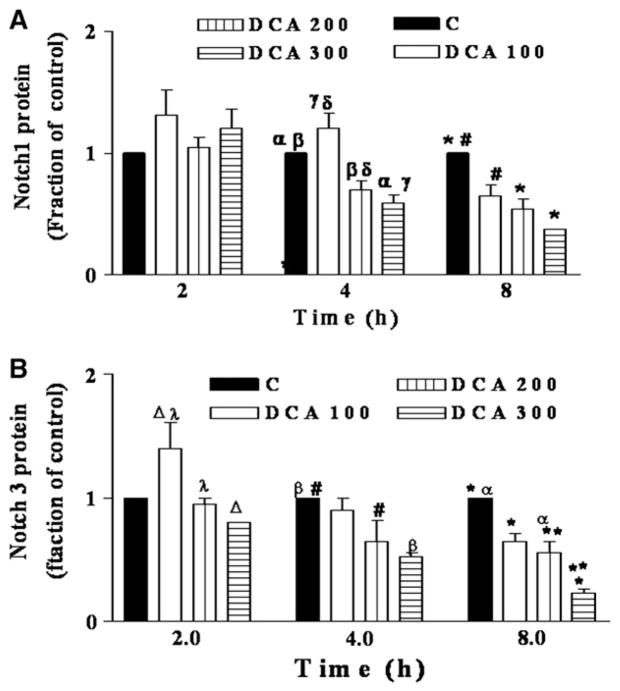
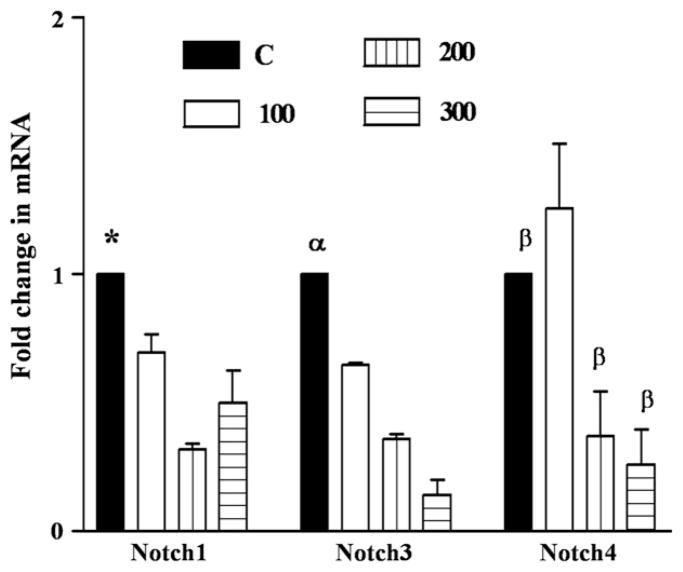
Figure 1 (OE19) and Fig 2 (OE33) show a time and concentration dependent decrease in the levels of Notch receptor proteins 1 and 3 following exposure to 100–300 μM DCA from 2 to 8 hours. Notch receptors protein levels decreased by a maximum of 4.3 (Notch 3) to 8 (Notch 1) fold after an 8-hour exposure to 300 μM DCA. To investigate whether the decrease in Notch signaling proteins also occurred at the gene transcription level, real-time PCR was performed on RNA extracted from both cell lines with and without bile acid exposure. Notch1, 3, and 4 mRNA levels decreased 2–8-fold in a time and concentration dependent manner in OE33 cells (Fig 3).
Fig 1.
In OE19 cells, Notch1 and Notch3 protein levels are decreased by DCA in a concentration and time dependent manner. OE19 cells were exposed to DCA (0–300 μM) for 2–8 h. Cells were lysed and proteins were subjected to Western blot analysis. DCA concentrations in μM. C (0), 100, 200–300. Blots from 3 experiments for each Notch were subjected to quantitative densitometry. Control at each time point was set to 1. (A) Notch1: for 2 hours: αP < .01; for 4 h: #P < .01; βP < .05; for 8 hours: *P < .01; **P < .05. (B) Notch3: for 2 hours: αP < .01; for 4 hours: #, ##P < .01; for 8 hours: *P < .05; **P < .01.
Fig 2.
In OE33 cells, Notch1 and Notch3 protein levels are decreased by DCA in a concentration and time dependent manner. OE33 cells were exposed to DCA concentration and analyzed as in Fig 1. DCA concentrations in μM: C (0), 100, 200–300. Blots from 3–8 experiments were subjected to quantitative densitometry. Control at each time point was set to 1. (A) Notch1: for 4 hours: αP < .01; βP < .05; γP < .01; δP < .01. For 8 hours: *P < .01; **P < .01; #P < .01. (B) Notch3: for 2 hours: ΔP < .001; λP < .01; for 4 hours: βP < .01; #P < .05. For 8 hours: *P < .001; **P < .05; αP < .01.
Fig 3.
In OE33 Notch1, 3 and 4 mRNA levels are decreased by DCA in a concentration dependent manner. OE33 cells were exposed to DCA concentration (0–300 μM) for 8 h. RNA was extracted, reverse transcribed to cDNA and subjected to real-time PCR, n = 3: for Notch1: *P < .0001–P < .05 for all DCAs vs control and 200 vs 300 μM DCA. For Notch3: αP < .001–P < .01 for DCA vs control and vs each of DCA concentration. For Notch4: βP < .05 for 200 and 300 μM DCA vs control. C (0), 100, 200, 300 are DCA concentrations in μM.
Bile acid induced alterations in Notch pathway transcription factors Hes1 and Hath1 proteins and mRNA
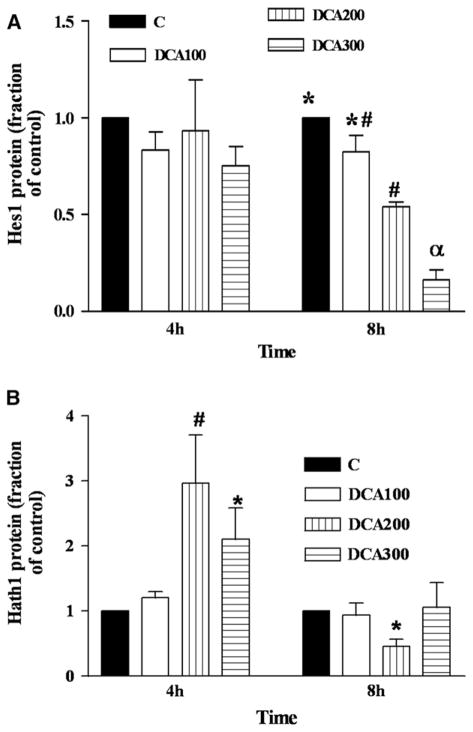
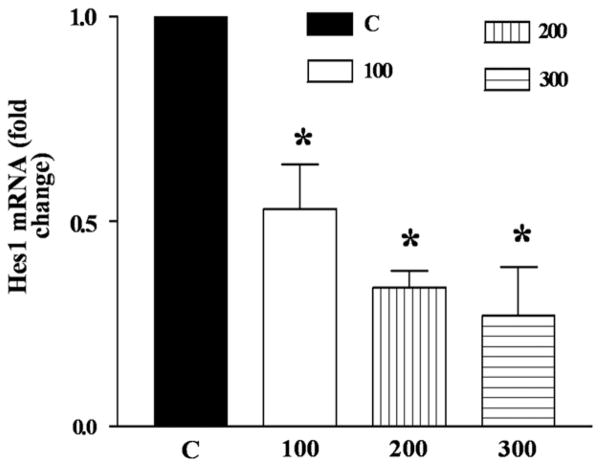
We next investigated the effects of DCA on expression of Notch downstream transcription factors proteins Hes1 and Hath1 and on Hes1 message. Levels of both Hes1 and Hath1 proteins were greater at baseline in OE33 cells than in OE19 (data not shown). Hes1 protein decreased by 6-fold after 8 hours exposure to 300 μM DCA in OE19 cells (Fig 4, A), while Hath1 protein increased by 3-fold after 4 hours exposure to 200 μM DCA (Fig 4, B). There was no significant change in these proteins in OE33 cells (data not shown). Thus, Notch receptor downregulation by DCA was followed by inhibition of Hes1 and activation of Hath1 at the protein level. Ordinarily, Hath1 synthesis is inhibited by Hes1. Hes1 mRNA decreased by a maximum of 4-fold in a concentration dependent manner in OE33 cells (Fig 5).
Fig 4.
In OE19, Hes1 protein is downregulated and Hath1 protein is upregulated by DCA in a concentration and time dependent manner. OE19 cells were exposed for 4 and 8 h to DCA concentration in μM: C(0),100, 200, 300. Blots from 3 experiments for each. (A) Hes1 and (B) Hath1 proteins were subjected to quantitative densitometry. (A) Hes1: For 8 hours, αP < .001 for all and also for 200 μM DCA versus control. #P < .01 for 200 μM DCA versus 100 μM DCA and *P < .05 for 100 μM DCA vs C. (B) Hath1: #P < .01 versus all except DCA 300 μM at 4 hours; *P < .05 for 200 μM DCA at 8 hours vs 300 μM DCA at 4 hours.
Fig 5.
In OE33, Hes1 mRNA levels are decreased by DCA in a concentration dependent manner. OE33 cells were exposed for 8 h to DCA concentration in μM C (0), 100, 200, 300). RNA was extracted, reverse transcribed to cDNA and subjected to real-time PCR. n = 3: *P < .01–P < .05 for all DCA treated vs control.
Effect of Notch pathway specific inhibitor and DCA on CDX2 protein and mRNA expression
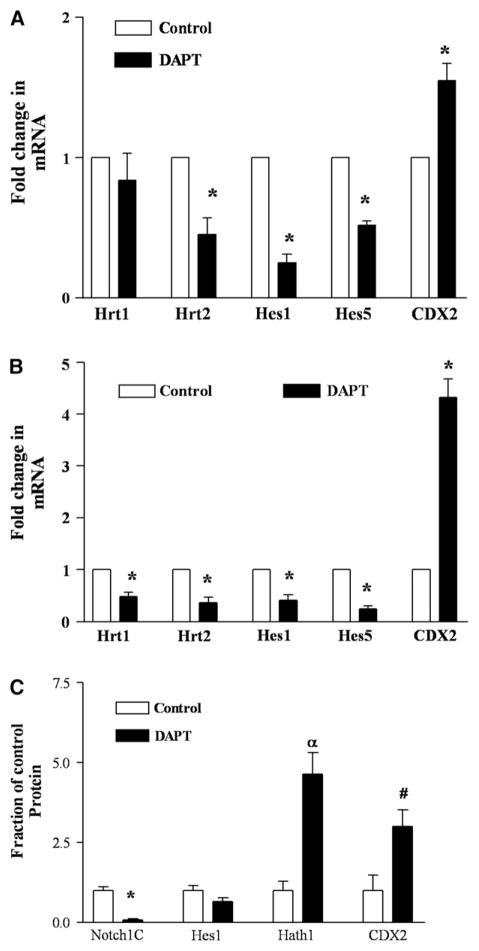
Basal levels of CDX2 mRNA and protein in OE19 and OE33 were determined by real-time PCR and Western blot analysis in equal amounts of total RNA or protein, respectively. CDX2 mRNA was 4.1 ± 0.98 (n = 3; P < .05) and the protein 7.6 ± 2.9 (n = 10; P < .04) fold greater in the poorly differentiated OE33 cells than in the moderate-well differentiated OE19 cells. To mechanistically connect bile acid inhibition of Notch signaling and induction of CDX2, the effect of a well characterized Notch inhibitor on Notch pathway proteins was studied. Cell cultures were incubated for 24 hours with 20 μMDAPT, a potent inhibitor of γ-secretase, the key activation enzyme of the Notch receptor protein. In both cell lines DAPT inhibition of Notch signaling induced an increase in CDX2 mRNA from 1.5 (OE33) (Fig 6, A) to 4.3 fold (OE19) (Fig 6, B). CDX2 protein was increased 2.7-fold by DAPT inhibition in OE19 (Fig 6, C). Effective inhibition was confirmed by quantification of the intracellular-γ-secretase cleaved Notch1 fragment, Notch1C, using a specific antibody which recognizes only the cleaved fragment and by quantification of Hes1 and Hath1 proteins. DAPT decreased the amounts of Notch1C in OE19 and OE33 by 14-fold (Fig 6, C) and 4-fold (data not shown), respectively. Hes1 protein decrease (almost by half) approached significance and Hath1 increased by 4.6-fold (Fig 6, C). Effective inhibition was also shown by a concomitant and significant decrease in mRNA of Notch downstream transcription factors Hes1/5 and Hrt1/2 in both cell lines (Fig 6, A and B).
Fig 6.
Inhibition of γ-secretase by DAPT decreases cleaved Notch1 and downstream transcription factors and increases expression of the downstream Hath1 and CDX2. OE33 and OE19 were exposed to the γ-secretase inhibitor DAPT (20μM) for 24h. (A, B) RNA and (C) proteins were extracted and subjected to Real-Time PCR for the indicated mRNAs or to Western blot analysis for the proteins (A) OE33 (*P < .0001–P < .015), (B) OE19 (*P < .0001–P < .015), (C) OE19, (αP < 0.03; *P < .007, #P < .02). Controls were set to 1 and fold change is represented. n = 3–5.
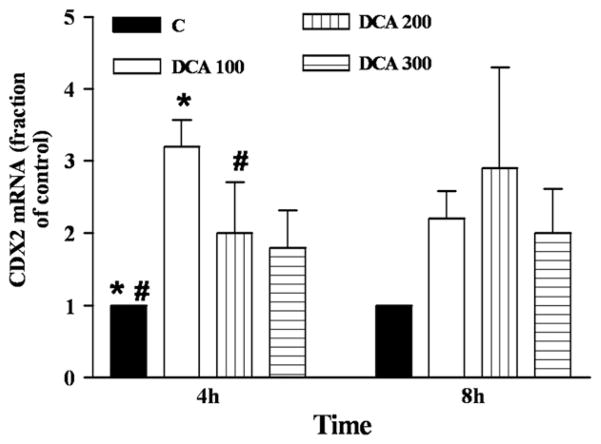
Exposure of the cells to increasing concentrations of DCA resulted in a 3-fold increase in CDX2 mRNA (4 hours, 100 μM DCA) in OE19 (Fig 7) but not in OE33 cells (data not shown). CDX2 protein amounts did not change in either cell line (data not shown) suggesting the incubation time of up to 8h might not allow for CDX2 protein synthesis. Greater duration of exposure to DCA at 100 μM was toxic to the cells. Collectively, these data indicate that inhibition of γ-secretase and DCA decreased Notch signaling thereby increasing Hath1 and CDX2 in OE19 cells.
Fig 7.
DCA increases CDX2 mRNA in OE19. OE19 cells were incubated with the indicated amounts of DCA (in μM) for 4 and 8 hours and the amount of CDX2 mRNA was determined by real-time PCR. n = 3–9. *P < .001, #P < .01.
DISCUSSION
We have shown that in esophageal adenocarcinoma cell lines (OE19/OE33), DCA decreases Notch receptors and Notch downstream proteins, thereby increasing the transcription factor Hath1 (Figs 1–5). The data suggest that DCA-induced Notch signaling inhibition is not via inhibition of γ-secretase, since Notch1C did not decrease in excess of the decrease in Notch1 (data not shown). Although Notch receptor proteins and mRNA were downregulated in both cell lines, there was modest variability in signaling responses between the two, likely due to their relative genetic backgrounds. Uncharacteristic changes are more likely to occur and to be more pronounced in the poorly differentiated OE33 than in the moderately differentiated OE19 cells.
The presence of a gene responsible for creating notches in the wings of fruit flies (Drosophila) was reported as early as 1919.17 Classic Mendelian mutational analysis showed that the gene was involved in cell fate decisions. The Notch gene encodes a 300-kD transmembrane receptor and consists of a relatively small family of cell surface signaling molecules. Mutations of the Notch receptor result in developmental abnormalities in all animals tested.18 Notch signaling has been shown to regulate proliferation and cell fate determination within the intestinal epithelium.19 Interestingly, conditional knockout mice in which the RBP-Jk transcriptional binding component is absent, and/or treatment with γ-secretase inhibitor, results in goblet cell formation and suppression of enterocyte and epithelial proliferation.19,20 In contrast, constitutive Notch activation depletes the secretory cell lineage and increases proliferation in intestinal epithelium.11 Hath-1 (Atoh1 in Drosophila and Math1in the mouse) deficient mice exhibit the loss of several secretory cell lineages, suggesting that this Notch regulated transcription factor is important in early secretory cell fate decisions.15 Scoville et al nicely review the current knowledge of intestinal stem cells and signaling including Notch.8
Although several studies link inhibition of Notch signaling followed by induction of Hath1 in the intestine to production of goblet cells, to the best of our knowledge this link has not been studied in the esophagus.11,16,20 It is interesting that bile acids, well known to be present in the esophageal lumen of patients with Barrett’s esophagus, inhibit primary signaling pathways whose down regulation is involved in the determination of goblet cells differentiation. Notch receptors and ligands are highly expressed in basal layer of the esophagus and weakly in the more superficial epithelial layers. Acting in concert with other signaling cascades, they likely control the equilibrium between progenitors and mature esophageal cells.20 Disruption of this equilibrium by components of refluxed gastric juice including bile acids may lead to the development of an epithelium containing goblet cells characteristic of Barrett’s esophagus.
Notch inhibition either by knockdown of its signaling components or by γ-secretase inhibition has been shown to induce regression of adenomas to post-mitotic goblet cells.22 In addition, increase in Hath1 following inhibition of Notch signaling reduces the prevalence of cancer in experimental colon cancer models.22,23 These data suggest the theoretical possibility that inhibition of Notch signaling and induction of Hath1 in patients with dysplastic Barrett’s esophagus may reverse the neoplastic process to a less aggressive goblet cell phenotype. The use of biologic agents affecting cell signaling is a well established clinical paradigm in 2009.
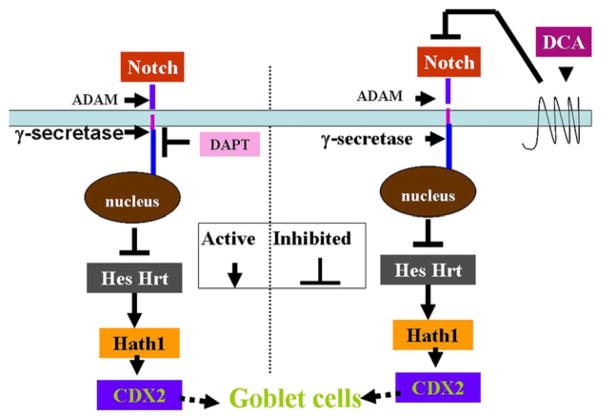
The transcription factor CDX2 is considered to be a key component responsible for the metaplastic intestinal phenotype of BE.26,27 It is absent from the normal squamous esophageal epithelium, but has been shown to be highly expressed in human Barrett’s esophagus, and is readily induced in experimental animal models of Barrett’s epithelium.28,29 As we and others have shown in other esophageal cell lines, DCA also induced an increase in CDX2 mRNA in OE19 cells (3-fold).24,25,30 As such, we investigated the relationship between inhibition of Notch signaling and the induction of CDX2. Inhibition of Notch signaling by a γ-secretase inhibitor, induced Hath1 and CDX2 mRNA and protein, indicating that CDX2 induction might occur downstream of Notch signaling under these conditions (Fig 6 and the scheme in Fig 8, left). Taken together, the observations that DCA also inhibits Notch signaling and the repeated observations that bile acid stimulation increases CDX2 expression, indirectly suggest that Notch signaling may be, in part or wholly, responsible for bile acid induced CDX2 changes. Further studies with greater mechanistic detail are necessary to prove causality.
Fig 8.
A simplified scheme of the correlation between Notch signaling components and CDX2 amounts determined in the study with and without inhibition by DCA and DAPT. Left, γ-secretase inhibitor DAPT decreases the amounts of Notch1C, inhibits Hrt/Hes, increases the amounts of Hath1 and CDX2 and probably leads to goblet cells production. Right, inhibition of the pathway by DCA (an unknown mechanism) decreases the total amounts of Notch receptors, thereby reducing the amounts of Notch1C, inhibits production of Hes/Hrt, increases amounts of Hath1 and CDX2, and may lead to goblet cells. An arrow indicates activation and a blocked arrow indicates inhibition. Broken arrow, suggested processes.
The available knowledge of Notch signaling and its relationship to CDX2 expression in the intestine suggests that it is a highly complex process that is dependent on the cell and tissue context as well as on manipulations of the cells in health and disease. Several studies, where Notch signaling components have been knocked down and goblet cells induced, report no change in CDX2 expression, although most of these do not contain a stimulus such as bile acids.31,32 A negative feedback of CDX2 on Notch signaling has been shown. CDX2 over-expression can induce Notch signaling inhibition.33 A few words of caution are warranted: Experiments in which CDX2 is knocked down or over-expressed in OE19 cells may shed more light on the mechanistic details. Experiments should be conducted also in acidic pH and a mixture of bile acids to mimic the refluxate environment; and importantly, although neoplastic cell lines are commonly used as an in-vitro model to discern cellular mechanisms, the ultimate in-vitro model is “normal” primary esophageal cells.
In conclusion, bile acid exposure results in inhibition of Notch signaling in human esophageal adenocarcinoma cells and is accompanied by an increase in the Notch downstream transcription factor Hath1 and CDX2, factors known to be partially or wholly responsible for the intestinal phenotype (Fig 8). These data suggest that Notch signaling and its alteration by esophageal luminal content may be one of the key processes contributing to the formation of the goblet enriched IM characterizing Barrett’s esophagus.
References
- 1.Chandrasoma PKDT. GERD Reflux to Esophageal Adenocarcinoma. Academic Press Elsevier; 2008. [Google Scholar]
- 2.Sharma P, McQuaid K, Dent J, Fennerty MB, Sampliner R, Spechler S, et al. A critical review of the diagnosis and management of Barrett’s esophagus: the AGA Chicago Workshop. Gastroenterology. 2004;127:310–30. doi: 10.1053/j.gastro.2004.04.010. [DOI] [PubMed] [Google Scholar]
- 3.Lagergren J, Bergstrom R, Lindgren A, Nyren O. Symptomatic gastroesophageal reflux as a risk factor for esophageal adenocarcinoma. N Engl J Med. 1999;340:825–31. doi: 10.1056/NEJM199903183401101. [DOI] [PubMed] [Google Scholar]
- 4.Pohl H, Welch HG. The role of overdiagnosis and reclassification in the marked increase of esophageal adenocarcinoma incidence. J Natl Cancer Inst. 2005;97:142–6. doi: 10.1093/jnci/dji024. [DOI] [PubMed] [Google Scholar]
- 5.Fitzgerald RC. Molecular basis of Barrett’s oesophagus and oesophageal adenocarcinoma. Gut. 2006;55:1810–20. doi: 10.1136/gut.2005.089144. [DOI] [PMC free article] [PubMed] [Google Scholar]
- 6.Croagh D, Thomas RJ, Phillips WA, Kaur P. Esophageal stem cells-a review of their identification and characterization. Stem Cell Rev. 2008;4:261–8. doi: 10.1007/s12015-008-9031-3. [DOI] [PubMed] [Google Scholar]
- 7.Leedham SJ, Thliveris AT, Halberg RB, Newton MA, Wright NA. Gastrointestinal stem cells and cancer: bridging the molecular gap. Stem Cell Rev. 2005;1:233–41. doi: 10.1385/SCR:1:3:233. [DOI] [PubMed] [Google Scholar]
- 8.Scoville DH, Sato T, He XC, Li L. Current view: intestinal stem cells and signaling. Gastroenterology. 2008;134:849–64. doi: 10.1053/j.gastro.2008.01.079. [DOI] [PubMed] [Google Scholar]
- 9.Ishizuya-Oka A, Hasebe T. Sonic hedgehog and bone morphogenetic protein-4 signaling pathway involved in epithelial cell renewal along the radial axis of the intestine. Digestion. 2008;77 (Suppl 1):42–47. doi: 10.1159/000111487. [DOI] [PubMed] [Google Scholar]
- 10.Katoh M. Notch signaling in gastrointestinal tract (review) Int J Oncol. 2007;30:247–51. [PubMed] [Google Scholar]
- 11.Fre S, Huyghe M, Mourikis P, Robine S, Louvard D, Artavanis-Tsakonas S. Notch signals control the fate of immature progenitor cells in the intestine. Nature. 2005;435:964–8. doi: 10.1038/nature03589. [DOI] [PubMed] [Google Scholar]
- 12.Yan M, Plowman GD. Delta-like 4/Notch signaling and its therapeutic implications. Clin Cancer Res. 2007;13:7243–6. doi: 10.1158/1078-0432.CCR-07-1393. [DOI] [PubMed] [Google Scholar]
- 13.Wong GT, Manfra D, Poulet FM, Zhang Q, Josien H, Bara T, et al. Chronic treatment with the gamma-secretase inhibitor LY-411,575 inhibits beta-amyloid peptide production and alters lymphopoiesis and intestinal cell differentiation. J Biol Chem. 2004;279:12876–82. doi: 10.1074/jbc.M311652200. [DOI] [PubMed] [Google Scholar]
- 14.Jensen J, Pedersen EE, Galante P, Hald J, Heller RS, Ishibashi M, et al. Control of endodermal endocrine development by Hes-1. Nat Genet. 2000;24:36–44. doi: 10.1038/71657. [DOI] [PubMed] [Google Scholar]
- 15.Shroyer NF, Helmrath MA, Wang VY, Antalffy B, Henning SJ, Zoghbi HY. Intestine-specific ablation of mouse atonal homolog 1 (Math1) reveals a role in cellular homeostasis. Gastroenterology. 2007;132:2478–88. doi: 10.1053/j.gastro.2007.03.047. [DOI] [PubMed] [Google Scholar]
- 16.Yang Q, Bermingham NA, Finegold MJ, Zoghbi HY. Requirement of Math1 for secretory cell lineage commitment in the mouse intestine. Science. 2001;294:2155–6. doi: 10.1126/science.1065718. [DOI] [PubMed] [Google Scholar]
- 17.Mohr OL. Character changes caused by mutation of an entire region of a chromosome in Drosophila. Genetics. 1919;4:275–82. doi: 10.1093/genetics/4.3.275. [DOI] [PMC free article] [PubMed] [Google Scholar]
- 18.Artavanis-Tsakonas S, Rand MD, Lake RJ. Notch signaling: cell fate control and signal integration in development. Science. 1999;284:770–6. doi: 10.1126/science.284.5415.770. [DOI] [PubMed] [Google Scholar]
- 19.van Es JH, Clevers H. Notch and Wnt inhibitors as potential new drugs for intestinal neoplastic disease. Trends Mol Med. 2005;11:496–502. doi: 10.1016/j.molmed.2005.09.008. [DOI] [PubMed] [Google Scholar]
- 20.Milano J, McKay J, Dagenais C, Foster-Brown L, Pognan F, Gadient R, et al. Modulation of notch processing by gamma-secretase inhibitors causes intestinal goblet cell metaplasia and induction of genes known to specify gut secretory lineage differentiation. Toxicol Sci. 2004;82:341–58. doi: 10.1093/toxsci/kfh254. [DOI] [PubMed] [Google Scholar]
- 21.van Es JH, van Gijn ME, Riccio O, van den Born M, Vooijs M, Begthel H, et al. Notch/gamma-secretase inhibition turns proliferative cells in intestinal crypts and adenomas into goblet cells. Nature. 2005;435:959–63. doi: 10.1038/nature03659. [DOI] [PubMed] [Google Scholar]
- 22.Leow CC, Romero MS, Ross S, Polakis P, Gao WQ. Hath1, down-regulated in colon adenocarcinomas, inhibits proliferation and tumorigenesis of colon cancer cells. Cancer Res. 2004;64:6050–7. doi: 10.1158/0008-5472.CAN-04-0290. [DOI] [PubMed] [Google Scholar]
- 23.Leow CC, Polakis P, Gao WQ. A role for Hath1, a bHLH transcription factor, in colon adenocarcinoma. Ann N Y Acad Sci. 2005;1059:174–83. doi: 10.1196/annals.1339.048. [DOI] [PubMed] [Google Scholar]
- 24.Avissar NE, Toia L, Hu Y, Watson TJ, Jones C, Raymond DP, et al. Bile acid alone, or in combination with acid, induces CDX2 expression through activation of the epidermal growth factor receptor (EGFR) J Gastrointest Surg. 2009;13:212–22. doi: 10.1007/s11605-008-0720-7. [DOI] [PubMed] [Google Scholar]
- 25.Hu Y, Williams VA, Gellersen O, Jones C, Watson TJ, Peters JH. The pathogenesis of Barrett’s esophagus: secondary bile acids upregulate intestinal differentiation factor CDX2 expression in esophageal cells. J Gastrointest Surg. 2007;11:827–34. doi: 10.1007/s11605-007-0174-3. [DOI] [PubMed] [Google Scholar]
- 26.Souza RF, Krishnan K, Spechler SJ. Acid, bile, and CDX: the ABCs of making Barrett’s metaplasia. Am J Physiol Gastro-intest Liver Physiol. 2008;295:G211–8. doi: 10.1152/ajpgi.90250.2008. [DOI] [PubMed] [Google Scholar]
- 27.Groisman GM, Amar M, Meir A. Expression of the intestinal marker Cdx2 in the columnar-lined esophagus with and without intestinal (Barrett’s) metaplasia. Mod Pathol. 2004;17:1282–8. doi: 10.1038/modpathol.3800182. [DOI] [PubMed] [Google Scholar]
- 28.Lord RV, Brabender J, Wickramasinghe K, DeMeester SR, Holscher A, Schneider PM, et al. Increased CDX2 and decreased PITX1 homeobox gene expression in Barrett’s esophagus and Barrett’s-associated adenocarcinoma. Surgery. 2005;138:924–31. doi: 10.1016/j.surg.2005.05.007. [DOI] [PubMed] [Google Scholar]
- 29.Vallböhmer D, DeMeester SR, Peters JH, Oh DS, Kuramochi H, Shimizu D, et al. Cdx-2 expression in squamous and metaplastic columnar epithelia of the esophagus. Dis Esophagus. 2006;19:260–6. doi: 10.1111/j.1442-2050.2006.00586.x. [DOI] [PubMed] [Google Scholar]
- 30.Kazumori H, Ishihara S, Rumi MA, Kadowaki Y, Kinoshita Y. Bile acids directly augment caudal related homeobox gene Cdx2 expression in oesophageal keratinocytes in Barrett’s epithelium. Gut. 2006;55:16–25. doi: 10.1136/gut.2005.066209. [DOI] [PMC free article] [PubMed] [Google Scholar]
- 31.Shroyer NF, Wallis D, Venken KJ, Bellen HJ, Zoghbi HY. Gfi1 functions downstream of Math1 to control intestinal secretory cell subtype allocation and differentiation. Genes Dev. 2005;19:2412–7. doi: 10.1101/gad.1353905. [DOI] [PMC free article] [PubMed] [Google Scholar]
- 32.Benahmed F, Gross I, Guenot D, Jehan F, Martin E, Domon-Dell C, et al. The microenvironment controls CDX2 homeobox gene expression in colorectal cancer cells. Am J Pathol. 2007;170:733–44. doi: 10.2353/ajpath.2007.060696. [DOI] [PMC free article] [PubMed] [Google Scholar]
- 33.Mutoh H, Sakamoto H, Hayakawa H, Arao Y, Satoh K, Nokubi M, et al. The intestine-specific homeobox gene Cdx2 induces expression of the basic helix-loop-helix transcription factor Math1. Differentiation. 2006;74:313–21. doi: 10.1111/j.1432-0436.2006.00074.x. [DOI] [PubMed] [Google Scholar]


