Abstract
Motivation: Despite the rapid decline in sequencing costs, sequencing large cohorts of individuals is still prohibitively expensive. Recently, several sophisticated pooling designs were suggested that can identify carriers of rare alleles in large cohorts with a significantly smaller number of pools, thus dramatically reducing the cost of such large-scale sequencing projects. These approaches use combinatorial pooling designs where each individual is either present or absent from a pool. One can then infer the number of carriers in a pool, and by combining information across pools, reconstruct the identity of the carriers.
Results: We show that one can gain further efficiency and cost reduction by using ‘weighted’ designs, in which different individuals donate different amounts of DNA to the pools. Intuitively, in this situation, the number of mutant reads in a pool does not only indicate the number of carriers, but also their identity.
We describe and study a powerful example of such weighted designs, using non-overlapping pools. We demonstrate that this approach is not only easier to implement and analyze but is also competitive in terms of accuracy with combinatorial designs when identifying rare variants, and is superior when sequencing common variants.
We then discuss how weighting can be incorporated into existing combinatorial designs to increase their accuracy and demonstrate the resulting improvement using simulations. Finally, we argue that weighted designs have enough power to facilitate detection of common alleles, so they can be used as a cornerstone of whole-exome sequencing projects.
Contact: saharon@post.tau.ac.il
1 INTRODUCTION
The need for low-cost large-scale rare mutation screens is on the rise, with the current shift of genome-wide association studies towards rare variants (Manolio et al., 2009). Another major application of rare variants genotyping is in prenatal screens for rare genetic disorders; for example, the Israeli ministry of health sponsors carrier screening tests for a list of 36 severe and frequent genetic diseases (with prevalence higher than 1 in 1000 live births) in 35 different localities/communities (Zlotogora et al., 2009). The Israeli ministry of health also provides free-of-charge screening for Tay–Sachs, a recessive neurodegenerative disorder which is fatal by the age of 2–3, to couples of Jewish descent (Risch, 2001; Zlotogora et al., 2009), as well as screens for Thalassemia (an inherited autosomal recessive blood disease) to all the Arab and Druze populations and Jews of Mediterranean or Asiatic descent (Zlotogora et al., 2009).
Recent studies have described how sophisticated pooling designs for high-throughput sequencing (HTS) technologies can be used to dramatically reduce the number of pools required for carrier identification, and, therefore, can reduce the costs of such large scale carrier screens drastically (Erlich et al., 2009, 2010; Prabhu and Peer, 2009; Shental et al., 2010). The cost reduction is accomplished because most of the cost of such projects is typically in the capture stage, which has to be performed only once per pool. Reducing the capture cost, even at the price of increasing the amount of sequencing, can lead to very significant decrease in overall cost (see typical calculations in Section 6.2 below).
Using a smaller number of pools reduces the overall ability to reconstruct the genomes, but the theory of sparse signal recovery, also known as compressed-sensing (Candès et al., 2006; Donoho, 2006), guarantees that with high probability the carriers of rare mutations can be identified.
In the traditional pooled testing setup, the result of testing each pool is a True/False value (Du and Hwang, 1999; 2006). This is the framework adopted by Prabhu and Peer (2009) who use the number of wild-type and mutant allele reads in each pool to infer whether a pool contains carriers or not.
However, the information obtained by sequencing a pool of mixed DNA is not limited to a True/False indication as to the presence of a carrier in the pool. The number of mutant and wild-type allele reads can be used to infer the number of carriers within each pool, where a high number of mutant reads is an indication of a high proportion of mutant allele carriers in the pool. This difference between the typical pooled testing scenario and the technology scenario was the basis of several recent works (Erlich et al., 2009; Shental et al., 2010) which suggested more complicated designs that take the specific scenario into account and design more efficient pooling and decoding strategies for identification of rare allele carriers. Shental et al. (2010) take a random design approach to identify extremely rare carriers while Erlich et al. (2009) take a more structured approach and use a design based on the Chinese reminder theorem (CRTD) to identify rare allele carriers. These designs allow for the identification of multiple carriers. Another design which has been used in similar contexts is the shifted transversal design (STD) (Thierry-Mieg, 2006; Xin et al., 2009).
One common feature of these designs is that they are all combinatorial: each individual is either present in a pool or absent from it. Using this combinatorial approach, one can, at best, hope to infer the number of carriers in a pool but not their identity. This information is accumulated across the overlapping pools and the identity of the carriers is then decoded in a manner reminiscent of the way one solves a Sudoku puzzle.
Limiting the discussion to such combinatorial designs is usually considered good practice in the pooled testing and experiment design literature (Du and Hwang, 2006). However, this may well be due to the fact that the usual pooled testing setup is one where the results of testing each pool are True/False as described earlier. Since we have deviated from the usual framework, there is no longer a reason to assume that combinatorial designs are optimal in any sense. In the case of DNA pools, it is possible to pool together different amounts of DNA from different individuals. We call such designs, where the amount of DNA used is not constant, ‘weighted’ designs. In such designs, the results of sequencing a pool can be used not only to infer the number of carriers in a pool, but also to gain some information as to the identity of the carrier within the pool.
We describe a straightforward pooling scheme, a non-overlapping weighted design (NWD), where the individuals are divided to same-sized groups and each group is pooled and sequenced together, but each individual contributes a different amount of DNA to the pool. We describe how to derive optimal designs in this setup, and study the performance of these designs. The accuracy of these designs has a different pattern than the accuracy of the combinatorial designs. While the former slowly degrades as the prevalence of carriers increases, the latter maintains perfect accuracy for very rare mutations, but collapses at some point, when the carriers are too dense. It is, therefore preferable to use NWDs when the genetic variations of interest are more common. We then describe a hybrid approach, which uses a combinatorial design as a base design, and applies weighting to each pool of the design. We show, using simulations, that hybrid designs outperform their corresponding combinatorial designs. Finally, we discuss the possibility of using NWDs for common variant detection, which might enable significant cost reduction of large-scale whole-exome and whole-genome sequencing projects.
The rest of this article is organized as follows. Section 2 provides some intuition as to why weighting might prove a powerful concept. Section 3 describes a mathematical model of the pooling and sequencing process. Section 4 describes the NWD in more detail. Section 5 describes the hybrid approach which can dramatically increase the ability to correctly genotype rare mutations using overlapping pools designs. Section 6 studies the performance of NWDs, and compares the performance of hybrid designs and combinatorial designs using simulations. Section 6.1 describes how NWDs can be used for common allele sequencing and Section 6.2 briefly discusses the potential reduction in sequencing costs. Section 7 concludes our work.
2 MOTIVATION
Consider the following interesting riddle: You are given a set of n coins, one of which is counterfeit and, therefore, has a lighter weight. What is the minimal number of weighing required to identify the counterfeit coins using a spring scale? Such spring scale riddles were studied extensively [see Guy et al. (1995) for an overview] and for simple versions of this riddle the solution generally requires O(dlog(n)) weighings, where n is the number of coins, and d is the (known) number of counterfeit coins (Bshouty, 2009).
Next, consider a well known but less studied variation of this riddle: instead of n coins, we now have n coin piles, one of which contains counterfeit coins. In this case, the counterfeit pile can be found with a single weighing by taking i coins from the i-th pile and weighing all the selected coins together. Even if the number of counterfeit piles is unknown, they can all be identified with a single weighing. This requires taking ai coins from the i-th pile such that the sequence {ai}i=1n is a subset-sum-distinct sequence. A straightforward solution is to take 2i−1 coins from the i-th pile, but denser subset-sum distinct solutions exist such as the Conway–Guy sequence (Guy, 1982).
These riddles demonstrate the power of weighted designs. The former riddle is solved using combinatorial designs, where each coin is either included of excluded from each weighting. The latter riddle allows us to take a different number of coins from each pile to and construct a much better strategy. The fact that we use a different number of coins from each pile allows us eventually to identify any number of counterfeit coin piles with a single weighing.
The pooled sequencing scheme resembles the coin piles problem in the fact that we can pool different amounts of DNA from each individual similarly to the way we take a different number of coins from each pile. However, there are two important differences. First, with pooled sequencing our measurements are noisy—the proportion of mutant reads does not correspond directly to the proportion of mutant reads in the pool. Second, the number of carriers in a group follows a Binomial distribution, with the parameter p being the minor allele frequency (MAF) which is either known or unknown, depending on the exact scenario. However, in the following sections we demonstrate how taking the weighted approach can dramatically increase the power of pooling designs, just as it did for the riddles described above.
3 MODEL OF A POOLING SCHEME
We start by describing a model of the pooling and sequencing process. A pooling design involving k pools and n diploid individuals is given by a matrix Mk×n where Mi,j is the weight of the j-th individual in the i-th pool. In a binary design, the weight is either 0 or 1, while in a weighted design the entries are in ℝ+. x is a vector indicating the number of mutant alleles of each carrier, so in general x∈{0, 1, 2}n. In the context of carrier screens, each individual has at most one mutant allele so in that case x∈{0, 1}n. This is the case when homozygosity of the mutant allele is deadly or can be otherwise detected without genetic tests, and provides a good approximation when the alleles of interest are rare. For ease of notation, we treat x as a number between 0 and 2n−1 (or 3n−1), taking the binary (ternary) representation of the number as the vector description of x. Similar models were previously used by Erlich et al. (2010) and Shental et al. (2010).
A normalized design is denoted  and is simply the same design after the weights have been normalized such that the sum of weights in a pool is 1/2, since each individual donates two alleles to the pool.
We denote qi the proportion of mutant alleles in the i-th pool after preparation, given, in vector form, by  .
.
We denote α the probability that the sequencing machine identifies a mutant allele as a wild-type allele or vice versa. This is more likely when the mutation is a single nucleotide polymorphism (SNP) and less likely when the mutation is an indel of several bases. A conservative estimate of the probability of a single base read error is 1% (Druley et al., 2009). Therefore, error reads are relevant when screening for SNPs, but not when screening for indels of several bases, as in the case of ΔF508 associated with Cystic Fibrosis (Rowe et al., 2005). The probability pi that a single read in pool i is a copy of a mutant allele is given by:
This probability can be interpreted as the probability that a mutant read is read correctly by the sequencer plus the probability that a wild-type read is read with an error, transforming it to a mutant read.
The expected coverage of the genomic location of interest is denoted r and depends on various factors, such as the expected number of reads of the sequencing technology and the length of the sequenced region.
We assume that the total number of wild-type allele reads and mutant allele reads in the i-th pool, denoted WTi and MUi, respectively, both follow a Poisson distribution with parameters λWTi(x)=r(1−pi(x)) and λMUi(x)=rpi(x), respectively. This implies that the total number of reads is distributed Pois(r) regardless of the content of the pool due to the properties of the Poisson distribution (Johnson et al., 1993). While this assumption is of some debate, [see, e.g. Sarin et al. (2008)], we follow the existing literature in using it [see, e.g. Erlich et al. (2010)].
The output of the HTS is the number of both the wild-type and mutant reads in each pool and is denoted y={WTi, MUi}i=1k.
3.1 Inference under the model
The posterior probability that a carrier-assignment vector x generated a given read output y is given by:
where φ(x) is the prior distribution of x. For example, if the prevalence of the mutant allele in the population is θ and x has m carriers, then φ(x)=θm(1−θ)2n−m, assuming the allele in question is located on an autosome. The probability P(y|x) is given by the product of two probabilities: The probability of observing the given number of wild-type reads and the probability of observing the given number of mutant reads. Since the values of y are known, this probability can be written as a function of x:
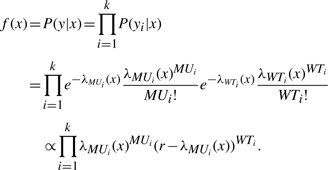 |
The choice of the optimal assignment vector x depends on the criterion we wish to optimize. In the context of carrier screens, Erlich et al. (2009, 2010) count only a perfect reconstruction of the carrier vector as success. In this case the optimal assignment of x is the maximum posterior (MAP) assignment:
Finding the MAP can be a computationally difficult problem. Shental et al. (2010), apply a simple heuristic to the output of GPSR (Gradient Projection for Sparse Reconstruction) to approximate the optimal solution while Erlich et al. (2009) use minimal discrepancy. Erlich et al. (2010), show that belief propagation (BP) is superior to the other methods as a decoding method. This is probably due to the fact that BP does take into account the prior information and the discrete nature of the vector x. Therefore, whenever it is not feasible to identify xMAP by exhaustive iteration, we adopt the Monte Carlo belief propagation scheme of Erlich et al. (2010) as our method for finding xMAP.
Although the perfect reconstruction criterion is suitable in the context of carrier screens, when thinking about sequencing in the context of association studies, a more suitable criterion for optimization is the probability of successfully sequencing an individual at a given location. We define a suitable loss function for the case of x∈{0, 1}n by:
which can be interpreted as (minus) the percentage of correctly classified individuals when the true value is x but our assignment is x*. The loss function for the case of x∈{0, 1, 2}n has to be adjusted to account for two alleles instead of one.
Given the loss function, the optimal assignment x*(y) is defined as the minimizer of the expected loss:
This framework is general and can be used with other loss functions. For example, the optimal assignment is xMAP if the loss function is:
Similarly, one can assign different penalties to type-1 and type-2 errors.
4 NON-OVERLAPPING WEIGHTED DESIGNS
We begin our analysis by analyzing non-overlapping weighted designs (NWDs). In NWDs, a group of n individuals is divided into  groups of d individuals and each group of d individuals is pooled into one pool which is then sequenced. Such a scheme reduces the number of pools required for sequencing by a constant factor of d, compared to the more sophisticated overlapping pools designs such as CRTD and STD which require only
  pools. However, the actual factor of reduction in the number of pools achieved by these designs in practice is between 5 and 6 for n=1000 for any design with reasonable performance and even much less for smaller cohorts. We, therefore, find that even for very large cohorts NWDs with d=5 or d=6 require roughly the same number of pools as do combinatorial designs such as CRTD and STD.
Using such non-overlapping weighted designs has a number of advantages over combinatorial pooling schemes:
They are easy to implement: While pooling with CRTD, STD or a random design requires either expensive robotic equipment or laborious manual processing that is prone to irreversible errors, a trained multi-channel pipette user can implement an NWD in a manner of minutes. For example, pooling d=5 plates of 96 wells into 96 pools can be done by setting the pipette to the first weight, and transferring this amount from each well in the first sample plate to the same well in the pooling plate. The pipette is then set to the second weight and the process is repeated using the second sample plate, then the third and so forth.
They are easy to analyze: Sophisticated pooling designs require belief-propagation or similar algorithms to decode. These algorithms are computationally demanding and heuristic. Moreover, when the number of carriers increases, these algorithms tend to oscillate and cannot be used for meaningful inference. The fact that the pools in an NWD are independent and contain a small number of individuals allows for rapid enumeration over the entire set of carrier configurations, thus overcoming these issues.
They are easy to optimize: While the problem of finding an optimal compressed sensing design remains an open one, the problem of designing the optimal weighting scheme for a pool is easy to approach, as we demonstrate in the following section.
They are more robust: The decoding of overlapping pooling strategies is based on crossing information between pools by means such as message passing, which creates complex dependencies between the different pools in the decoding process. In an NWD, the decoding of each pool is based upon that pool only, and, therefore, a pool that was not sequenced properly due to some problem along the pipeline does not influence the other pools.
4.1 Finding the optimal NWD
For a given set of parameters (n, d, α, r, θ) and a set of weights w={wi}i=1d, we can write down the expected loss 𝔼L(w):
 |
Since yMU is a Poisson variable with λMU in the range  and similarly yWT is a Poisson variable with λWT in the range
  , the infinite sums can easily be approximated to an arbitrary degree of accuracy by defining:
 |
where F−1(1−ϵ;λ) is the (1−ϵ)-th quantile of the Poisson distribution with rate λ. 𝔼Lϵ(w) is simply the true 𝔼L(w) minus the tails of the sums.
Because of the choice of the summation limits, the probability of the set of omitted y values is bounded by 1−(1−ϵ)2. The summand is a probability and so the omitted sum is positive and bounded by 2ϵ+ϵ2. this implies that the true 𝔼L(w) lies in the following interval:
and so ϵ can be chosen so that the approximation is as accurate as required.
We now wish to minimize the expected loss, that is, we wish to solve  .
.
Since the sum of the weights is constant, this problem can be numerically solved by optimizing over only d−1 parameters. Since d is small, this can be done using ‘out of the box’ optimization algorithms or even using an exhaustive grid search.
We denote Psuc the probability of correctly classifying an individual. When the loss function counts how many individuals were correctly classified, we have Psuc=−𝔼L. When suitable, we use this more intuitive notation.
4.2 Controlling for classification errors across individuals
An immediate concern that arises when dealing with the idea of weighted designs is the lack of symmetry between the different individuals participating in the design. Hypothetically, it is possible that, due to the weighting scheme, the probability of identifying that an individual is a carrier varies greatly across individuals. It is, therefore desirable to be able to construct an NWD in a manner which provides equal probability of misclassification across individuals, or at least some control over the minimal probability of such misclassifications.
More formally, denote pi(w) the probability that the i-th individual is classified as non-carrier when she is a carrier. We wish to solve:
when the decoding is done using xMAP. We call these designs ‘fair’ NWDs.
We designed a heuristic to quickly find a nearly optimal set of weights w.r.t. this criterion. The key observation behind this heuristic is that when the i-th individual is a carrier, most cases of misclassifying her as non-carrier are caused when either the (i−1)-th or the (i+1)-th individuals are misclassified as carriers, when the indexing is by increasing order of weights.
It follows that the weights should be designed such that that the probability for confusion of the i-th individual with the i−1-th and the i+1-th individual is constant across individuals. Thus, given w1 and w2, we choose w3 such that the probability of confusing the fact that individual 2 is a carrier with individuals 1 or 3 is equal to the probability of confusing the fact that 1 is a carrier with 2 being a carrier or with 0 carriers. w2 and w3 in turn determine w4 and so forth. All that is left is to minimize over w1 and w2. We omit further details from this text due to lack of space.
5 IMPROVING EXISTING DESIGNS
While the simplicity of NWDs is very appealing, they do not scale as well as other designs as the number of individuals increases. Designs that are based on overlapping pools, such as the CRTD or STD, scale as  and thus provide a much more efficient way of pooling when the sequenced cohorts are in the order of thousands or more. Intuitively, these designs achieve good performance by intersecting information regarding each individual across pools. It is therefore interesting to see if one can improve these designs by adding weighting without changing the underlying conceptual framework of the design.
One appealing idea is to take such combinatorial designs, and instead of applying the same weight to the individuals within each pool, use two weights or more. However, the construction of optimal designs even in much simpler compressed-sensing setups is an open question. The consensus in these cases is to use randomization, since random matrices fulfill the restricted isometry property required for by the compressed sensing theory (Baraniuk et al., 2008). We follow the same line of thought: given a combinatorial design we apply weighting to each pool separately and randomly, while limiting the number of weights to a small number in order to facilitate fast computation and optimization.
Given a combinatorial design, we first select m—the number of weights to be used–and then assign one of m weights to each of the individuals in a pool. Unfortunately, the testing and optimizing of such designs is a computationally intensive task. To alleviate these issues, we study the simple case of m=2, that is, we use two weights w1, w2 in each pool and assign each weight randomly to half of the individuals in each pool. To maintain a simple design, we use the same weights across pools. It is then possible to use simulations to estimate Psuc for the ratio w1/w2 and thus identify the optimal design in this family of designs. We also briefly discuss the case of m=3.
6 RESULTS
We start by analyzing NWDs. As discussed earlier, we use a conservative error rate of α=1% and an average coverage of 1000× (i.e. r=1000). While this coverage is high for whole genome sequencing projects, it is very reasonable when targeting a small number of genes or several known mutation loci as is the case in prenatal screening. We start by limiting the discussion to carrier screens, that is, the probability of observing a mutant homozygous individual is 0. As discussed earlier, this is the case when screening for lethal recessive mutants but also when sequencing mitochondrial DNA, sex chromosomes in males, or monoploid organisms. We relax this assumption in Section 6.1.
We computed the optimal NWDs and their corresponding values of Psuc for d∈{2, 3, 4, 5, 6} using θ=4% to simulate the case of Tay–Sachs carrier screening in the Jewish Ashkenazi population (Risch, 2001). The performance of these designs as a function of θ—the actual carrier prevalence in the population—is given in Figure 1. Our simulations show that for low compression levels (d=2, 3) there is hardly any loss of Psuc even for more common mutations. The baseline for comparison is defined as the Psuc obtained by assigning the wild-type genotype to all the individuals, that is, 1−θ.
Fig. 1.
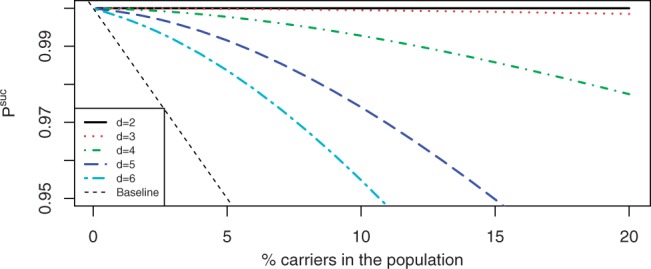
Performance of Tay–Sachs optimal NWDs for various values of d and r=1000.
We then used numerical optimization to find the optimal NWD for various prevalence values. Figure 2 compares the performance of the optimal NWD for each value of θ, the optimal NWD for θ=4% and the ‘fair’ NWD for θ=4% as described in Section 4.2. While the optimal NWD does outperform the other designs when θ≠4%, as expected, the differences between its performance and the performance of the Tay–Sachs optimal design are small. The ‘fair’ design does not perform as well, but this is expected, given that it was not optimized with respect to Psuc.
Fig. 2.
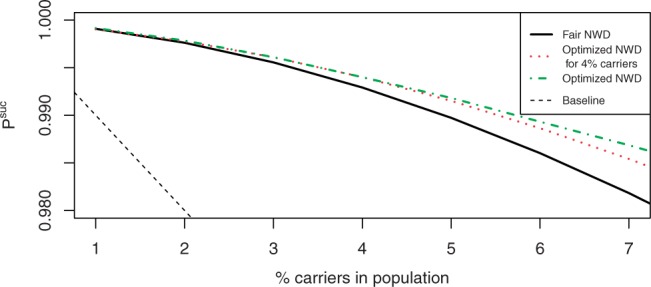
Performance of Tay–Sachs optimal NWD, a design that controls for classification errors and a pointwise optimal NWD. All designs are with d=5 and r=1000.
As means of comparison to the combinatorial designs, we chose to focus on CRTD and STD and a cohort size of n=1000 individuals. For the CRTD, we used windows of {31, 32, 33, 35, 37}, yielding a compression rate of ~6, while for the STD we used P=37 and five windows, yielding a compression rate of ~5.4.
The performance of these designs was estimated by running 100 simulations for each prevalence value and calculating the empirical Psuc. The decoding was done by belief-propagation using 20 iterations with a high damping factor (γ=0.95) to alleviate oscillation issues, and by using xMAP instead of x* since finding the latter is intractable for such cohort sizes. The performance of these designs is compared to Tay–Sachs NWDs with d=5, 6 in Figure 3. The combinatorial designs, which rely on the principles of compressed sensing, display a near perfect reconstruction rate when the prevalence of carriers is small and therefore the signal is indeed sparse. However, as the prevalence increases, the performance of the combinatorial designs quickly deteriorates, and for prevalence higher than 3% the signal is too dense to reconstruct, and the performance of the designs is roughly equivalent to simply assigning the wild-type allele to the entire group. The NWDs do not display this characteristic ‘phase-transition’ but rather show a slow decline in performance, with much better performance than combinatorial designs once for prevalences above 2.5–3%.
Fig. 3.

Comparison of combinatorial designs and Tay–Sachs optimized NWD designs.
To study the performance of hybrid designs, we focused on hybrid designs with only two different weights, which allows us to quantify their performance as a function of one parameter—the ratio of the weights w1/w2. We used a grid of 20 values of w1/w2 and estimated the performance of the hybrid designs for a prevalence of 3% using 100 simulations each time. The optimal weight ratio in both designs was w1/w2=0.2, and using w1/w2=1, that is, resorting to the combinatorial designs, displayed very poor performance, as can be seen in Figure 4.
Fig. 4.
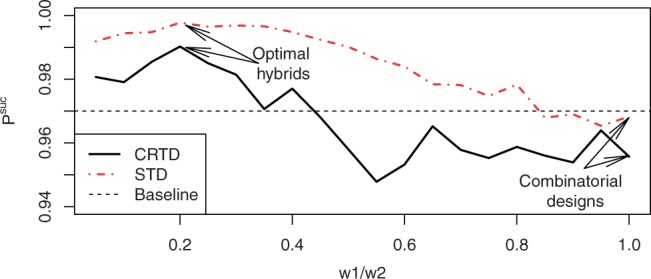
Performance of hybrid designs with two weights as function of the weight ratio. The prevalence is fixed at 3%.
We then studied the performance of hybrid CRTD and STD using the optimal 0.2 ratio, as well as 0.3 and 0.5, and compared their performance to the corresponding combinatorial designs. To do so, we ran 100 simulations for each of the ratios, for each of the designs, and for prevalence ranging from 0.1% to 4% using step size of 0.1%. The results for CRTD and STD are displayed in Figures 5 and 6, respectively, and show a clear improvement in performance when weighting is used.
Fig. 5.
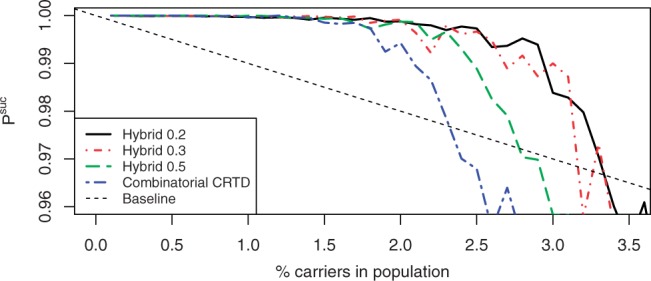
Performance of combinatorial and hybrid designs for CRTD.
Fig. 6.
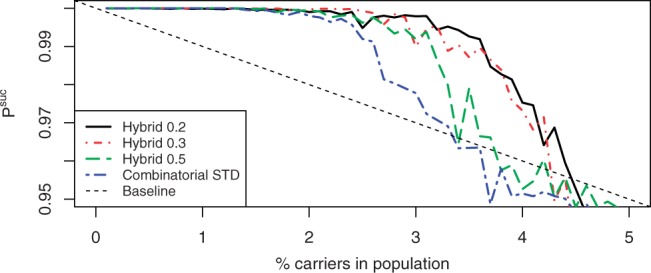
Performance of combinatorial and hybrid designs for STD.
For example, one can look at the minimal prevalence of carriers in the population such that Psuc <0.999. The combinatorial STD crosses this threshold for prevalence of 1.5%, while for the hybrid designs with weight ratios 0.2, 0.3 and 0.5, this happens for prevalence of 1.9, 2.3 and 1.5%, respectively. Similarly, one can look at the minimal prevalence such that the design underperforms the baseline, which happens for prevalence of 2.4% for the combinatorial STD and for prevalence of 3.4, 3.2 and 2.8% for the hybrid STDs with weight ratios 0.2, 0.3 and 0.5, respectively. Results are qualitatively similar for CRTD.
Encouraged by the significant improvement in the performance of the combinatorial designs due to the introduction of two weights, we studied the impact of adding a third weight. We used a grid-search to find the optimal weight ratios for STD with three weights for a population with 3% carriers, which was approximately w1/w2=0.35 and w1/w3=0.05, and estimated the performance of this design in the same manner as before. The results (Fig. 7) show that the additional weight improves the performance of the design even further.
Fig. 7.
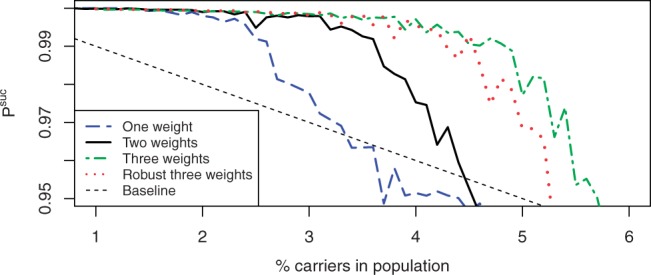
Performance of STD with one, two and three weights, as well as a robust version of the three weights design with larger minimal weight.
It might seem counterintuitive at first that assigning such small weights to some of the individuals improves the overall performance of hybrid designs. The key to understanding this is that the decoding process crosses information between overlapping pools. Individuals with small weights in certain pools will have high weights in other pools, and in these pools there would be less uncertainty regarding the identity of the carrier. While each pool provides less information regarding the individuals with low weights, it provides much more information regarding the individuals with high weights, narrowing down the list of possible carriers by a factor of the number of weights. For example, with one carrier in a pool of 30, combinatorial designs would only allow us to infer that one individual out of the 30 in the pool is a carrier, while a hybrid design with three weights would narrow the list down to 10 possible carriers if the carrier is not assigned a small weight. So pools where an individual has a small weight provide less information regarding this individual while pools where the individual has a larger weight provide more information, and due to the design of overlapping pools this information can be used for better decoding.
The fact that this tradeoff is beneficial might seem less surprising when one thinks about the convexity property of the mutual information. Mutual information is a concept from information theory that captures the reduction in uncertainty regarding the true value of one random variable X when we observe the value of a different variable Y, and is denoted I(X ; Y) (Guiasu, 1977). In our case, X is the identity of the carriers and Y is the observable outcome (i.e. counts of wild-type and mutant reads). It is well known that given the distribution of X (which is known in our case), I(X ; Y) is convex in P(Y|X) (Guiasu, 1977). Since adding weights increases the dispersion of the values of Y, it is reasonable to expect that I(X ; Y) will increase. While this is of course not a formal proof, we find it provides a good intuition to understanding why weighting is beneficial.
Despite these explanations, using small weights might still be problematic, either due to the higher sensitivity of such weights to measurement errors or for other reasons (such as the overdispersed nature of the coverage observed in many experiments). It might, therefore prove valuable to study the performance of suboptimal designs which assign larger weights. To study the effect of changing the weights to a suboptimal set we doubled the ratio for the smallest weight to the largest weight so that w1/w3=0.1, and estimated the performance of this more robust design. The results, shown in Figure 7, show only a slight degradation of performance compared to the optimal design, suggesting that designs can benefit from additional weights even when those weights are substantial.
6.1 Sequencing common variants
In the previous section, we discussed the performance of NWDs, combinatorial designs and hybrid designs under the assumption of no homozygous mutants. This is a reasonable assumption for carrier screens, and a good approximation for very rare variants. While combinatorial and hybrid designs are useful only when the underlying mutations are rare, our simulations suggest that NWDs identify carriers with very few mistakes even when the prevalence of the mutation is high. NWDs can, therefore be used to sequence common variants, for which we expect to see homozygosity of both alleles. Hence, NWDs may be used to reduce the cost of whole-exome and even whole-genome sequencing projects. Such projects usually involve much lower coverage than previously discussed, typically in the range of 30–150 [e.g. see Stransky et al. (2011) or the offer by 23andMe for whole exome sequencing with 80× coverage for $999 (23andMe website, 2012)].
We generalized the equations in Sections 3 and 4 to account for the possibility of observing a homozygous mutant by treating the vector x as a vector in {0, 1, 2}n instead of in {0, 1}n, so the number of possible allocations is no longer 2n but rather 3n, and modified the loss function L accordingly. We further assumed Hardy-Weinberg equilibrium which determines the prior distribution of x as a function of the MAF. We then computed Psuc using the modified formulae.
Figure 8 shows the performance of NWDs with d=2 for r∈{30, 80, 150} as a function of the MAF, where the weights are optimized for MAF of 5%. Our results suggest that, with realistic coverage, NWDs with d=2 can be used to reduce the cost of whole-exome sequencing projects. The additional error rates due to the use of such NWDs are only 5.9, 3.1 and 1.3% (for r=30, 80 and 150, respectively) with the maximal MAF (which are the hardest to call correctly). For lower MAFs, the error rates reduce dramatically, for example for MAF=0.1 the error rates are 1.5, 0.6 and 0.25%, respectively.
Fig. 8.
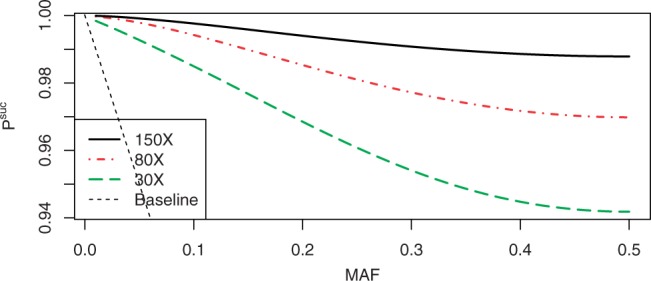
Using NWDs with d=2 with typical whole-exome sequencing coverage values.
To investigate the option of using NWDs for even lower coverage rates, such as those encountered in whole-genome sequencing projects, we calculated Psuc for NWD with d=2 and r∈{10, 20, 30}. Since such low coverage implies that the decoding is more sensitive to genotyping errors, we used the more realistic value of α=0.1%. Figure 9 displays the performance of these designs. Even with the minimal coverage rate of 10×, such NWDs introduce <8% errors for the maximal MAF, and <2.5% for variants with MAF=0.1.
Fig. 9.
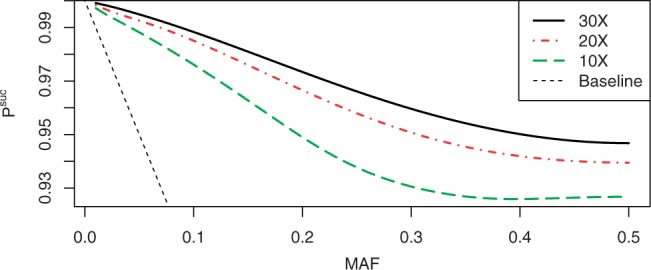
Using NWDs with d=2 with typical whole-genome sequencing coverage values.
6.2 Cost reduction due to pooling
Detailed modeling of the costs of a HTS project is out of the scope of this article. However, we find it instrumental to discuss a simplified analysis. The two major costs of a sequencing project are the capture of the genomic region of interest and the sequencing itself. Pooling designs reduce the number of capture reactions required but increase the sequencing depth required, so their cost-effectiveness depends on the actual costs. The current price of running a single Illumina HiSeq lane, which produces roughly 5×10⁷ paired−end reads of length 100 each (i.e. a total of 1010 bases) is roughly $2200 (YCGA website, 2012). Costs of capturing a part of a human genome vary depending on the technology and the size of the region of interest, but generally range from $300 to $1300, including reagents and labor (private communication with salespeople from Agilent, Beckman Coulter Genomics, Halo Genomics and the Beijing Genomic Institute). We neglect the cost of other elements such as barcoding, as these are typically negligible compared to the costs above.
Since pooling strategies benefit from reducing the number of captures required, we take a conservative approach and evaluate the costs using the lower bound of $300 per capture reaction. Consider now a sequencing experiment where we target a region of size 1Mb, and sequence 1000 individuals with coverage 30×. We can theoretically sequence 333 individuals per lane (even though this is somewhat unrealistic) and, therefore, using a standard non-pooled approach the project would require 1000 captures and 3 lanes, or 1000×300+3×2200=$306 600. A hybrid approach using a STD with 185 pools and 1000× coverage as in the analysis above, would require only 185 captures, but each lane can accommodate only 10 pools, so we would need 18.5 lanes, resulting in an overall cost of 185×300+18.5×2200=$96 200, less than one third of the costs.
The price one pays for this reduction in cost is losing the ability to reliably call common variants (with MAF >4% when using a design with three weights as described earlier), but in many applications this is acceptable, for example when focusing on rare variants.
One possible concern is that the dispersion of depth of coverage across the region of interest is higher than expected by the Poisson model, and, therefore, many loci would have a lower than expected coverage, for which hybrid pooling designs might be less effective. To alleviate this issue, it is possible to use some of the savings in costs to increase the expected coverage depth. For example, if we increase the expected coverage so that each pool has coverage of 2000×, the additional cost is $40 700, and the overall cost is still less than half of the original experiment.
Using an NWD with d=2 and coverage 30× for each pair would only reduce the number of captures, resulting in a total cost of 500×300+3×2200=$156 600. With this depth, our simulations show that the added error would be <6% for common variants, and ~1% for variants with MAF<10%. Again, the reduction in costs can be used to increase the expected coverage, for example to 150×, for which the overall cost would be $183 000, roughly 60% of the cost of the original project. This level of coverage would reduce the error to ~1% for the most common variants, and would definitely solve any coverage issues that might arise from overdispersed coverage.
Finally, it is important to keep in mind that the cost of sequencing is decreasing in a super exponential rate (NHGRI website, 2012), so coverage depth is becoming less and less of an issue. This implies that the reduction in cost when using pooling designs would only grow in the future, and that the cost increasing coverage to solve overdispersion problems is likely to become neglible.
7 CONCLUSION AND FUTURE WORK
The idea of using elaborate pooling designs to reduce the costs of genetic screens and rare variant genotyping is appealing and useful. However, the mathematical framework induced by the nature of the problem is unique both in the group testing literature and the compressed-sensing literature. The sequencing community is, therefore required to derive such methodologies from scratch. Erlich et al. (2009) and Shental et al. (2010) take advantage of the fact that the sequencing results are not binary and describe combinatorial designs that utilize this fact to allow for accurate recovery of rare variant carriers, which are sparse enough in the sample, and, therefore, fulfill the sparsity assumption underlying the basic mathematics of compressed sensing.
Weighted pooling designs take advantage of another feature of the DNA pooling scenario—the ability to pool together different amounts of DNA from different individuals. We described how weighting can be used in two ways. First, we studied non-overlapping weighted designs where the individuals are divided to disjoint groups of d individuals and each group is sequenced individually. By pooling different amount of DNA from each individual, we are able to identify which of the individuals are carriers in each such pool. These designs have another major advantage—they are very easy to implement in the lab. While this consideration is usually out of the scope of compressed sensing or group testing works, we find it important to keep in mind that the applicability and simplicity of a method might determine whether it is actually adopted by the community or not. Second, we described how weighting can be incorporated into the existing overlapping designs, and demonstrated, using simulations, that such hybrid designs are superior to their non-weighted combinatorial counterparts.
Hybrid designs and NWDs display very different performance profiles. Hybrid designs have a nearly perfect reconstruction rate for rare mutations, but as the prevalence of carriers increases they undergo a ‘phase-transition’ which is typical to compressed-sensing approaches and are no longer able to identify carriers [see for example Figueiredo et al. (2007)]. Non-overlapping weighted designs show a continuous decline in performance without such abrupt phase-transitions. Hence, the choice of design type should depend on the application considered. In the case that the priority is to correctly classify the individuals as carriers or non-carriers, as is the case when running prenatal screens for known rare recessive genetic disorders, it is preferable to use hybrid designs with overlapping pools. Since in this case the screens are carried over a large population and done again and again, it is also more reasonable to invest the one time effort of establishing a laboratory pipeline for such tests.
If, however, the priority is to identify variants of a large range of minor allele frequencies with as few mistakes as possible, but with no reason to prefer correct genotyping of very rare variants to correct genotyping of more common ones, non-overlapping weighted designs might be preferable, as they outperform the compressed sensing approaches when the variants in question are not very rare. In fact, our simulations suggest that using d=2 with realistic coverage can cut the cost of exome-capture of whole-exome sequencing projects by nearly half, and still introduce <1.3% errors to the genotype calling.
The possible applications of these approaches are numerous. First, as we discussed earlier, the compressed-sensing approaches can be used to facilitate cheap prenatal screens. In this scenario, hybrid designs can be used to extend the range of mutations for which carriers can be identified from mutations with MAF <2% (as in the STD example) to MAF <4% (with three weights), and probably even more with better designs.
Second, deep-sequencing is used more and more to identify rare variants. Most methods for rare variants association tests involve a step of grouping rare variants which are in the same genetic region for each individual, and using these statistics for the association test [see for example Li and Leal (2008)]. Such methods require the ability to associate each rare variant with its carriers and, therefore, cannot use simple case–control pooling approaches. Hybrid designs can be used if very rare variants are of interest. In the case that a wider range of MAFs are of interest, NWDs can be used. NWDs introduce very little additional error when sequencing rare variants, and reduce the overall cost while still allowing the recovery of common variants with a reasonable level of noise. The savings in costs can be directed towards increasing the sample size, which would compensate for the lost power of association due to the added noise, or to increase the sequencing depth.
Finally, methods which use sequencing data for global or local ancestry and identity-by-decsent (IBD) inference require genotypes of individuals but are robust to a low level of noise, since such inference typically accumulates data across large regions of the genome. Such studies are likely to benefit from the cost reduction of NWDs.
While we demonstrated that adding weighting to combinatorial designs improves their performance, the hybrid designs we presented are only a step toward even better designs. One can think about using more than three weights in hybrid designs, or construct an entirely new design by optimizing over the weights and their assignment simultaneously, rather than taking an existing design and applying weighting to it. However, even for much simpler setups there are no known optimal designs in the compressed-sensing literature. We believe our work is a first step in a road that may eventually utilize more complex designs to a greater benefit.
Another technology which is commonly used to reduce the costs of whole-genome sequencing projects is barcoding. Until recently, barcoding did not pose an alternative to overlapping pooling designs, since the capture step could only be performed before barcodes were applied to the samples, hence barcodes could not be used to reduce the cost of the capture step. However, a method recently developed by Rohland and Reich (2012) allows for target enrichment in a pool of 192 barcoded samples. Since the emergence of such methods is imminent, we find it important to note that pooling designs, and in particular NWDs can be easily applied on top of any such method. For example, one can easily pool 384 samples into 192 pools using NWD with d=2, and then apply 192 barcodes and a single target enrichment procedure. Therefore, the cost reduction obtained by using NWDs would still be considerable.
Many open questions remain in the field of pooled sequencing designs. First, the current modeling of the pooling and sequencing procedure is not entirely realistic. The current framework does not model pipetting measurement errors, and uses the Poisson distribution to model the number of reads, while experimental evidence seem to suggest that the number of reads follows a more dispersed distribution (Sarin et al., 2008). This problem can be resolved by using some of the savings due to pooling to increase the coverage, but could also be partially resolved by using larger weights, which still improves the performance of combinatorial designs as shown earlier. The decoding framework is also far from perfect. The belief propagation algorithm used for decoding is only an approximate heuristic, and tends to oscillate as the number of carriers increases. Other message passing algorithms, such as consensus propagation (Mézard and Montanari, 2009), or special purpose variants thereof, might increase the performance of both hybrid and combinatorial designs.
Second, the usual pooled testing setup assumes that the sequenced individuals are unrelated. In many cases this is not true, for example when sequencing trios or larger pedigrees. An open question is how to utilize these known relationships to facilitate even better pooling. Finally, the current decoding framework does not take advantage of the dependencies between close variants known as linkage disequilibrium. These dependencies can be used to reduce the decoding errors in both designs. For example, NWDs decode rare variants with fewer errors than common variants. Since rare variants are more abundant in the genome, their correct decoding can be used to identify a haplotype, which in turn can be used to correctly decode the more common variants. We plan to pursue these directions in future work.
ACKNOWLEDGEMENTS
The authors thank Paul Medvedev and Amichy Painsky for helpful comments.
Funding: S.R. and D.G. were supported in part by an Open Collaborative Research grant from IBM and by Israeli Science Foundation grant 1227/09. D.G. was also supported in part by a fellowship from the Edmond J. Safra center for Bioinformatics at Tel-Aviv university. Y.E. was supported by an NIH grant (R21HG006167). Y.E. is an Andria and Paul Heafy Family Fellow.
Conflict of Interest: none declared.
REFERENCES
- Baraniuk R., et al. A simple proof of the restricted isometry property for random matrices. Constructive Approximation. 2008;28:253–263. [Google Scholar]
- Bshouty N.H. The 22nd Annual Conference on Learning Theory (COLT 2009) Montreal, Quebec: 2009. Optimal algorithms for the coin weighing problem with a spring scale. [Google Scholar]
- Candès E.J., et al. Stable signal recovery from incomplete and inaccurate measurements. Commun. Pure Appl. Math. 2006;59:1207–1223. [Google Scholar]
- Donoho D.L. Compressed sensing. IEEE T. Inform. Theory. 2006;52:1289–1306. [Google Scholar]
- Druley T.E., et al. Quantification of rare allelic variants from pooled genomic DNA. Nat. Methods. 2009;6:263–265. doi: 10.1038/nmeth.1307. [DOI] [PMC free article] [PubMed] [Google Scholar]
- Du D., Hwang F.K. Combinatorial Group Testing and Its Applications. Singapore, Singapore: World Scientific; 1999. [Google Scholar]
- Du D., Hwang F.K. Pooling Designs and Nonadaptive Group Testing. Singapore, Singapore: World Scientific; 2006. [Google Scholar]
- Erlich Y., et al. DNA Sudoku - harnessing high-throughput sequencing for multiplexing specimen analysis. Genome Res. 2009;19:1243–1253. doi: 10.1101/gr.092957.109. [DOI] [PMC free article] [PubMed] [Google Scholar]
- Erlich Y., et al. Compressed genotyping. IEEE T. Inform. Theory. 2010;56:706–723. doi: 10.1109/TIT.2009.2037043. [DOI] [PMC free article] [PubMed] [Google Scholar]
- Figueiredo M.A.T., et al. Gradient projection for sparse reconstruction: application to compressed sensing and other inverse problems. Selected Topics Sig Process, IEEE J. 2007;1:586–597. [Google Scholar]
- Guiasu S. Information Theory with Applications. New York: McGraw-Hill; 1977. [Google Scholar]
- Guy R.K. Sets of integers whose subsets have distinct sums. Ann. Discrete Math. 1982;12:141–154. [Google Scholar]
- Guy R.K., et al. Coin-weighing problems. Amer. Math. Monthly. 1995;102:164. [Google Scholar]
- Johnson N.L., et al. Univariate Discrete Distributions. 2. Hoboken, New Jersey: John Wiley & sons, Inc.; 1993. [Google Scholar]
- Li B., Leal S. Methods for detecting associations with rare variants for common diseases: application to analysis of sequence data. Am. J. Hum. Genetics. 2008;83:311–321. doi: 10.1016/j.ajhg.2008.06.024. [DOI] [PMC free article] [PubMed] [Google Scholar]
- Manolio T.A., et al. Finding the missing heritability of complex diseases. Nature. 2009;461:747–753. doi: 10.1038/nature08494. [DOI] [PMC free article] [PubMed] [Google Scholar]
- Mézard M., Montanari M. Information, Physics, and Computation, Ser. Oxford, U.K.: Oxford Graduate Texts. Oxford University Press; 2009. [Google Scholar]
- Prabhu S., Pe'er I. Overlapping pools for high-throughput targeted resequencing. Genome Res. 2009;19:1254–1261. doi: 10.1101/gr.088559.108. [DOI] [PMC free article] [PubMed] [Google Scholar]
- Risch N. Molecular epidemiology of Tay–Sachs disease. Adv. Genet. 2001;44:233–252. doi: 10.1016/s0065-2660(01)44083-1. [DOI] [PubMed] [Google Scholar]
- Rohland N., Riech D. Cost-effective, high-throughput DNA sequencing libraries for multiplexed target capture. Genome Res. 2012 doi: 10.1101/gr.128124.111. [Epub ahead of print, doi:10.1101/gr.128124.111, January 20, 2012] [DOI] [PMC free article] [PubMed] [Google Scholar]
- Rowe S.M., et al. Cystic fibrosis. NEJM. 2005;352:1992–2001. doi: 10.1056/NEJMra043184. [DOI] [PubMed] [Google Scholar]
- Sarin S., et al. Caenorhabditis elegans mutant allele identification by whole-genome sequencing. Nat. Methods. 2008;5:865–867. doi: 10.1038/nmeth.1249. [DOI] [PMC free article] [PubMed] [Google Scholar]
- Shental N., et al. Identification of rare alleles and their carriers using compressed e(que)nsing. NAR. 2010;38:1–22. doi: 10.1093/nar/gkq675. [DOI] [PMC free article] [PubMed] [Google Scholar]
- Stransky N., et al. The mutational landscape of head and neck squamous cell carcinoma. Science. 2011;333:1157–1160. doi: 10.1126/science.1208130. [DOI] [PMC free article] [PubMed] [Google Scholar]
- Thierry-Mieg N. A new pooling strategy for high-throughput screening: the Shifted Transversal Design. BMC Bioinformatics. 2006;7:28. doi: 10.1186/1471-2105-7-28. [DOI] [PMC free article] [PubMed] [Google Scholar]
- Xin X., et al. Shifted transversal design smart-pooling for high coverage interactome mapping. Genome Res. 2009;19:1262–1269. doi: 10.1101/gr.090019.108. [DOI] [PMC free article] [PubMed] [Google Scholar]
- Zlotogora J., et al. A targeted population carrier screening program for severe and frequent genetic diseases in Israel. Eur. J. Hum. Gen. 2009;17:591–597. doi: 10.1038/ejhg.2008.241. [DOI] [PMC free article] [PubMed] [Google Scholar]
- 23andMe website, available at: https://www.23andme.com/exome/; (last accessed date January 12, 2012)
- National Human Genome Research Institute (NHGIR) website, available at: http://www.genome.gov/images/content/cost_per_megabase.jpg; (last accessed date January 12, 2012)
- Yale Center for Genome Analysis (YCGA) website, available at: http://medicine.yale.edu/keck/ycga/sequencing/Illumina/prices.aspx; (last accessed date January 12, 2012)


