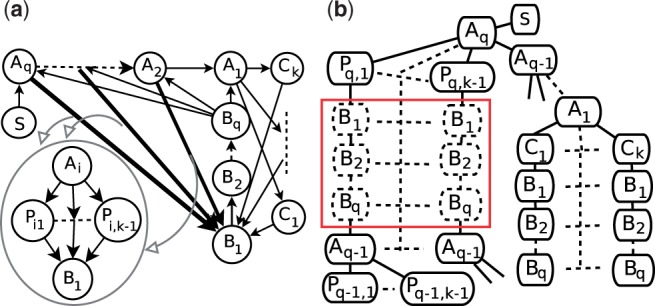
Fig. 3.

An example with O(n2k) dummy nodes. (a) The graph. Each bold arrow represents k−1 paths. (b) The pseudo tree. The red box contains total (k−1)q dummy nodes in the paths from S to Aq−1

An example with O(n2k) dummy nodes. (a) The graph. Each bold arrow represents k−1 paths. (b) The pseudo tree. The red box contains total (k−1)q dummy nodes in the paths from S to Aq−1