

Abstract
Motivation: Assemblies of next-generation sequencing (NGS) data, although accurate, still contain a substantial number of errors that need to be corrected after the assembly process. We develop SEQuel, a tool that corrects errors (i.e. insertions, deletions and substitution errors) in the assembled contigs. Fundamental to the algorithm behind SEQuel is the positional de Bruijn graph, a graph structure that models k-mers within reads while incorporating the approximate positions of reads into the model.
Results: SEQuel reduced the number of small insertions and deletions in the assemblies of standard multi-cell Escherichia coli data by almost half, and corrected between 30% and 94% of the substitution errors. Further, we show SEQuel is imperative to improving single-cell assembly, which is inherently more challenging due to higher error rates and non-uniform coverage; over half of the small indels, and substitution errors in the single-cell assemblies were corrected. We apply SEQuel to the recently assembled Deltaproteobacterium SAR324 genome, which is the first bacterial genome with a comprehensive single-cell genome assembly, and make over 800 changes (insertions, deletions and substitutions) to refine this assembly.
Availability: SEQuel can be used as a post-processing step in combination with any NGS assembler and is freely available at http://bix.ucsd.edu/SEQuel/.
Contact: ppevzner@cs.ucsd.edu
1 INTRODUCTION
The advent of next-generation sequencing (NGS) technologies, along with the development of new assembly algorithms has enabled the production of genome assemblies for a multitude of organisms at ever-decreasing costs (Huang et al., 2009; Li et al., 2010; Li et al., 2010). Robust assembly methods are imperative to the success of large de novo sequencing initiatives, such as the Genome 10K project that aims to sequence the genomes of 10 000 vertebrate species (Genome 10K Community of Scientists, 2009) and the iK5 project where the objective is to sequence the genomes of 5 000 arthropods (Robinson et al., 2011). NGS technologies produce short sequence reads [approximately 100–150 base pairs (bp) for Illumina technology] at increasingly high throughput, permitting assembly methods suited to these technologies to exploit the redundancy in the data in order to produce high-quality contigs (Bankevich et al., 2008; Wheeler et al., 2008). Although these platforms have much higher throughput than Sanger sequencing platforms, assessment of short-read assemblies have shown them to be less accurate than the finished genomes assembled using the previous technologies (Alkan, et al., 2011). Earlier assembly algorithms developed for Sanger sequencing follow an ‘overlap - layout - consensus’ paradigm, where consensus refers to fixing errors in the contigs (Ewing and Green, 1998; Ewing et al., 1998). Since this paradigm faces difficulties in short-read assembly, most NGS assemblers employ a de Bruijn graph approach that effectively deals with large amounts of data. However, most NGS assemblers neglect the consensus step, i.e. there exists no post-processing of the contigs in Velvet (Zerbino et al., 2008) and many other popular assemblers. Relying on high and uniform coverage, NGS assembly algorithms push the burden of producing high-quality assemblies onto the construction of the de Bruijn graph. We argue that NGS assemblers can benefit from the use of a consensus step, particularly in the case of single-cell data that suffers from high error rates and non-uniform coverage (Chitsaz et al., 2011).
In the spirit of the consensus step, we propose an additional step to the NGS assembly process: refinement. We develop SEQuel, a tool that refines an initial assembly of short-read data by using approximate positions of reads in contigs. SEQuel takes as input an assembled contig, the paired-end reads that align to that contig and the approximate positions where they aligned, and returns a refined contig. We refer to the process implemented by SEQuel as positional reassembly.
In Eulerian assembly (Idury and Waterman, 1995; Pevzner et al., 2001), a de Bruijn graph is constructed with a vertex v for every (k − 1)-mer present in a set of reads, and an edge (v, v′) for every observed k-mer in the reads with (k − 1)-mer prefix v and (k − 1)-mer suffix v′. A contig corresponds to a non-branching path through this graph. See Compeau et al. (2011) for a more thorough explanation of de Bruijn graphs and their use in assembly. Euler-SR (Pevzner et al., 2008), Velvet (Zerbino et al., 2008), SOAPdenovo (Li et al., 2010), ABySS (Simpson et al., 2009) and ALLPATHS (Butler et al., 2008) all use this paradigm for assembly. Most existing NGS assemblers follow the same general outline: break the (possibly error corrected) reads into k-mers, construct the de Bruijn graph on the set of resulting k-mers, simplify the de Bruijn graph, resolve repeats by using mate–pair information and construct contigs. Although the implementation of these steps varies widely between different assemblers, existing NGS assemblers return contigs recovered from the de Bruijn graph with little refinement.
If every position in the genome was uniformly covered by error-free reads, and the genome had few repeats, this would result in a simple de Bruijn graph. However, sequencing errors and repeats lead to highly complex graphs and force assemblers to rely on graph simplification. It is during this simplification process that errors in the assembly are introduced. Substitution errors and indels in the reads create undirected cycles called bulges and short tandem repeats lead to directed cycles called whirls (Pevzner et al., 2004). There exist numerous methods for removing bulges and whirls but unfortunately, these methods potentially introduce errors in the contigs. Figure 1 illustrates a scenario where a bulge in the de Bruijn graph is caused due to a sequencing error.
Fig. 1.
An example of a bulge on eight vertices in a de Bruijn graph (k=4) resulting from a sequencing error. During the process of bulge removal, the correct path (top: CCT-CTA-TAG-AGG-GGA) may be discarded, thus creating a substitution error in the final contig. This may occur if, for example, coverage is taken as a consideration, since the bottom path (CCT-CTT-TTG-TGG-GGA), erroneous in this case, may have higher coverage due to k-mers originating from other parts of the genome
Error correction of the reads prior to assembly can greatly simplify the assembly process by implicitly eliminating bulges from the de Bruijn graph (Kelley et al., 2010; Medvedev et al., 2011; Pevzner et al., 2008; Pevzner et al., 2001). It is now established as a common pre-processing step before assembly, and used by several NGS assemblers, including Euler-SR (Pevzner et al., 2008), ABySS (Simpson et al., 2009) and ALLPATHS (Butler et al., 2008). Although error correction eliminates the majority of errors in reads, in ~1% of the cases it introduces, rather than corrects, errors (Pevzner et al., 2008). This leads to the following trade-off in fragment assembly: either error correction of reads is performed, which may lead to errors in the contigs, or error correction is not performed and the complex de Bruijn graph has to undergo aggressive simplification that may lead to errors in the contigs. It is clear, however, that in both cases subtle and complex errors will arise.
The accuracy of different assemblers varies widely. For example, our tests of Velvet produced contigs with 1–2 errors per 100 kb (for k-mer size 55), while SOAPdenovo produced contigs with 20–30 errors per 100 kb. Even the accuracy of Velvet deteriorates greatly when used in default mode with k-mer size 31. However, SOAPdenovo has some advantages over Velvet (e.g. the ability to handle larger genomes). Therefore, it is beneficial to design a refinement program that can be used in combination with any assembler. Decoupling the contig refinement problem from the assembly process removes the burden of re-implementing a positional reassembly process for each assembler.
We show that NGS assemblies suffer from indels and substitution errors that are somewhat masked by common metrics for assessing assembly quality. Many of these errors can be corrected using SEQuel. We give an analysis of the types of complex errors that occur in NGS assembly, and that can be fixed by SEQuel, offering some insight into why positional reassembly is a necessity for obtaining accurate assemblies.
We give a computational problem formulation for correcting errors in contigs, and present an algorithm for reassembly based on a graph structure referred to as the positional de Bruijn graph. We demonstrate the ability of SEQuel to improve the accuracy of assemblies generated from three assemblers: Euler-SR (Pevzner et al., 2008), Velvet (Zerbino et al., 2008) and Velvet-SC (Chitsaz et al., 2011). Euler-SR performs error correction on the sequence reads prior to assembly (Pevzner et al., 2008), whereas Velvet does not perform error correction (Zerbino et al., 2008). Velvet-SC is a specialized assembler tailored to handle the dramatic fluctuations in coverage that are characteristic to single-cell data (Chitsaz et al., 2011). Single-cell amplified DNA has been shown to suffer from amplification bias and low template quality (Chitsaz et al., 2011; Raghunathan et al., 2005; Rodrigue et al., 2009), resulting in sequence data with highly non-uniform coverage by error-prone reads (Raghunathan et al., 2005). Thus, assembly of such data is inherently more challenging and error-prone. Our experiments demonstrate that SEQuel is able to substantially reduce the number of errors in single-cell, and standard (multi-cell) assembly. Although we demonstrate the use of SEQuel with Euler-SR, Velvet and Velvet-SC, its use is not limited to these assemblers.
2 THE CONTIG REFINEMENT PROBLEM
We formalize the contig refinement problem and present an algorithm for positional reassembly that relies on the positional de Bruijn graph. A similar graph was previously proposed by Hannenhalli et al. (1996) for Sequencing By Hybridization. Contrary to the de Bruijn graph where edges correspond to k-mers, the edges of the positional de Bruijn graph correspond to k-mers and their inferred positions on the contigs.
Fragment assembly in the de Bruijn graph framework is often abstracted as a problem of finding a shortest string that explains the set of all k-mers from the reads, i.e. the Shortest Common Superstring Problem. We formulate the contig refinement problem in a similar manner; that is, as finding a string that explains all occuring positional k-mers. While both abstractions are limited in that they do not adequately address the assembly of repeat regions, they prove to be conceptually useful. The input to the contig refinement problem is the set of k-mers used to assemble a contig, and for each k-mer a position (or positions) where it is presumably contained in the contig, i.e. a multiset of pairs (sk, p), where sk is a k-mer and p is the approximate position. We refer to these k-mer and position pairs (sk, p) as positional k-mers. Given a parameter Δ, we call a positional k-mer (sk, p) valid with respect to a string S if sk appears in S at a position that is within Δ of p.
The contig refinement problem: given a multiset of positional \hbox{k-mers} and a parameter Δ, find a shortest string S that maximizes the total number of valid positional k-mers.
Due to indels in the contigs (relative to the genome), we expect the positions of k-mers in the assembled contig to differ from their positions in the correct contig. Therefore, since our goal is to assemble the correct contig, we assume the positions are an approximation to the position in the correct contig. Next, we demonstrate how positional information may be incorporated into the de Bruijn graph and used to refine contigs by positional reassembly.
3 ALGORITHM AND METHODS
Fundamental to the algorithm behind SEQuel is the positional de Bruijn graph. The input to SEQuel is a multiset of positional k-mers, and a set of contigs; the output is a set of refined contigs. While the description of the method below is for a single contig, in practice it is applied to all contigs of an assembly.
3.1 Recruitment of reads to contigs
We refer to a read-pair as permissively aligned to a contig if either one or both of the reads in the read-pair uniquely align to a single contig in the assembly. If only one read aligns, the approximate position of the unaligned read is deduced using the expected insert size. After assembly, we extract the set of reads that permissively align to the contig and their approximate positions, which is then used in the construction of the positional de Bruijn graph. This is performed using BWA (version 0.5.9) in paired-end mode with default parameters (Li et al., 2009), allowing detection of alignments with small indels as well as read-pairs where only one read is aligned. Although some assemblers (e.g. Velvet) output the assignment of reads to contigs, we obtain better refinement results using BWA. We note that using only the set of permissively aligned reads will lead to reduced coverage in certain regions, however, we see only a modest decline in average coverage and very few regions where coverage was significantly reduced (for bacterial genomes). Thus, the accuracy of SEQuel is improved at the expense of correcting fewer errors in these regions.
3.2 Construction of the positional de Bruijn graph
From the set of reads that permissively aligned to the contig, we construct the set of positional k-mers. If a read r=[r1… rn] of length n is aligned to a contig at position i, we extract n−k+1 positional k-mers from r: ([r1… rk], i), ([r2… rk+1], i+1),…, ([rn−k+1… rn], i+n−k). We emphasize that different reads may give rise to the same k-mer with different inferred positions. Consequently, we cluster by position all positional k-mers that have the same k-mer sequence, and use the cluster centers when constructing the positional de Bruijn graph. This is a one-dimensional clustering problem, where single-linkage clustering performs well.
We refer to the multiplicity of a positional k-mer (sk, p) as the number of occurrences where sk clustered at position p. For example, if the k-mer ACTA aligned to positions (42, 43, 43, 44), and the corresponding positional k-mers all cluster to (ACTA,43), then the multiplicity of this positional k-mer equals 4. SEQuel removes clusters of low multiplicity since they are likely to represent erroneous k-mers. Lastly, the positional de Bruijn graph is constructed from the positional k-mers, as described below.
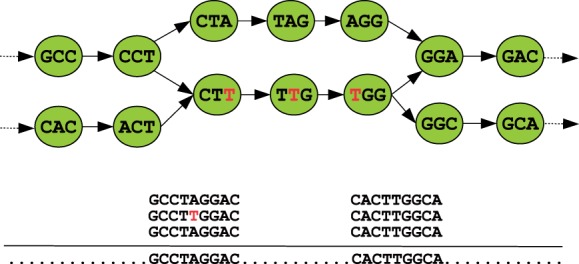
The positional de Bruijn graph Gk,Δ is defined for a multiset of positional k-mers and parameter Δ, and is constructed in a similar manner to the traditional de Bruijn graph using an A-Bruijn graph framework from (Pevzner et al., 2004). Given a k-mer sk, let prefix(sk) be the first k−1 nucleotides of sk, and suffix(sk) be the last k−1 nucleotides of sk. Each positional k−mer (sk, p) in the input multiset corresponds to a directed edge in the graph between two positional (k − 1)-mers, (prefix(sk), p) and (suffix(sk), p+1). After all edges are formed, the graph undergoes a gluing operation. A pair of positional (k−1)-mers, (sk−1, p) and (sk−1′, p′), are glued together into a single vertex if sk−1=sk−1′ and p∈[p′ − Δ, p′+Δ]. Hence, two positional (k − 1)-mers are glued together if their sequences are the same and their positions are within Δ from each other. Finally, each edge is weighted by the multiplicity of the corresponding positional k-mer. In Figure 2, we show an example of a positional de Bruijn graph and a de Bruijn graph constructed from the same dataset.
Fig. 2.

An example illustrating the positional de Bruijn graph (k=4, Δ=1) and de Bruijn graph on a set of aligned reads, with their corresponding sets of k-mers and positional k-mers. There exists a single sequencing error in the reads (shown in red). In the de Bruijn graph, the (k − 1)-mer GCC appears as a single vertex, whereas, the positional de Bruijn graph separates the occurrence of GCC into two vertices. This additional information incorporated into the graph further constraints the gluing process and reduces complexity. Further, the positional k-mers (GCCT, 111) and (GCCT,975) have multiplicity 1 and 4, respectively, but the k-mer GCCT has multiplicity 5. This increases the weight of the incorrect path, and thus the likelihood of an error in the contig produced by the de Bruijn graph. Lastly, we note that in this example no vertex gluing operations occur but in more complex instances, vertex gluing will occur when equal k-mers align at adjacent positions
3.3 Whirl removal in the positional de Bruijn graph
Due to the fact that the positional de Bruijn graph is built on a substantially smaller dataset (i.e. only reads that permissively align to a certain contig) and incorporates the approximate position of each k-mer in the contig, it is significantly less complex than the standard de Bruijn graph for the same contig and far less complex than the de Bruijn graph of an entire assembly. The relative simplicity of the graph is important since it decreases the ambiguities associated with bulge and whirl removal. While whirls are a substantial problem in the de Bruijn graph, the occurrence of whirls in the positional de Bruijn graph is extremely rare; the number of whirls encountered by SEQuel while refining the assemblies of Escherichia coli with Euler-SR, Velvet and Velvet-SC was less than five for each assembly. Nonetheless, the occurrence of whirls is possible. We follow the whirl processing algorithm from Pevzner et al. (2004), since the logic of whirl processing in the positional de Bruijn graph is similar to that in the de Bruijn graph. Bulges are implicitly removed in the next step of the SEQuel algorithm.
3.4 Refined contig construction
The final step of SEQuel is to refine the original contig using the positional de Bruijn graph. We note that since only permissively aligned reads were used to construct the positional de Bruijn graph (rather than the complete set of reads) the graph may be disconnected, leading to the construction of several contiguous sequences. These smaller contiguous sequences may not cover the original contig entirely. However, this does not pose a problem because we are using these sequences to refine the original contig. We find the heaviest path in each of the connected components and construct the contiguous sequences corresponding to these paths. As previously mentioned, the weight of each edge is equal to the multiplicity of the corresponding positional k-mer and therefore, the heaviest path ‘explains’ the largest number of positional k-mers. We refer to the sequences constructed from the positional de Bruijn graph as partial contigs and denote the set of partial contigs as {c1, c2,…, cn}. The average weight of a partial contig is defined as the mean edge weight of the corresponding path. The partial contigs will be used to refine the original contig, denoted as  . Lastly, we denote the refined contig that is ultimately output as r.
In order to describe how is refined using {c1, c2,…, cn} we need some additional notation. We denote u○v as the concatenation of strings u and v. Given a local alignment of strings u=[u1… un] and v=[v1… vm], where (i, i′) and (j, j′) are the respective start and end positions of the alignment on u and v, we denote u⊕v as u[1… (i−1)]○v[j… j′]○u[(i′+1)… n]. The refinement process starts by setting r equal to . Next, for each partial contig ci∈{c1, c2,…, cn}, we let r be equal to r⊕ci.
The order in that partial contigs are used to refine r is important because the alignments of several partial contigs to r may overlap. In positions where such an overlap occurs, any changes from previously used partial contigs will be overwritten by the last. When coverage is uniform we process the partial contigs in order of increasing length, however, when it is highly non-uniform we process them in order of increasing average weight. In both cases, ties are broken arbitrarily and alignments below a certain length are not considered. Thus, SEQuel has two user-defined modes corresponding to the described scenarios: standard and single-cell mode.
3.5 Software implementation
SEQuel is implemented in Java 6.0, and can optionally be run as a multi-threaded application. All tests were performed on a PC with 32 cores (64-bit, 2.27 GHz) and 512 GB of RAM running Linux. Although benchmarking was performed on this computer, SEQuel can be run on a standard desktop; see Section 4.5.
4 RESULTS
4.1 Datasets
In order to evaluate the performance of SEQuel, we use three different datasets described in Chitsaz et al. (2011). All datasets consist of paired-end 100 bp reads from E.coli, generated by Illumina, Inc. on the Genome Analyzer (GA) IIx platform. The first dataset consists of approximately 27 million paired-end reads, and was obtained from the NCBI Short Read Archive (accession ERA000206, EMBL-EBI Sequence Read Archive). As a measure of quality assurance, we aligned the reads to the E.coli genome using BWA version 0.5.9 (Li et al., 2009) with default parameters. We call a read mapped if BWA outputs an alignment for it and unmapped otherwise. Analysis of the alignments revealed that 98% of the reads mapped to the reference genome, representing an average depth of approximately 600×; BLAST analysis against known contaminants revealed that the unmapped reads are attributed to minor contamination of the sample (Chitsaz et al., 2011).
The second dataset is a single-cell dataset consisting of approximately 29 million paired-end reads. Again, we aligned the reads to the E.coli reference genome and observed that 92 of the reads mapped to the reference genome, representing an average coverage of approximately 600×; unmapped reads have been attributed to contamination of the data (Chitsaz et al., 2011; Rodrigue et al., 2009). The coverage in this dataset is non-uniformly distributed across the genome and fluctuates greatly.
Lastly, we used SEQuel to improve the genome assembly of an uncultured Deltaproteobacterium SAR324. This assembly represents a first draft of the genome of this marine bacterium (Chitsaz et al., 2011). Sequence reads and assembly are both available for download at http://bix.ucsd.edu/singlecell/ and a detailed description of the assembly is given in (Chitsaz et al., 2011).
4.2 Performance on standard E.coli Data
We generated the assemblies with Euler-SR v2.0 and Velvet v1.1 in paired-end mode with suggested parameters (i.e. k=55 for Euler-SR and k=31 for Velvet). We generated an additional assembly with Velvet using k=55.1 All assemblers accurately assembled the majority of the E.coli genome, however, there was a range in terms of the accuracy of the contigs. We limited our attention to contigs of length ≥ 250 bp and ran SEQuel with default parameters of k=50 and Δ=15. Contigs were aligned to the E.coli reference genome (NCBI Accession NC_000913.2) using BLAT (Kent, 2002) and both mismatches and indels were counted and compared across contigs before and after the use of SEQuel.
Both the Euler-SR and Velvet assemblies showed a decrease in the number of substitution errors and indels relative to the reference genome after the use of SEQuel. The Euler-SR assembly with SEQuel showed a significant decrease both in the number of positions mismatching the reference genome and in the number of indels. The number of indels of size ≤!50 bp was reduced from 145 to 79, and the number of substitution errors was reduced from 155 to 104 with the use of SEQuel. Figure 3 and Table 1 illustrate these changes to the assembly.
Fig. 3.

Illustration of the change in the number of short (≤50 bp) indels (a) and substitution errors (b) relative to the reference genome before and after the use of SEQuel. Standard reads were assembled using Euler-SR and Velvet. The assembly without SEQuel and with SEQuel is shown in blue and red, respectively
Table 1.
Refinement statistics of assemblies from the standard E.coli dataset
| Refinement statistics | Euler-SR | Velvet (k=31) | Velvet (k=55) |
|---|---|---|---|
| Matches added (lost) | 754 (39) | 17 010 (25) | 45 (2) |
| Substitution errors removed (created) | 69 (18) | 8490 (5) | 44 (2) |
Added matches may originate from two sources: correcting substitution errors or correcting contig deletions. Lost matches may originate from the two sources: creating substitution errors or correcting contig insertions.
Similar results were obtained when applying SEQuel to the Velvet (k=31) assembly (Fig. 3). The most significant change to this assembly was the sharp decrease in the number of substitution errors relative to the reference genome. Using SEQuel, the number of substitution errors went from 8937 to 452, correcting 94% of the total number of substitution errors in the assembly. The number of short indels in this assembly went from 979 to 342. The Velvet assembly with k=55 showed a substantially smaller number of indels and substitution errors (e.g. 50 substitution errors in the complete assembly), leaving less room for improvement. Nevertheless, using SEQuel, the number of short indels in the Velvet assembly with k=55 went from 3 to 2 and the number of substitution errors went from 50 to 8.2
4.3 Performance on single-cell E.coli data
Assembly of single-cell data is inherently more challenging due to the highly non-uniform coverage. Consequently, the contigs obtained from assembly of single-cell data using standard assembly tools are more error prone. In 2011, Chitsaz et al. (2011) developed Velvet-SC, a specialized assembler tailored to handle the dramatic fluctuations in coverage that are characteristic to single-cell data. In our single-cell experiments we used Velvet-SC and Euler-SR. We performed the assemblies in paired-end mode with k=55. SEQuel was used in single−cell mode with k=50 and Δ=15. Contigs were aligned to the E.coli reference genome (NCBI Accession NC_000913.2) using BLAT (Kent, 2002) and both mismatches and indels were counted and compared across contigs before and after the use of SEQuel. Again, we restrict interest to contigs with length ≥250 bp.
As expected, the quality of the Euler-SR assembly is substantially lower than the quality of the Velvet-SC assembly since the former is not equipped to deal with single-cell data. However, both the Euler-SR and Velvet-SC assemblies have a dramatic decrease in the number of substitution errors and the number of indels with the application of SEQuel. In the Euler-SR assembly, the number of indels of size ≤50 bp went from 908 to 379, and the number of substitution errors went from 221 to 109 with the use of SEQuel. Figure 4 illustrates these changes to the assembly. Table 2 gives the total number of matches added and lost, and the total number of substitution errors removed and created by SEQuel. Similar results to Euler-SR were obtained with Velvet-SC. The most significant change in the Velvet-SC assembly was the decrease in the number of indels in the assembly: the number of indels went from 47 to 18, and the number of substitution errors went from 152 bp to 73 bp.
Fig. 4.

Illustration of the change in the total number of short (≤50 bp) indels (a) and substitution errors (b) in assemblies before and after the use of SEQuel. Paired-end reads from a single-cell sample were assembled using Euler-SR and Velvet-SC. The assembly without SEQuel and with SEQuel is shown in blue and red, respectively
Table 2.
Refinement statistics of assemblies from single-cell E.coli reads
| Refinement statistics | Euler-SR | Velvet-SC |
|---|---|---|
| Matches added (lost) | 3100 (200) | 93 (18) |
| Substitution errors removed (created) | 126 (14) | 80 (1) |
Added matches may originate from two sources: correcting substitution errors or correcting contig deletions. Lost matches may originate from the two sources: creating substitution errors or correcting contig insertions.
4.4 Refinement of deltaproteobacterium SAR324 single-cell assembly
We ran SEQuel in single-cell mode with k=50 and Δ=15. SEQuel made changes to 335 of the 602 contigs. Approximately 800 bp were changed overall: 191 substitutions, 584 insertions and 42 deletions. We can only report changes made to the assembly since there exists no reference genome for the bacteria. However, based on the results obtained with SEQuel on a single-cell E.coli assembly, we extrapolate that the majority of these changes represent a (positive) refinement to the assembly.
4.5 Practical considerations: memory and time
We evaluated the memory and time requirements of SEQuel. Since SEQuel is a multi-threaded application, its wall-time depends on the computing resources available to the user. For evaluation purposes we used four threads, a setting that is suitable for most current desktops. The memory requirements depend on a number of factors, including contig length, coverage depth and the level of parallelization. For the E.coli and Deltaproteobacterium SAR324 assemblies, SEQuel required a maximum of 6 GB and 1.5 h to complete (see Table 3).
Table 3.
Running time and memory usage of SEQuel on bacterial genomes
| Genome | Genome size | Time | Memory |
|---|---|---|---|
| Escherichia coli | 4.6 Mb | 55 min | 6 GB |
| SAR324 | 4.9–6.4 Mb | 87 min | 6 GB |
SAR324 has not been finished, thus the exact size of the genome remains unknown.
From a practical perspective, the time and memory requirements of SEQuel do not significantly increase upon those of most NGS assemblers, making it an easy and practical post-processing step. Further, due to the fact that it is performed contig-wise rather than genome-wise, our method should easily scale to larger genomes (i.e. mammalian genomes).
5 DISCUSSION
5.1 Comparison between SEQuel and variation discovery tools
We compared SEQuel with a simpler method of error correction provided by extensions of variation discovery tools. We aligned the reads to the contigs using BWA, and then applied GATK base quality score recalibration, variation discovery (i.e. SNP and indel detection) and variant quality score recalibration (DePristo et al., 2011; McKenna et al., 2010). We then incorporated these variants into the original contigs. We performed this process on both the single-cell and standard multi-cell E.coli assemblies considered in this article. Although this method is conceptually simpler and does not require the development of another tool, the performance was poor in comparison to that of SEQuel. This method corrected approximately one-third of the errors corrected by SEQuel,3 and created 40–50% more errors than SEQuel.
5.2 Assessment of errors corrected by SEQuel
We ran several experiments to better characterize the errors that SEQuel corrects. The assemblies produced by running Velvet (k=31 and k=55) on simulated, perfect reads generated from the reference E.coli genome (200 × coverage) had only a negligible number of errors (less than 10 for k=31 and less than 5 for k=55). Thus, almost all errors in the assembly of the E.coli genome originate from sequencing errors. These sequencing errors give rise to erroneous k-mers that correspond to spurious edges in the de Bruijn graph. Such spurious edges may cause whirls and bulges, which cannot always be reconciled correctly by the assembler.
In this section, we show two examples of assembly errors that are caused by erroneous k-mers, and are corrected by SEQuel. Before going into these examples in detail, we give a general description of how erroneous k-mers can lead to complexity in the de Bruijn graph. Consider a read r sampled from a position i of the genome. Assuming i does not lie within a repeated region, k-mers from r should contribute only to contigs from the region proximal to i. In practice, k-mers from erroneous reads originating in one position may contribute to contigs from completely unrelated regions of the genome. For example, an erroneous ‘read’ AATACCC sampled from the genomic region AATGCCC (single substitution, from G to A) will contribute a k-mer (k=4, ATAC) to the contig …GGATACTT…., rather than the correct contig …AATGCCC. This reallocation of k-mers may occur either within different regions of the same contig (second example below), or across different contigs (first example below). Both the following examples are from the Velvet (k=31) assembly of standard E.coli reads.
First, we focus our attention to a single contig (contig 170157) that illustrates how erroneous k-mers from reads that permissively align to a single contig can be responsible for complexities that the assembler cannot rectify. This contig has two insertions in alignment to the E.coli genome, both of which were corrected by SEQuel. We constructed the de Bruijn graph from only the set of reads that permissively aligned to this contig. As shown in Figure 5, this graph contains bulges and whirls in the exact locations corresponding to the gaps in alignment. In contrast, the positional de Bruijn graph on the same set of reads is significantly simpler (contains a single long path); the positional information constraints graph construction and eliminates many of the spurious edges. SEQuel corrected both insertions in contig 170157.
Fig. 5.

The first illustration of the connection between assembly errors, and whirls and bulges in the de Bruijn graph. The alignment of a 1975 bp contig from the assembly with Velvet and k=31 (contig number 170157), showing two insertions in the alignment, having respective lengths 1 bp and 15 bp. The de Bruijn graph constructed from the set of permissively aligned reads to this contig contains bulges and whirls at regions corresponding to the insertions in the contigs
Our second example illustrates how erroneous k-mers are recruited from distant regions of the de Bruijn graph and form spurious edges that eventually lead to assembly errors. We constructed the de Bruijn graph from the set of reads used to assemble contig 10362 and two other contigs from the same assembly. The de Bruijn graph built from only the reads that permissively aligned to contig 10362 is simple enough that it led to an error-free contig, but the de Bruijn graph built from the larger set of reads has whirls and bulges at the exact locations where deletions in the alignment occur (Fig. 6). The deletions likely occurred due to k-mers originating in erroneous reads associated with other contigs that were recruited to an incorrect region (that of contig 10362) in the de Bruijn graph. Since SEQuel builds the positional de Bruijn graph on only the set of reads that permissively align to a single contig (and not the complete set of reads), the complexity caused by erroneous k-mers being recruited from other regions in the graph is eliminated.
Fig. 6.

The second illustration of the connection between assembly errors, and whirls and bulges in the de Bruijn graph. The alignment of a 725 bp contig from the assembly with Velvet and k=31 (contig number 10362) shows two deletions in the contig, having respective lengths 20 bp and 7 bp. The regions in the de Bruijn graph corresponding to the deletions in alignment are complex and contain bulges and whirls that likely lead to assembly errors
The graphs shown in Figures 5 and 6 are only estimates of the relevant regions in the de Bruijn graph constructed by the assembler; the actual graph includes k-mers from the entire dataset (not just k-mers that aligned to a single or several contigs). Both examples reveal the complexity inherent to the de Bruijn graph even on a small set of reads and provide insight into possible causes of assembly errors. The positional de Bruijn graph constructed from the same reads is substantially less complex. The recruitment of k-mers from one contig to an unrelated contig (as shown in Fig. 6) presents a severe problem to NGS assemblers, since the position of k-mers cannot be ascertained prior to assembly. A post-processing step is needed to define relative position and reconcile the complexity of the original de Bruijn graph, thus the second example serves to illustrate the necessity of a post-processing step to assembly.
6 CONCLUSIONS
To the best of our knowledge, a post-processing step for obtaining more accurate NGS assemblies has not been previously considered. While Donmez and Brudno (2011) state ‘The consensus sequence for each contig is generated using a greedy multiple sequence alignment’, no further detail is given, and the effects of this process are not evaluated. Furthermore, it cannot be used in combination with another assembler. Additionally, there is some similarity between SEQuel and the approach implemented by the LOCAS re-assembly tool (Klein et al., 2011), where positional information is used to partition reads into groups that will be assembled together. The novelty of our approach lies in the fact that we explicitly incorporate the positions of k-mers into the graph theoretical model.
While SEQuel significantly reduces the amount of assembly errors, it does not address the notoriously difficult problem of repeat separation in fragment assembly. Although significant efforts have been made to resolve this problem in Sanger sequencing (Kececioglu and Yu, 2001; (Myers, 2001; Tammi et al., 2002; Zhi et al., 2007)), it remains poorly addressed in the context of NGS. The positional de Bruijn graph offers an opportunity to revisit this problem in future research.
Our results demonstrate that a substantial number of small indels and substitution errors can be corrected in both single-cell and standard (multi-cell) assemblies. In particular, our results on single-cell assemblies further illustrate that high and uniform coverage is not a requirement for SEQuel. Lastly, we show that the corrections made by SEQuel can likely be accomplished only in post-processing of assembly, since the positional information cannot be inferred prior to assembly.
ACKNOWLEDGEMENTS
The authors would like to thank Glenn Tesler from the University of California, San Diego, for many insightful discussions. The authors wish to thank the reviewers for their insightful comments.
Funding: CB and PP were funded by National Institutes of Health (grant 3P41RR024851-02S1) for the duration of this research. RR was funded by National Science Foundation (grant CCF-1115206). Finally, CB was partially funded by Natural Sciences and Engineering Research Council of Canada, Postdoctoral Fellowship Program.
Conflict of Interest: none declared.
Footnotes
1Velvet generates assemblies that are substantially more accurate using k=55, however this is a more advanced parameterization since it requires recompilation of the source code with a slight modification. Thus, typical use of Velvet by non-expert users would be with k=31.
2To illustrate that SEQuel can be used with any assembler, we further tested it with SOAPdenovo (Li et al., 2010) and SPAdes (Bankevich et al., 2012), a new NGS assembler (http://bioinf.spbau.ru/spades). On the multi-cell E.coli data, the SOAPdenovo (SPAdes) assembly had 1230 (199) substitution errors, and 27 (14) small indels totaling 590 (94) bp. SEQuel reduced the number of substitution errors in SOAPdenovo (SPAdes) by 95% (26%), and the total indel size by 80% (91%). The number of substitution errors in the SOAPdenovo assembly was dramatically reduced, illustrating that the application of SEQuel can improve this assembly so that it is nearly as accurate as that of Velvet, which is currently the most accurate assembler.
3The largest number of corrections made was in the Velvet (k=31) assembly of standard multi-cell data, and the number of corrections was 65% less than that of SEQuel.
REFERENCES
- Alkan S., et al. Limitations of next-generation genome sequence assembly. Nature Meth. 2011;8:61–65. doi: 10.1038/nmeth.1527. [DOI] [PMC free article] [PubMed] [Google Scholar]
- Bankevich A., et al. SPAdes: a New Genome Assembly Algorithm and its Applications to Single-Cell Sequencing. J. Comp. Bio. 2012;19:455–477. doi: 10.1089/cmb.2012.0021. [DOI] [PMC free article] [PubMed] [Google Scholar]
- Bentley D.R., et al. Accurate whole genome sequencing using reversible terminator chemistry. Nature. 2008;456:53–59. doi: 10.1038/nature07517. [DOI] [PMC free article] [PubMed] [Google Scholar]
- Butler J., et al. ALLPATHS: De novo assembly of whole-genome shotgun microreads. Genome Res. 2008;18:810–820. doi: 10.1101/gr.7337908. [DOI] [PMC free article] [PubMed] [Google Scholar]
- Chitsaz H., et al. Efficient de novo assembly of single-cell bacterial genomes from short-read datasets. Nature Biotech. 2011;29:915–921. doi: 10.1038/nbt.1966. [DOI] [PMC free article] [PubMed] [Google Scholar]
- Compeau P.E.C., et al. How to apply de Bruijn graphs to genome assembly. Nature Biotech. 2011;29:987–991. doi: 10.1038/nbt.2023. [DOI] [PMC free article] [PubMed] [Google Scholar]
- DePristo M., et al. A framework for variation discovery and genotyping using next-generation DNA sequencing data. Nature Gene. 2011;43:491–498. doi: 10.1038/ng.806. [DOI] [PMC free article] [PubMed] [Google Scholar]
- Donmez N., Brudno M. Hapsembler: as assembler for highly polymorphic genomes. In: Bafna V., Cenk S., editors. RECOMB 2011. Vol. 6577. Heidelberg: Springer; 2011. pp. 38–51. LNCS. [Google Scholar]
- Ewing B., Green P. Base-calling of automated sequencer traces using Phred.II. ErrorProbabilities. Genome Res. 1998;8:186–194. [PubMed] [Google Scholar]
- Ewing B., et al. Base-calling of automated sequencer traces using Phred.I.Accuracy assessment. Genome Res. 1998;8:175–185. doi: 10.1101/gr.8.3.175. [DOI] [PubMed] [Google Scholar]
- McKenna A., et al. The genome analysis toolkit: a MapReduce framework for analyzing next-generation DNA sequencing data. Genome Res. 2010;20:1297–303. doi: 10.1101/gr.107524.110. [DOI] [PMC free article] [PubMed] [Google Scholar]
- Hannenhalli S., et al. Positional sequencing by hybridization. CABIOS. 1996;12:19–24. doi: 10.1093/bioinformatics/12.1.19. [DOI] [PubMed] [Google Scholar]
- Hirschberg D.S. A linear space algorithm for computing maximal common subsequences. Comm. A.C.M. 1975;18:341–343. [Google Scholar]
- Huang S., et al. The genome of the cucumber. Cucumis sativus L. Nature Gen. 2009;41:1275–1281. doi: 10.1038/ng.475. [DOI] [PubMed] [Google Scholar]
- Idury R.M., Waterman M.S. A new algorithm for dna sequence assembly. J. Comput. Biol. 1995;2:291–306. doi: 10.1089/cmb.1995.2.291. [DOI] [PubMed] [Google Scholar]
- Kececioglu J., Yu J. RECOMB 2001. New York, NY: ACM; 2001. Separating Repeats in DNA Sequence Assembly; pp. 176–183. [Google Scholar]
- Kelley D.R., et al. Quake: quality-aware detection and correction of sequencing errors. Genome Biol. 2010;11:R116. doi: 10.1186/gb-2010-11-11-r116. [DOI] [PMC free article] [PubMed] [Google Scholar]
- Kent W.J. BLAT – the BLAST-like alignment tool. Genome Res. 2002;12:656–664. doi: 10.1101/gr.229202. [DOI] [PMC free article] [PubMed] [Google Scholar]
- Klein J.D., et al. LOCAS–a low coverage assembly tool for resequencing projects. PLoS One. 2011;6:e23455. doi: 10.1371/journal.pone.0023455. [DOI] [PMC free article] [PubMed] [Google Scholar]
- Li H., Durbin R. Fast and accurate short read alignment with Burrows-Wheeler transform. Bioinformatics. 2009;25:1754–1760. doi: 10.1093/bioinformatics/btp324. [DOI] [PMC free article] [PubMed] [Google Scholar]
- Li R., et al. The sequence and de novo assembly of the giant panda genome. Nature. 2010;463:311–317. doi: 10.1038/nature08696. [DOI] [PMC free article] [PubMed] [Google Scholar]
- Li R., et al. De novo assembly of human genomes with massively parallel short read sequencing. Genome Res. 2010;20:265–272. doi: 10.1101/gr.097261.109. [DOI] [PMC free article] [PubMed] [Google Scholar]
- Myers G. Optimally separating sequences. Genome Inform. 2001;12:165–174. [PubMed] [Google Scholar]
- Medvedev P., et al. Error correction of high-throughput sequencing datasets with non-uniform coverage. Bioinformatics. 2001;27:i137–i141. doi: 10.1093/bioinformatics/btr208. [DOI] [PMC free article] [PubMed] [Google Scholar]
- Genome 10K Community of Scientists. Genome 10k: a proposal to obtain whole-genome sequence for 10000 vertebrate species. J. Hered. 2009;100:659–674. doi: 10.1093/jhered/esp086. [DOI] [PMC free article] [PubMed] [Google Scholar]
- Pevzner P., Chaisson M. Short read fragment assembly of bacterial genomes. Genome Res. 2008;18:324–330. doi: 10.1101/gr.7088808. [DOI] [PMC free article] [PubMed] [Google Scholar]
- Pevzner P., et al. De novo repeat classification and fragment assembly. Genome Res. 2004;14:1786–1796. doi: 10.1101/gr.2395204. [DOI] [PMC free article] [PubMed] [Google Scholar]
- Pevzner P.A., et al. An eulerian path approach to DNA fragment assembly. Proc. Natl. Acad. Sci. 2001;98:9748–9753. doi: 10.1073/pnas.171285098. [DOI] [PMC free article] [PubMed] [Google Scholar]
- Raghunathan A., et al. Genomic DNA amplification from a single bacterium. Appl. Environ. Microbiol. 2005;71:3342–3347. doi: 10.1128/AEM.71.6.3342-3347.2005. [DOI] [PMC free article] [PubMed] [Google Scholar]
- Robinson G.E., et al. Creating a buzz about insect genomes. Science. 2011;331:1386. doi: 10.1126/science.331.6023.1386. [DOI] [PubMed] [Google Scholar]
- Rodrigue S., et al. Whole genome amplification and de novo assembly of single bacterial cells. PLoS One. 2009;4:e6864. doi: 10.1371/journal.pone.0006864. [DOI] [PMC free article] [PubMed] [Google Scholar]
- Simpson J.T., et al. ABySS: a parallel assembler for short read sequence data. Genome Res. 2009;19:1117–1123. doi: 10.1101/gr.089532.108. [DOI] [PMC free article] [PubMed] [Google Scholar]
- Tammi M.T., et al. Separation of nearly identical repeats in shotgun assemblies using defined nucloetide positions, DNPs. Bioinformatics. 2002;18:379–388. doi: 10.1093/bioinformatics/18.3.379. [DOI] [PubMed] [Google Scholar]
- Wheeler D.A., et al. The complete genome of an individual by massively parallel DNA sequencing. Nature. 2008;452:872–876. doi: 10.1038/nature06884. [DOI] [PubMed] [Google Scholar]
- Zerbino D.R., Birney E. Velvet: algorithms for de novo short read assembly using de bruijn graphs. Genome Res. 2008;18:821–829. doi: 10.1101/gr.074492.107. [DOI] [PMC free article] [PubMed] [Google Scholar]
- Zhi D., et al. Correcting base-assignment errors in repeat regions of shotgun assembly. IEEE/ACM Trans. Comput. Biol. Bioinform. 2007;4:54–64. doi: 10.1109/TCBB.2007.1005. [DOI] [PubMed] [Google Scholar]