
Fig. 1.
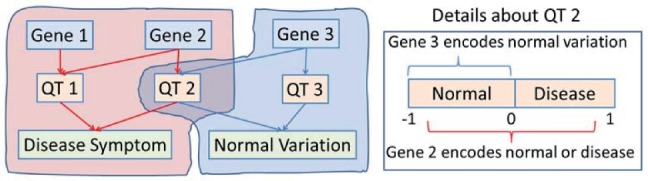
A simplified schematic example of two pathways from gene to QTs to phenotypic endpoints: the red one is disease relevant while the blue one yields only normal variation. Traditional two-stage imaging genetic strategy identifies QT 1 and QT 2 first and then Genes 1, 2, 3. Our new method will identify only disease relevant genes (i.e. Gene 1 and Gene 2); and Gene 3 would not be identified because it cannot be used to classify disease status