
Fig. 2.
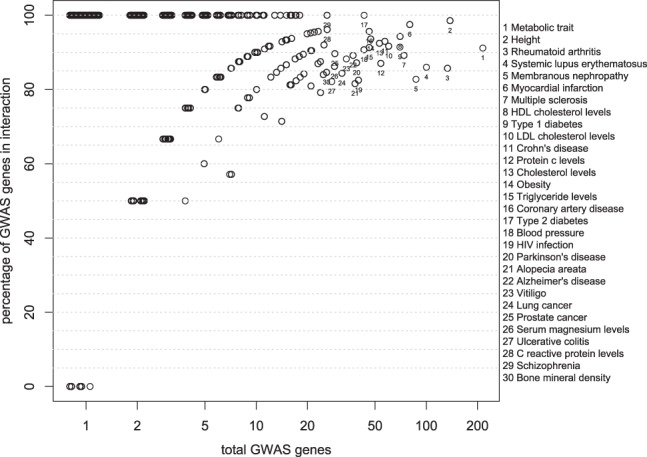
Proportion of VARIMED genes covered in CTD versus number of total genes associated for a particular phenotype. We associated a gene with a phenotype bases on presence of a variant in an intron, exon or promoter region for that gene. Variants are associated with a phenotype with a P-value <1 × 10⁻⁶. Phenotypes with >20 genes, such as ‘Metabolic Trait’, ‘Height’ and ‘Rheumatoid arthritis’ are labeled with numbers (key on right panel). T2D is depicted as 17, with 100% of 43 genes having some documented molecular interaction in the CTD. Values on the x-axis jittered to show density