Abstract
Rapid, sensitive, and highly specific flow-cytometric assays were developed for the detection of the top six non-O157 Shiga toxin-producing Escherichia coli (STEC) O groups in ground beef. The analytical sensitivity of the assays was 2 × 10³ target cells in a bacterial mixture of 105 CFU/ml, and the limit of detection in ground beef was 1 to 10 CFU following 8 h of enrichment. The assays may be utilized for rapid detection of STEC O groups in meat.
TEXT
Recently the Food Safety and Inspection Services of the U.S. Department of Agriculture declared six non-O157 Shiga toxin-producing Escherichia coli (STEC) O groups (O26, O45, O103, O111, O121, and O145) to be adulterants in meat (8). These top six STEC O groups were found to be associated with 75% to 80% of human infections (8). Current methods for detecting O groups by serotyping are labor and resource intensive and can take 5 to 9 days to complete. Recently, we and others developed PCR methods for the identification of STEC O groups (1, 4, 9). Flow cytometry is one of the emerging techniques that may be exploited for rapid identification of E. coli serogroups for food safety, public health, medical diagnosis, and environmental monitoring (3, 5, 7, 10). The objective of the present study was to develop flow-cytometric assays for detecting the six major non-O157 STEC O groups that can be easily adopted for food safety testing.
Polyclonal antibodies were raised in rabbits against heat-killed, whole-cell preparations of reference E. coli strains belonging to serogroups O26, O45, O103, O111, O121, and O145 and were further purified by SDIX (Newark, DE). Specificities of the antibodies were tested by agglutination assays against reference strains belonging to serogroups O1 through O181, except O31, O47, O67, O72, O93, O94, and O122, which are not designated serogroups, 10 clinical isolates belonging to each of the top six STEC serogroups (total, 60 isolates), and isolates of other bacterial species, including Citrobacter freundii, Enterobacter cloacae, Hafnia alvei, Klebsiella pneumoniae, Proteus vulgaris, Salmonella enterica serovars Enteritidis and Typhi, Serratia marcescens, Shigella boydii, and Shigella flexneri.
Ground beef (10% fat) samples purchased from a local store were spiked with reference strains belonging to top six STEC O groups, individually or with a mixture of all six strains, in duplicates at 1 to 10 CFU per strain. The ground beef samples (25 g) were enriched in 225 ml tryptic soy broth (TSB) containing vancomycin (16 mg/liter), bile salts (1.5 g/ml), rifampin (2 mg/liter), and potassium tellurite (1 mg/liter) as earlier reported (4, 6, 9). All samples were incubated at 37°C for initial 4 h pre-enrichment followed by incubation at 42°C for a total of 12 h enrichment. During enrichment, samples were collected at different time points (6, 8, and 12 h) and passed through filter paper to remove debris. Samples (1 ml) were centrifuged at 6,000 × g for 10 min, and the cell pellets were washed once with 1 ml of phosphate-buffered saline (PBS) and resuspended in PBS (200 μl) for staining with the respective labeled antibody, prepared as described below. Total numbers of bacterial cells in enriched samples were calculated by the aerobic plate count (APC) method. Uninoculated ground beef samples, enriched similarly, served as negative controls. Experiments were performed in duplicate and repeated three times.
Purified antibodies raised against all six STEC O groups were labeled using a Zenon rabbit IgG labeling kit (Molecular Probes). Antibodies (1 μg) were mixed with PBS (10 μl) and 5 μl of Zenon rabbit IgG labeling reagent (Alexa Fluor 488) and incubated for 5 min at room temperature (RT). Zenon blocking reagent (5 μl) was added to the mixture, which was incubated for an additional 5 min. The labeled antibodies were mixed with enriched bacterial cells (200 μl) and incubated for 1 h at RT. They were washed three times with PBS (1 ml), resuspended in PBS (0.5 ml), and analyzed in a flow cytometer.
Cytometric analysis was performed on a Beckman Coulter FC500 flow cytometer equipped with an argon ion blue 488-nm laser and a HeNe red 633-nm laser, each with a 20-mW output. The instrument resolves 0.5-μm particles from background. Events (100,000) from the labeled bacterial cell suspension were analyzed, with the forward-scatter discriminator set at 5. Bacterial cells were gated on the basis of the forward-versus-side-scatter profile, with typically >99% of all events being classified as bacterial cells. Listmode data files were collected using CXP software and analyzed using FlowJo version 7.6.5 (Tree Star, Inc., Ashland, OR).
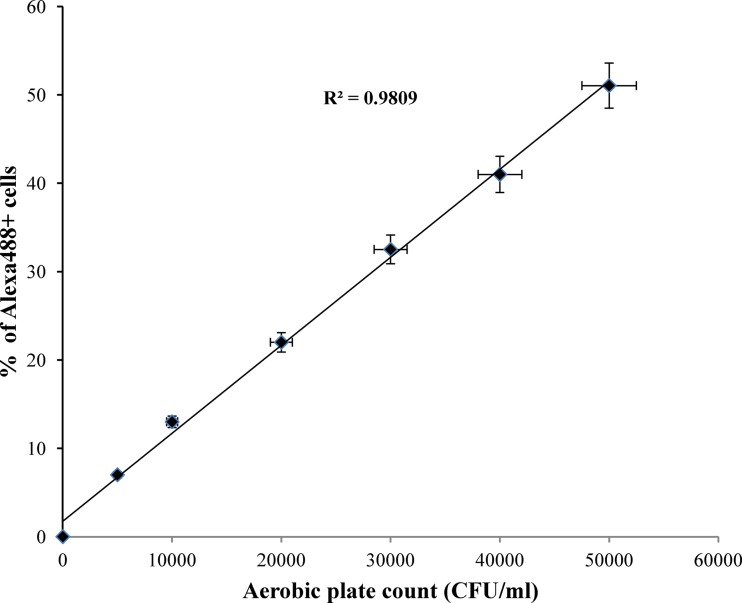
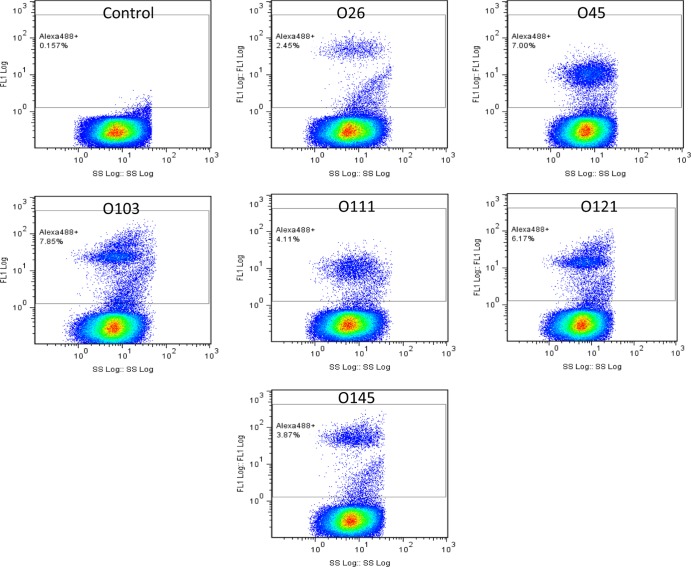
Excellent correlation was observed between the percent fluorophore-labeled cells as measured by flow cytometry and the number of bacterial cells as determined by APC for all six serogroups (R2 = 0.9809) (Fig. 1). The background flora in enriched cultures was low, and the growth rates of target bacteria varied, with O103 and O45 strains showing faster growth than the others (data not shown). The flow-cytometric assays could detect all six serogroups when spiked individually (Fig. 2) and in the mixture of strains belonging to all six O groups (data not shown) following 8 h of enrichment. The flow-cytometric assay could detect target serogroups unequivocally at 2 × 10³ cells without any cross-reaction. Because of the higher growth rate, 6 h of enrichment was good for detecting strains belonging to O45 and O103 by flow cytometry; however, 8 to 12 h of enrichment was required to distinguish all six O groups by this method. At 12 h of enrichment, the target serogroup represented >15% of cells in the enriched culture. The limit of detection was determined to be 1 to 10 CFU for the targeted O group in ground beef following 8 to 12 h of enrichment.
Fig 1.
Relationship between percent fluorophore-labeled cells detected by flow cytometry and cell number determined by the aerobic plate count method.
Fig 2.
Detection of STEC O groups by flow cytometry in artificially inoculated ground beef. Samples of ground beef were individually spiked (1 to 10 CFU) with the top six serogroups, and bacteria were detected after 8 h of enrichment. Cells above the horizontal bar represents percent Alexa Fluor 488-positive cells for 100,000 events.
The specificity of the antibodies against each O group was determined against reference strains for all other O serogroups and bacteria listed by agglutination reactions (2). There was no cross-reactivity of the top six STEC O groups with other O serogroups or bacterial species tested. Flow cytometry may be utilized for rapid detection of six non-O157 STEC O groups in conjunction with PCR assays for Shiga toxins and intimin genes for food testing and clinical diagnosis.
ACKNOWLEDGMENTS
The funding provided by the Pennsylvania Department of Agriculture (agreement number ME 44102412) is gratefully acknowledged.
We thank Ruth Nissly of the Microscopy and Cytometry Facility in the Huck Institutes of the Life Sciences for her assistance in using the flow cytometer and in data analysis.
Footnotes
Published ahead of print 4 April 2012
REFERENCES
- 1. DebRoy C, Roberts E, Valadez AM, Dudley EG, Cutter CN. 2011. Detection of Shiga toxin-producing E. coli O26, O45, O103, O111, O113, O121, O145 and O157 serogroups by multiplex PCR of the wzx gene of the O-antigen cluster. Foodborne Pathog. Dis. 8:651–652 [DOI] [PubMed] [Google Scholar]
- 2. DebRoy C, Roberts E, Fratamico PM. 2011. Detection of O antigens in Escherichia coli. Anim. Health Res. Rev. 12:169–185 [DOI] [PubMed] [Google Scholar]
- 3. Ferrari BC, Oregaard G, Sørensen SJ. 2004. Recovery of GFP-labeled bacteria for culturing and molecular analysis after cell sorting using a benchtop flow cytometer. Microb. Ecol. 48:239–245 [DOI] [PubMed] [Google Scholar]
- 4. Fratamico PM, et al. 2011. Detection by multiplex real-time polymerase chain reaction assays and isolation of Shiga toxin-producing Escherichia coli serogroups O26, O45, O103, O111, O121, and O145 in ground beef. Foodborne Pathog. Dis. 8:601–607 [DOI] [PubMed] [Google Scholar]
- 5. Nebe-von-Caron G, Stephens PJ, Hewitt CJ, Powell JR, Badley RA. 2000. Analysis of bacterial function by multi-colour fluorescence flow cytometry and single cell sorting. J. Microbiol. Methods 42:97–114 [DOI] [PubMed] [Google Scholar]
- 6. Possé B, De Zutter L, Heyndrickx M, Herman L. 2008. Quantitative isolation efficiency of O26, O103, O111, O145 and O157 STEC serotypes from artificially contaminated food and cattle faeces samples using a new isolation protocol. J. Appl. Microbiol. 105:227–235 [DOI] [PubMed] [Google Scholar]
- 7. Shapiro HM. 2000. Microbial analysis at the single-cell level: tasks and techniques. J. Microbiol. Methods 42:3–16 [DOI] [PubMed] [Google Scholar]
- 8. USDA Food Safety and Inspection Service 2011. Risk profile for pathogenic non-O157 Shiga toxin-producing Escherichia coli (non-O157 STEC). USDA Food Safety and Inspection Service, Washington, DC: http://www.fsis.usda.gov/pdf/non_o157_stec_risk_profile.pdf [Google Scholar]
- 9. Valadez AM, DebRoy C, Dudley EG, Cutter CN. 2011. Multiplex PCR detection of Shiga toxin-producing Escherichia coli strains belonging to serogroups O157, O103, O91, O113, O145, O111, and O26 experimentally inoculated in beef carcass swabs, beef trim, and ground beef. J. Food. Prot. 74:228–239 [DOI] [PubMed] [Google Scholar]
- 10. Yang L, et al. 2010. Rapid, absolute, and simultaneous quantification of specific pathogenic strain and total bacterial cells using an ultrasensitive dual-color flow cytometer. Anal. Chem. 82:1109–1116 [DOI] [PubMed] [Google Scholar]


