

Abstract
Regulating appropriate activation of the immune response in the healthy host despite continual immune surveillance dictates that immune responses must be either self-limiting and therefore negatively regulated following their activation or prevented from developing inappropriately. In the case of antigen-specific T cells, their response is attenuated by several mechanisms, including ligation of CTLA-4 and PD-1. Through the study of the viral OX2 (vOX2) immunoregulator encoded by Kaposi's sarcoma-associated herpesvirus (KSHV), we have identified a T cell-attenuating role both for this protein and for CD200, a cellular orthologue of the viral vOX2 protein. In vitro, antigen-presenting cells (APC) expressing either native vOX2 or CD200 suppressed two functions of cognate antigen-specific T cell clones: gamma interferon (IFN-γ) production and mobilization of CD107a, a cytolytic granule component and measure of target cell killing ability. Mechanistically, vOX2 and CD200 expression on APC suppressed the phosphorylation of ERK1/2 mitogen-activated protein kinase in responding T cells. These data provide the first evidence for a role of both KSHV vOX2 and cellular CD200 in the negative regulation of antigen-specific T cell responses. They suggest that KSHV has evolved to harness the host CD200-based mechanism of attenuation of T cell responses to facilitate virus persistence and dissemination within the infected individual. Moreover, our studies define a new paradigm in immune modulation by viruses: the provision of a negative costimulatory signal to T cells by a virus-encoded orthologue of CD200.
INTRODUCTION
In order to protect against autoimmune pathogenesis, antigen-specific T cells require negative regulatory signals to limit their responses. Perhaps the archetypal proponent in this regard is cytotoxic T lymphocyte-associated antigen 4 (CTLA-4) expressed on the surface of activated memory and regulatory T cells. Its negative regulatory role in T cell responses was recognized from the study of CTLA-4-deficient mice (45, 48). Current opinion on the mechanism of CTLA-4 negative regulation suggests that it subsumes the T cell receptor (TCR) “stop signal” that enables T cells and antigen-presenting cells (APC) to engage in order to effect the formation of the immunological synapse (39). CTLA-4 therefore reduces the duration of the interaction between effector and target cells (see reference 36). This process occurs through CTLA-4 capturing from opposing cells the CD80 and CD86 ligands it shares with the CD28 stimulatory receptor. Capture ensues through trans-endocytosis, and the costimulatory ligands are then degraded within the CTLA-4-expressing cells (30). However, the complexity of the effector-target cell interaction mandates that multiple mechanisms operate in concert to fine-tune it and its potential immunopathogenic consequences. Indeed, other such negative regulatory mechanisms include ligation of PD-1 on the T cell surface by either PD-L1 or PD-L2 on the APC (14), CD8 downregulation to “detune cytotoxic T lymphocytes (CTL)” (51), and the production of anti-inflammatory interleukin-10 (IL-10) by influenza virus-specific T cells (44). Additionally, regulatory T cells attenuate CTL responses, for example, during acute virus infection (52).
In the present study, we present evidence for a further negative costimulatory or tolerizing component of antigen-specific T cells, identified through the study of the immunomodulatory faculties of Kaposi's sarcoma-associated herpesvirus (KSHV). KSHV (10), the etiologic agent of Kaposi's sarcoma and primary effusion lymphoma, is also associated with multicentric Castleman's disease (6). KSHV gene K14 is expressed during viral replication. This gene encodes the viral OX2 (vOX2) protein, which shares 36% protein identity with human CD200. The vOX2 protein inhibits innate immune responses, including those of neutrophils (33), basophils and natural killer cells (40), and macrophages (13), but it may also activate macrophages (11, 37). KSHV is not alone in carrying a CD200 orthologue, with other members of the herpesvirus and poxvirus families also encoding such genes (9, 13).
CD200, also called OX2, is widely distributed throughout the body (50). In contrast, the expression of its cognate receptor (CD200R) is restricted to T cells and myeloid lineages (23, 49). CD200 and vOX2 interact with CD200R with similar affinities (13). The role of CD200 in negative immunoregulation, or tolerance, in vivo was first demonstrated by Gorczynski et al. with a recombinant form of the protein that increased the survival of murine recipients of allografts and xenografts (15). Likewise, Hoek et al. demonstrated immune activation in murine CD200 (mCD200) knockout mice (19) with increased incidence and severity of collagen-induced arthritis, a murine model of rheumatoid arthritis. Murine experimental autoimmune uveoretinitis is also more severe in mCD200−/− mice (7), and skin grafts from mCD200−/− mice onto wild-type (WT) mice were more inflamed and susceptible to hair loss than grafts from WT mice (34). During influenza virus infection, inflammation, pathology, and disease severity were increased in mCD200−/− mice (41). In cancer, CD200 appears to negatively regulate tumor immunity both in in vivo models and because CD200 expression in multiple myeloma and acute myeloblastic lymphoma correlates with a poorer prognosis (see reference 22).
These in vivo studies, coupled with the cellular distribution of CD200 and CD200R, hint that this axis negatively regulates adaptive immune responses and may explain the existence of a CD200 orthologue in KSHV and other viruses. We therefore evaluated KSHV vOX2 for evidence of immunoregulatory activity against antigen-specific T cells. In parallel, we compared the activity of CD200, since both are likely to have evolved from the same ancestral gene. Ectopic expression of either KSHV vOX2 or cellular CD200 on APC suppressed two functions of cognate antigen-specific T cell clones: gamma interferon (IFN-γ) production and mobilization of CD107a, a cytolytic granule component and measure of target cell killing ability. The mechanism involves inhibition of ERK1/2 phosphorylation. Our data suggest that CD200 contributes to the maintenance of the homeostasis of antigen-specific T cell responses in vivo by negatively regulating their activity in a manner similar to that of other negative costimulatory signals, including CTLA-4 and PDL-1/-2. KSHV vOX2 functions similarly.
MATERIALS AND METHODS
PBMC preparation, T cell cloning and keratinocyte immortalization.
Peripheral blood mononuclear cells (PBMC) were prepared from venous blood by density gradient centrifugation (5). T cell cloning and peptide epitope mapping were performed as described previously (42). An autologous keratinocyte cell line was derived from Epstein-Barr virus (EBV)-seropositive donor 1 by immortalizing primary keratinocytes cultured from a skin punch biopsy specimen from this donor with simian virus 40 (SV40) as described previously (8).
Ethical approval.
Ethical approval for the collection of peripheral blood was provided by the South Birmingham Research Ethics Committee (06/Q2707/300: Immunity to Herpesviruses in Healthy People). Written informed consent was provided by study participants and/or their legal guardians.
Mixed-lymphocyte reaction (MLR).
Stimulator PBMC (PBMC panel) were prepared by mixing PBMC from five subjects and incubating them at 106/ml with 25 μg ml−1 mitomycin C for 1 h. Stimulator U937 cells were engineered to stably express vOX2 by plasmid transfection (U937.vOX2); isogenic control cells were stably transfected with empty vector (U937.pBK). These cells were incubated with recombinant IFN-γ (500 IU ml−1, 48 h) and treated with mitomycin C (50 μg ml−1, 1 h). Responder human PBMC from healthy volunteers were obtained by density centrifugation and mixed in triplicate at a 1:1 ratio with stimulator cells. The activation response was measured by [3H]thymidine incorporation after 4 days of coculture.
Polyclonal anti-vOX2 antibody generation.
Polyclonal anti-vOX2 antibody was raised by rabbit inoculation with purified recombinant vOX2-Fc fusion protein. This protein is a recombinant derivative of vOX2. It was expressed as an N-terminal fusion with the C-terminal crystallizable fragment (Fc) of human IgG1 from an engineered Chinese hamster ovary cell line (see reference 33). The fusion protein was purified from the culture fluid by affinity chromatography on HiTrap recombinant protein A (Amersham), followed by gel filtration through a HiLoad 16/60 Superdex 200 size exclusion column (Amersham). New Zealand rabbits were inoculated with 50 to 100 μg protein in complete Freund's adjuvant, followed by incomplete Freund's adjuvant, at 14-day intervals. After the third immunization, the rabbits were test bled and the serum was tested for reactivity to the immunogen. Responders in this screening were boosted a fourth time with 50 μg protein, and serum was collected following exsanguination and before antibody concentration by affinity purification.
Engineering of APC to express vOX2 and CD200.
Transient transfection of HEK293 and MJS cells to express either vOX2 or CD200 was performed with Lipofectamine 2000 (Invitrogen). The vOX2-expressing plasmid was described previously (33). The CD200 gene was subcloned into the same parental plasmid backbone. BJAB cells were engineered to stably express either vOX2 or CD200 by retroviral transduction with the pQCXIP vector (Clontech), using retrovirus prepared with a commercial kit (Clontech). Stably transduced APC were cultured under puromycin selection.
KSHV-infected cells.
BCBL-1 cells are naturally infected with latent KSHV that can be reactivated by phorbol ester treatment (31).
Quantification of T cell responses by extracellular IFN-γ production.
HEK293 (HLA-A2-expressing) and MJS (HLA-B8-expressing) cells were transiently transfected in 24-well plates using 2 μl Lipofectamine 2000 (Invitrogen) per well with plasmid vectors expressing EBV antigen BRLF1, BMLF1, or BZLF1. Some cells were cotransfected with plasmid vectors expressing vOX2, CD200, or BILF1. The total plasmid load for all cotransfections was normalized to 2.0 μg per well with empty expression vector pQCXIP. Negative-control cells that do not express EBV antigen were transfected only with pQCXIP. The total volume of transfection mixture added to each well was 150 μl in OPTI-MEM (HEK293 cells) or RPMI (MJS cells). Following 5 h of incubation in a humidified incubator with the transfection mixture, 1 ml of Dulbecco's modified Eagle's medium plus 10% fetal calf serum (FCS) (HEK293 cells) or RPMI plus 10% FCS (MJS cells) was added to each well and the cells were incubated for a further 11 h. The cells were then disaggregated with trypsin, washed, and resuspended in RPMI plus 10% FCS. The cells were plated in triplicate in 96-well V-bottom plates (50,000 cells per well) and T cell clones specific for the EBV antigen peptide were added (5,000 cells per well) in a total volume of 100 μl per well. The plate was incubated in a humidified incubator for 16 h, following which the medium from each well was assessed for IFN-γ by enzyme-linked immunosorbent assay (ELISA) as described previously (18).
Measurement of CD200R expression.
T cells were stained with mouse monoclonal anti-CD200R antibody (OX-108; Abcam, ab17225), washed, and stained with fluorescein isothiocyanate (FITC)-conjugated goat anti-mouse IgG. Unbound sites on the secondary antibody were blocked with 10% normal mouse serum, and the T cells were then stained with VioBlue-conjugated mouse anti-CD8 antibody. Flow cytometry analyses were carried out with an LSR II flow cytometer (BD Biosciences), and analyses of the CD8+ gated population were performed with FACSDiva software (version 6.1.3).
Quantification of T cell responses by surface CD107a mobilization.
Surface CD107a expression was determined as described previously (35). Briefly, T cell clones and APC were cocultured for 30 min in a well of a 96-well plate at a ratio of 5,000 T cells to 50,000 APC/well. Monensin (2 μM; Sigma) and anti-CD107a–FITC antibody (eBioscience) were then added. Cells were incubated for 5 h at 37°C in a humidified environment, washed in phosphate-buffered saline, and stained with anti-CD8 Amcyan antibody (BD Biosciences) and dead cell exclusion dye (red; Invitrogen, Eugene, OR) for 20 min at 4°C. Samples were then washed and analyzed by flow cytometry. Flow cytometry analyses were carried out with an LSR II flow cytometer (BD Biosciences) and FACSDiva software (version 6.1.3). Single-color compensation beads (BD Biosciences) were included for each experiment, and offline automated compensation (FACSDiva version 6.1.3; BD Biosciences) was performed.
Intracellular staining and quantification.
For intracellular quantification of IFN-γ, engineered BJAB cells were incubated with EBV peptide antigens (60 min), washed, and then cocultured with cognate T cell clones for 60 min before the addition of brefeldin A (7.5 μg/ml). After a further 2 h, the cells were fixed with formaldehyde (1.5%) and stained with either anti-CD8 or anti-CD4 fluorophore-conjugated antibody (Miltenyi, 60 min, 4°C). After being washed, the cells were permeabilized with ice-cold methanol and stained with fluorophore-conjugated anti-IFN-γ antibody. Antibody labeling of the T cells was quantified by flow cytometric analysis (LSR II; BD Biosciences), and postcollection analysis of the data was carried out with FlowJo7 software (TreeStar Inc.).
Intracellular quantification of phosphoproteins was performed similarly, except that the APC and T cells were cocultured for 5 min and cell activity was immediately quenched with formaldehyde. After fixation, the cells were stained with either anti-CD4– or anti-CD8–VioBlue antibodies (Miltenyi), washed, and permeabilized with 100% methanol (30 min, 4°C) to enable labeling of intracellular antigens. After washing, staining was performed with antibodies directed against the phosphorylated forms of intracellular signaling molecules: anti-phospho-ERK1/2–phycoerythrin (PE), anti-phospho-p38–Alexa Fluor 647, anti-phospho-ζ-chain-associated protein kinase 70 (Zap70)–Alexa Fluor 647, anti-phospho-Src homology 2 domain-containing leukocyte protein of 76 kDa (SLP-76)–PE, and anti-phospho-Akt–Alexa Fluor 647 (BD Biosciences). Flow cytometric quantification and analyses were performed as described above.
RESULTS
vOX2 suppresses an allogeneic response.
We first determined whether vOX2, when expressed on the surface of stimulator cells, could deliver an inhibitory signal to human PBMC in the one-way MLR. PBMC were cocultured with U937 cells expressing native transmembrane vOX2 (U937.vOX2), U937 cells transfected with a plasmid vector lacking vOX2 (U937.pBK), or a panel of pooled allogeneic PBMC from five donors. Their proliferation was measured by quantifying [3H]thymidine incorporation after 4 days of coculture and normalized to the level obtained by coculture with U937.pBK cells (Fig. 1). Transmembrane vOX2 significantly suppressed T cell responses to allogeneic stimulation compared to those of either U937.pBK cells (U937.vOX2 versus U937.pBK; P < 0.02 [nonparametric Mann-Whitney U test]) or the positive-control stimulator cells consisting of pooled PBMC (U937.vOX2 versus PBMC panel, P < 0.04 [nonparametric Mann-Whitney U test]). There was no statistically significant difference between the proliferation stimulated by U937.pBK and that stimulated by the PBMC pool.
Fig 1.
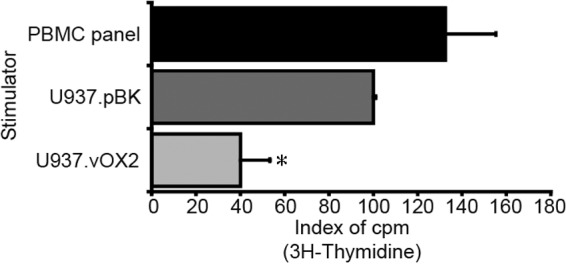
KSHV vOX2 inhibits allostimulation in the one-way MLR assay. The impact of native, transmembrane vOX2 protein in U937 stimulator cells was evaluated by the one-way MLR in human PBMC, quantifying [3H]thymidine incorporation after 4 days of coculture. The data represent the responses of four donors' PBMC, each cocultured in triplicate with either the stimulator U937 cells stably transfected with a vOX2 expression vector (U937.vOX2) or stably transfected with plasmid vector lacking vOX2 (U937.pBK). Alternatively, stimulation with a pool of PBMC from five donors served as the positive control (PBMC panel). The level of [3H]thymidine incorporation was normalized to that induced by U937.pBK. *, P = 0.02 (U937.vOX2 versus U937.pBK, nonparametric Mann-Whitney U test).
vOX2 and CD200 suppress extracellular IFN-γ production by PBMC.
Given that the one-way MLR was inhibited by vOX2, we determined whether this activity extended to inhibition of the effector function of antigen-specific T cells. First, the effect of vOX2 and CD200 on the ability of fresh PBMC from a single donor (donor 1) to secrete IFN-γ was determined. PBMC from donor 1 were cocultured with autologous keratinocyte APC that had been stably transduced to express either CD200 or vOX2 and pulsed with EBV antigen peptide. In three independent experiments, expression of either vOX2 or CD200 inhibited extracellular IFN-γ production by up to 50% (Fig. 2).
Fig 2.
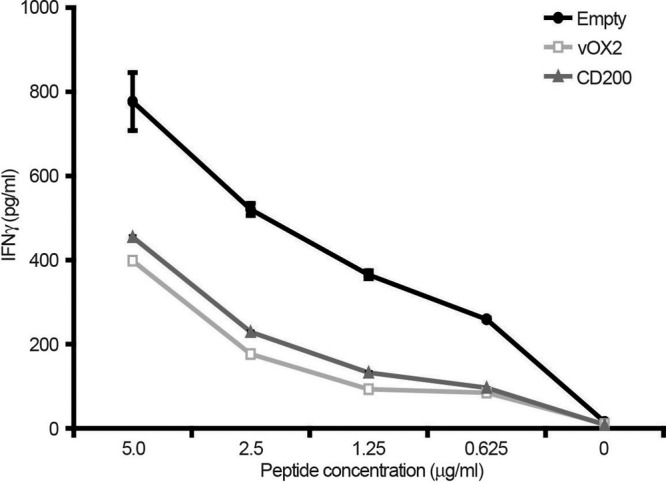
Inhibition of antigen-specific T cell restimulation by autologous APC expressing either vOX2 or CD200. An autologous keratinocyte cell line was derived from EBV-seropositive donor 1 by immortalizing primary keratinocytes cultured from a skin punch biopsy specimen from this donor with SV40. Derivative APC lines were transduced with a retroviral vector to express either vOX2 (vOX2) or CD200 (CD200) or with the parental retroviral vector pQCXIP lacking an inserted gene (Empty). PBMC from donor 1 were prepared from freshly obtained whole blood. APC lines were pulsed with HLA-A2-restricted peptide antigen and cocultured with PBMC for 16 h. The extent of antigen-specific T cell restimulation was measured by quantifying IFN-γ production by ELISA. The data are from one experiment performed in duplicate and representative of three.
vOX2 and CD200 suppress extracellular IFN-γ production by antigen-specific T cell clones.
Next, a model system was established to investigate the effect of either ectopic vOX2 or CD200 expression on the surface of cognate APC on the responses of T cell clones with defined epitope specificity. APC were transduced to express either vOX2 or CD200 on their surface, since this approach avoided known KSHV T cell modulators, which would confound the study if KSHV-infected APC were used. For example, KSHV negatively regulates T cell responses by causing lysosomal degradation of cell surface major histocompatibility complex (MHC) class I through the viral E3 ubiquitin ligases K5 and K3 (3, 12, 20, 43, 46). Since T cell clones specific for KSHV antigens were not available, clones specific for defined EBV antigens were studied. EBV-specific human T cell clones were derived from seven EBV-seropositive donors by standard procedures (42). Clones specific for the HLA-A2-restricted EBV lytic-cycle epitopes YVLDHLIVV (YVL) from BRLF1 and GLCTLVAML (GLC) from BMLF1 and the HLA-B8-restricted epitope RAKFKQLL (RAK) from BZLF1 were studied.
For these clones, HEK293 cells that express native HLA-A2 and MJS cells that express native HLA-B8 served as APC. Both cell lines naturally lack CD200. The cells were transiently cotransfected with expression vectors for vOX2 or CD200 and the EBV BRLF1, BMLF1, or BZLF1 antigen and cocultured with the T cell clones. T cell responses were measured by quantifying extracellular IFN-γ.
Data are presented for six clones, two with specificity for each of the three peptide antigens. The responses of all six T cell clones to their cognate antigens were significantly suppressed when the APC expressed either vOX2 or CD200; replicate experiments were performed, and representative data are shown in Fig. 3. Thus, BRLF1-specific clone YVL 63 was suppressed in a manner that was dependent on the amount of either vOX2- or CD200-expressing plasmid transfected into the APC (Fig. 3, upper row). For both BRLF1-specific clones YVL 113 and YVL 63, the extent of suppression of IFN-γ production was on the order of 50% at the highest level of plasmid transfected, compared to APC transfected with the same amount of parental vector lacking either vOX2 or CD200 (−, Fig. 3). Negligible background levels of IFN-γ were produced either in the absence of APC (T, Fig. 3), or in the presence of APC transfected with the parental vector lacking EBV BRLF1 (pQX, Fig. 3). As an internal control for viral protein-mediated inhibition of T cell responses, APC were transfected with a plasmid vector expressing the established immune modulator EBV BILF1 (BILF1, Fig. 3). This protein inhibits T cell responses by interfering with MHC class I antigen processing (54). As expected, expression of BILF1 suppressed IFN-γ production by clones YVL 113 and YVL 63. Although the extent of suppression and the dose-response profile varied for each clone, this pattern of IFN-γ production and its inhibition by ectopic expression of either vOX2 or CD200 was replicated for BMLF1-specific T cell clones GLC 30 and GLC 3 (Fig. 3, middle row) and BZLF1-specific clones RAK 13 and RAK 21 (Fig. 3, lower row).
Fig 3.
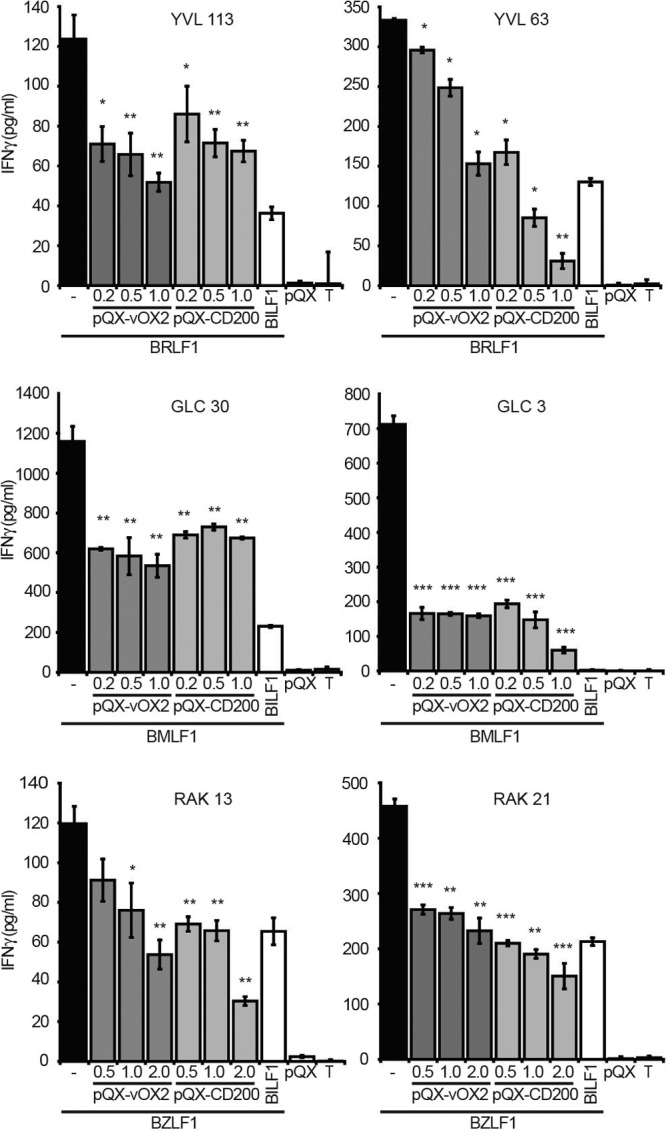
Expression of either vOX2 or CD200 on HEK293 and MJS APC reduces the production of IFN-γ by CD8+ T cell clones. EBV-specific, CD8+ T cell clones were cocultured with HLA-matched HEK293 (HLA-A2-expressing) or MJS (HLA-B8-expressing) APC transiently transfected with plasmid vectors expressing a cognate antigen, i.e., BRLF1 (HEK293, upper row), BMLF1 (HEK293, middle row), or BZLF1 (MJS, lower row). In order to determine the effect of the cell surface expression of either vOX2 or CD200 on T cell IFN-γ production, APC were cotransfected with increasing amounts (0.2 to 2.0 μg) of a plasmid expressing either of these proteins. The total plasmid load for each transfection was normalized among all of the APC used in an experiment with empty expression vector pQCXIP (pQX). The data for six clones in total are presented, with two T cell clones specific for each of the three antigens: BRLF1 (top row), clones YVL 113 and YVL 63; BMLF1 (middle row), clones GLC 30 and GLC 3; BZLF1 (bottom row), clones RAK 13 and RAK 21. T cell responses were quantified by IFN-γ ELISA after 16 h of coculture. −, APC transfected with the EBV antigen-expressing vector and the empty vector lacking either vOX2 or CD200. pQX-vOX2, APC transfected with increasing amounts of an expression vector for the KSHV vOX2 protein. pQX-CD200, APC transfected with increasing amounts of an expression vector for the cellular CD200 protein. BILF1, APC transfected with an expression vector for the known EBV-encoded T cell inhibitory protein BILF1 (54). pQX, APC transfected with only the empty expression vector (pQCXIP) lacking EBV antigen. T, cultures lacking APC. The data are from one experiment performed in triplicate and representative of two to four independent replicate experiments for each T cell clone. *, P < 0.05; **, P < 0.01; ***, P < 0.001 (Student's one-tailed t test compared to the negative control [APC expressing antigen but not vOX2 or CD200] for all replicate experiments).
Since CD200 and vOX2 interact with CD200R with similar affinities (13), the expression of CD200R on the T cell surface was determined. All of the clones expressed CD200R (Fig. 4).
Fig 4.
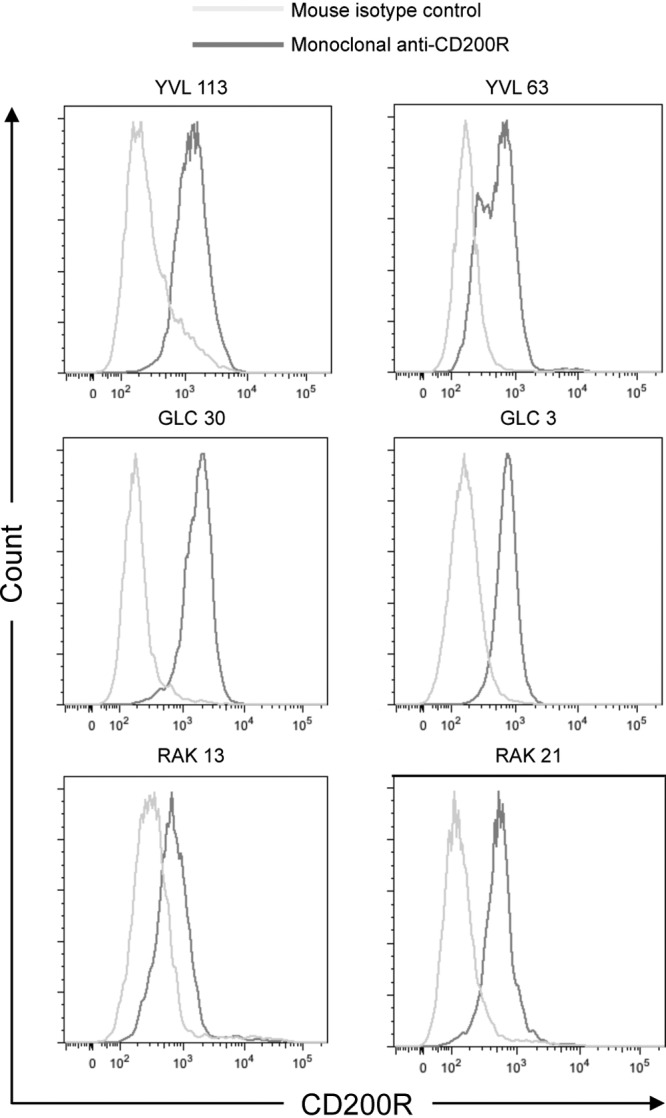
CD200R expression on the antigen-specific T cell clone surface. The expression of CD200R on CD8+ antigen-specific T cell clones was confirmed by flow cytometry. These data were acquired from aliquots of cells at the same time as their functional analyses were performed (Fig. 3). They are representative of replicates performed at least three times.
For the majority of the clones (YVL 63, GLC 3, RAK 13, and RAK 21), the level of suppression conferred by the ectopic expression of vOX2 was slightly less than that of CD200. This difference is attributed to a slightly lower level of expression of vOX2 than of CD200. This difference in the ectopic expression of the two proteins was established by creating expression vectors in which vOX2 or CD200 was fused to enhanced green fluorescent protein (eGFP) and then comparing the eGFP levels in transfected cells (data not shown). This approach mitigated any confounding effects imposed by the different affinities of the CD200 (monoclonal) and vOX2 (polyclonal) antibodies.
The expression of either vOX2 or CD200 did not affect the level of antigen expression, as determined by Western blotting (data not shown). These data indicate that vOX2 and CD200 suppression of IFN-γ production by the T cell clones is independent of a mechanism regulating antigen expression levels by the APC.
Investigation of the impact of vOX2 and CD200 on CD107a production by antigen-specific T cell clones.
Quantification of extracellular IFN-γ production is one functional assay for antigen-specific T cells. To determine whether degranulation, another function of T cells, was similarly inhibited by the expression of either vOX2 or CD200 on the APC, T cell surface mobilization of CD107a was quantified. CD107a or lysosomal membrane protein 1 is a component of cytolytic granules that is transiently mobilized to the cell surface during degranulation. Its quantification provides a robust measure of the ability of T cells on which it is expressed to kill target cells, as determined by comparison of surface CD107a expression with the conventional chromium release assay of cytotoxicity (35).
Thus, the experiments shown in Fig. 3 were repeated; in addition to the quantification of extracellular IFN-γ production by T cell clones, surface CD107a levels were quantified in parallel on the CD8+ population to identify those T cells within the clonal population that have the potential to kill target cells. A further two clones, GLC 8 and RAK 44, were evaluated in parallel with clone GLC 3 described in Fig. 3. Other cells described in Fig. 3 and 4 were not studied further, as they are not immortal and expired due to clonal exhaustion. GLC 8 recognizes the HLA-A2-restricted epitope of BMLF1 (GLC), and RAK 44 recognizes the HLA-B8-restricted epitope of BZLF1 (RAK) described above. Both of these clones also expressed CD200R (data not shown). Again, HEK293 cells that express native HLA-A2 and MJS cells that express native HLA-B8 served as APC.
As before (Fig. 3), the production of extracellular IFN-γ by these clones was suppressed in a manner that depended upon the amount of either vOX2- or CD200-expressing plasmid transfected into the APC (Fig. 5, left panels). Similarly, the frequency of T cell clones mobilizing CD107a to the surface was partly reduced by the ectopic expression of either vOX2 or CD200 (Fig. 5, right panels). The extent of the reduction depended upon the amount of ectopic expression plasmid that was transfected into the APC. For clone RAK 44, the magnitude of the reduction in CD107a surface-expressing cells by vOX2 and CD200 expression mirrored that seen for extracellular IFN-γ. For clones GLC 3 and GLC 8, this magnitude of reduction was smaller, except at the highest levels of transfected pQX-CD200. These differences most likely represent different assay readouts, i.e., the quantification of IFN-γ by ELISA and that of CD107a by flow cytometry. Moreover, they also very likely reflect different assay conditions for extracellular IFN-γ quantification, which was performed after 16 h of coculture of T cells with APC, compared with the CD107a assay, which was performed after 5 h of coculture. Taken together, these data demonstrate that vOX2 and CD200 expressed on the APC surface suppress two functions of these T cell clones in response to their cognate peptide epitope, i.e., IFN-γ production and cytolytic ability.
Fig 5.
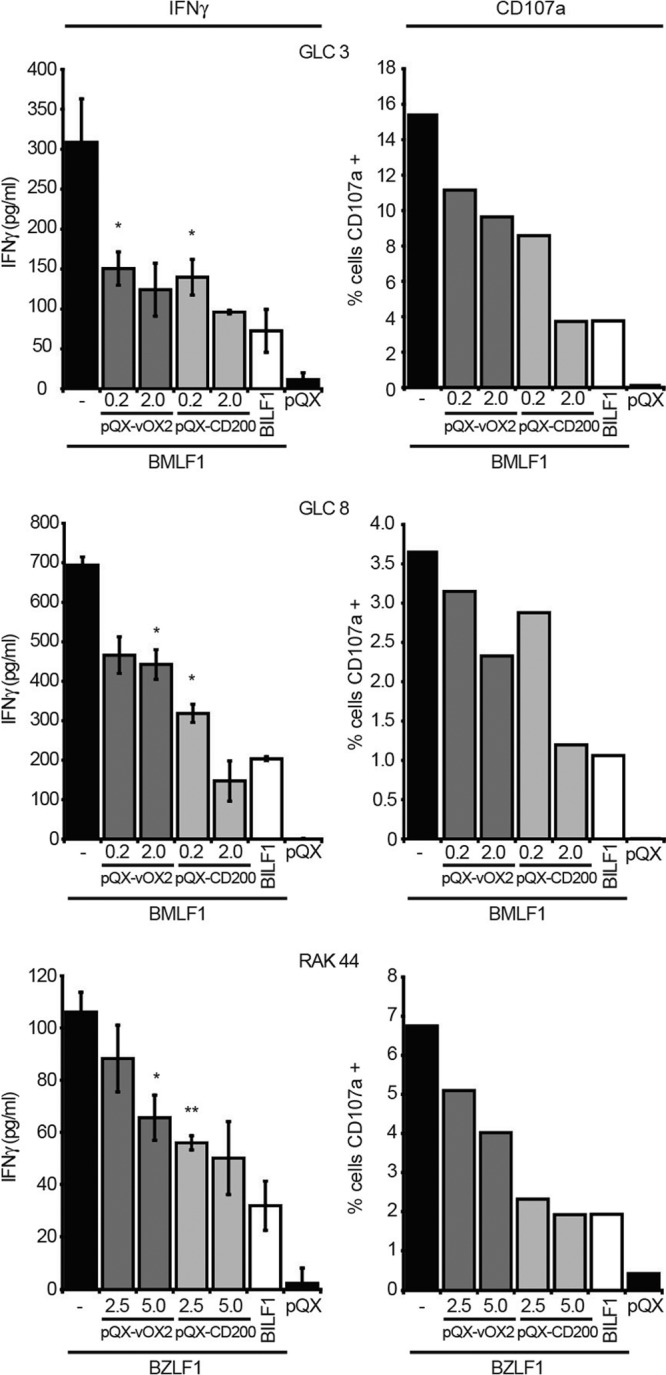
Investigation of whether vOX2 and CD200 are capable of suppressing cytotoxic T cell activity. EBV-specific, CD8+ T cell clones were cocultured with HLA-matched HEK293 (HLA-A2-expressing) or MJS (HLA-B8-expressing) APC transiently transfected with plasmid vectors expressing a cognate antigen, either BMLF-1 (upper and middle rows) or BZLF-1 (lower row). In order to determine the effect of the cell surface expression of vOX2 or CD200 on T cell surface CD107a levels (a measure of degranulation), APC were cotransfected with a plasmid expressing either of them. The total plasmid load for each transfection was normalized among all of the APC used in an experiment with empty expression vector pQX. The data for three clones are presented. T cell surface CD107a expression was quantified by flow cytometry after 5 h of coculture in the presence of monensin. T cell IFN-γ production was also quantified by ELISA performed with medium samples taken from parallel cocultures of T cells and APC after 16 h. −, APC transfected with the EBV antigen-expressing vector and the empty vector lacking either vOX2 or CD200. pQX-vOX2, APC transfected with increasing amounts of an expression vector for the KSHV vOX2 protein. pQX-CD200, APC transfected with increasing amounts of an expression vector for the cellular CD200 protein. BILF1, APC transfected with an expression vector for the known EBV-encoded T cell inhibitory protein BILF1 (54). pQX, APC transfected with only the empty expression vector lacking EBV antigen. These data from a single experiment performed in duplicate are representative of two or three performed separately and two for the CD107a studies. *, P < 0.05; ***, P < 0.001 (Student's 1-tailed t test compared to the negative control [APC expressing antigen but not vOX2 or CD200] for all replicate experiments). Statistical analyses of the CD107a data were not determined due to the biological variability of absolute percentages between replicate experiments, but the trend was the same between replicates.
To verify this finding, intracellular IFN-γ and surface CD107a levels were quantified in the same cells by flow cytometric analyses (see Fig. 6) of two clones, GLC3 and GLC8, as shown in Fig. 5. The data reveal that there are three populations of T cells expressing either CD107a or IFN-γ, i.e., CD107a+ IFN-γ−, CD107a+ IFN-γ+, and CD107a− IFN-γ+. The responses of all three populations were suppressed when either vOX2 or CD200 was expressed on the APC surface (Fig. 6).
Fig 6.
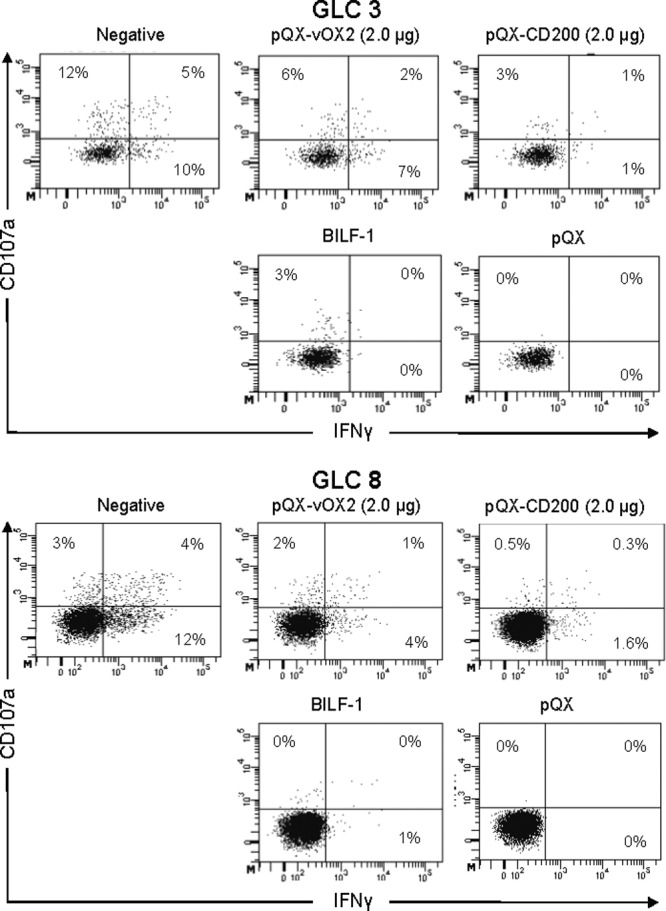
vOX2 or CD200 suppression of CD107a degranulation and IFN-γ production by antigen-specific T cells. Shown are representative dot plot data from which those of Fig. 5 are derived. CD107a degranulation (y axis) and IFN-γ production (x axis) are presented for two T cell clones, GLC 3 and GLC 8. The percentages in each plot are the percentages of cells in the quadrants. For experimental details, see the legend to Fig. 5. −, APC transfected with the EBV antigen-expressing vector and the empty vector lacking either vOX2 or CD200. pQX-vOX2 (2.0 μg), APC transfected with 2.0 μg of an expression vector for the KSHV vOX2 protein. pQX-CD200 (2.0 μg), APC transfected with 2.0 μg of an expression vector for the cellular CD200 protein. BILF1, APC transfected with an expression vector for the known EBV-encoded T cell inhibitory protein BILF1 (54). pQX, APC transfected with only the empty expression vector lacking EBV antigen.
Comparison of relative levels of endogenous and ectopic CD200 and vOX2.
Since the studies defining the inhibitory activity of vOX2 and CD200 depended on the ectopic expression of these proteins by APC, the levels of ectopic vOX2 and CD200 expression on these cells were compared with those of natural expression. Thus, expression of vOX2 on the surface of naturally infected BCBL-1 cells treated with phorbol ester to undergo lytic KSHV reactivation was compared with that of ectopic expression on HEK293 and MJS cells by flow cytometry (Fig. 7a). Both APC lines expressed much lower levels of vOX2 than did BCBL-1 cells. The level of vOX2 expression on MJS cells was lower than that on HEK293 cells, consistent with the reduced transfection efficiency of MJS cells. The data are summarized in Fig. 7c. Likewise, natural CD200 expression on primary CD19+ B cells and human umbilical vein endothelial cells (HUVEC) was measured and compared to ectopic CD200 expression levels (Fig. 7b). Ectopic expression in HEK293 cells generated levels of CD200 comparable to those of natural expression by both CD19+ B cells and HUVEC. In MJS cells, ectopic CD200 expression was much lower than that of natural CD200 expression on either of these cell types and of HEK293 cells. As for vOX2 expression levels, we attribute this lower expression of CD200 on MJS cells to their reduced transfection efficiency compared to that of HEK293 cells. The data are summarized in Fig. 7c. Taken together, these data suggest that, like the natural expression levels of ectopic vOX2 and CD200, those of these proteins would be sufficient to inhibit T cell antigen-specific IFN-γ production and cytolytic activity.
Fig 7.

Comparison of native levels of vOX2 and CD200 expression with those of cells transfected with expression vectors for either protein. (a) Quantification of vOX2 expression by fluorescence. Shown are representative histogram data from which those of panel c (left panel) were derived. KSHV in BCBL-1 cells was reactivated into lytic replication by the addition of 75 mM phorbol myristate acetate for 72 h in order to detect vOX2 expression. Data from two experiments (expt. 1 and expt. 2) are shown. To compare these levels with those of vOX2 expression in transfected APC, data are shown for HEK293 and MJS APC transfected with increasing amounts of vOX2 expression vector pQX-vOX2. (a) Quantification of CD200 expression by fluorescence. Shown are representative histogram data from which those of panel c (right side) were derived. CD200 expression in CD19+ or HUVEC from two donors is shown. To compare these levels with those of CD200 expression in transfected APC, data are shown for HEK293 and MJS APC transfected with increasing amounts of the CD200 expression vector pQX-CD200. (c, left side) Comparison of endogenous vOX2 expression levels on BCBL-1 cells treated to reactivate KSHV lytic replication with ectopic levels of HEK293 and MJS APC transfected with a vOX2 expression vector. (c, right side) Comparison of natural CD200 expression levels on CD19+ cells and HUVEC with ectopic levels of HEK293 and MJS APC transfected with the CD200 expression vector. Cells were transiently transfected with either pQX-vOX2 or pQX-CD200 for use as APC in T cell coincubation experiments (Fig. 3 and 5), and aliquots were stained with an anti-vOX2, an anti-CD200, or an isotype-matched control antibody. The level of vOX2 and CD200 expression was quantified by flow cytometry, and the average median fluorescence intensity calculated with FlowJo software from three experiments performed separately is shown.
vOX2 and CD200 inhibit ERK1/2 activation in T cell clones.
Both vOX2 and CD200 bind CD200R with equivalent affinities (13). CD200R signaling has been defined most completely in murine mast cells engineered to overexpress mCD200R1 and in human myeloid lineage cells but has not been investigated in T cells. In the engineered mast cells, recruitment of inhibitory RasGAP and SHIP by the CD200R signaling cascade inhibited the mitogen-activated protein (MAP) kinases ERK, p38, and JNK (53). In the study of human myeloid cells, the recruitment of RasGAP depended upon the adaptor protein downstream of tyrosine kinase 2 (Dok2), which was, in turn, negatively regulated by Dok1 (26).
To determine the mechanism by which vOX2 and CD200 expressed on the APC surface attenuated the response of HLA-matched antigen-specific T cell clones, intracellular signaling components participating in known T cell response pathways were quantified by flow cytometry. The approach of using flow cytometric quantification was essential for these studies; Western blotting is inappropriate, since the assay of T cell response necessitates the generation of a mixed cell population of T cells and either vOX2- or CD200-expressing APC; hence, Western blot analyses would not distinguish T cell-specific phosphoproteins from those of APC. Intracellular T cell-specific events can be monitored flow cytometrically by gating on live T cells.
In order to perform these flow cytometric signaling studies, a variation of the T cell functional assays described in Fig. 3 and 5 was devised with an APC line that grows in suspension. This APC, the EBV-negative Burkitt's lymphoma cell line BJAB, served as a target for two further HLA-matched T cell clones (PRS 93 CD4+ and YVL 15 CD8+). Like other clones evaluated in the present study (Fig. 4), both of these clones also expressed CD200R (data not shown). BJAB cells were stably transduced with a retroviral vector engineered to express either vOX2 or CD200 or with the retrovirus lacking an inserted gene.
The responses of these T cell clones to peptide-sensitized APC were evaluated by measuring intracellular IFN-γ accumulation flow cytometrically. Thus, the relative levels of IFN-γ accumulation were quantified by median fluorescence intensity, and these data were then normalized to those obtained with peptide-pulsed cells lacking either vOX2 or CD200 (i.e., empty vector [Neg] controls; Fig. 8). The cumulative data over three experiments each performed independently are summarized in Fig. 8a, and those from a single representative experiment are summarized in Fig. 8b. The clones recognized either the MHC class II HLA-DRB3*0201-restricted latent EBNA2 (PRS) epitope (PRS 93 CD4+) or the YVL epitope of BRLF1 (YVL 15 CD8+). The expression of vOX2 on the surface of the BJAB APC resulted in significant suppression of intracellular IFN-γ accumulation by an average of 33.4% for clone PRS 93 CD4+ and 37.3% for clone YVL 15 CD8+ over three experiments. The expression of CD200 on the surface of the BJAB APC also significantly suppressed intracellular IFN-γ accumulation and to a greater extent than vOX2: 62.4% for clone PRS 93 CD4+ and 59.6% for clone YVL 15 CD8+.
Fig 8.
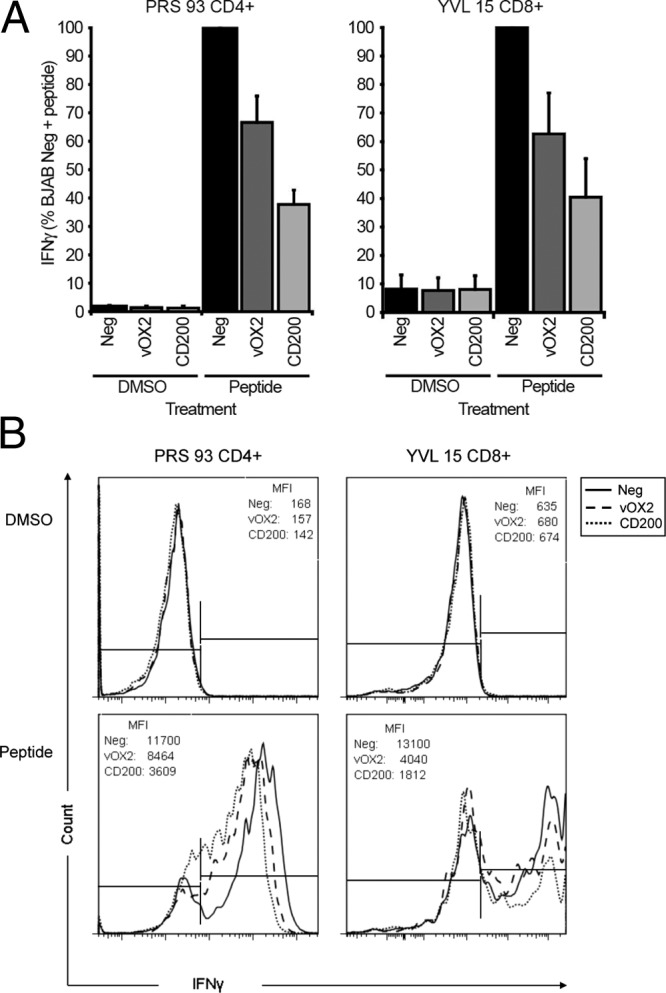
Expression of vOX2 and CD200 on BJAB APC reduces the accumulation of intracellular IFN-γ in CD4+ and CD8+ T cell clones. EBV antigen-specific T cell clones were cocultured with cognate antigen peptide-pulsed BJAB cells transduced with a retroviral vector to express either vOX2 (vOX2) or CD200 (CD200) or with the parental retroviral pQCXIP vector lacking an inserted gene (negative vector, Neg). Peptides were PRS (HLA DRB3*0201-restricted) for PRS 93 CD4+ and YVL (HLA-A2 restricted) for YVL 15 CD8+. Intracellular IFN-γ was quantified by flow cytometry as median fluorescence intensity values. (A) Cumulative data from three independent experiments were pooled and normalized to the levels obtained in parallel with peptide antigen-pulsed BJAB cells transduced with the parental pQCXIP vector lacking either vOX2 or CD200 (Neg) to generate the parameter plotted, i.e., percent negative BJAB cells plus peptide. The data are presented as this normalized mean ± the standard error of the mean. *, P < 0.05, **, P < 0.01, ***, P < 0.001 (Student's one-tailed t test). (B) Data from one representative experiment are depicted for each clone. In the upper row, data are shown for cells treated without peptide (DMSO vehicle alone) and the lower row depicts data for cognate-peptide-treated cells. The left-hand marker was set to gate 99% of the cells from the unstimulated negative sample to be IFN-γ negative; a shift of the fluorescence to the right indicates greater IFN-γ production. The median fluorescence intensity (MFI) values for this experiment are presented within each histogram.
These data for intracellular IFN-γ accumulation obtained with engineered BJAB cells as the APC are consistent with those presented in Fig. 3 and 5, demonstrating the suppressive effects of vOX2 and CD200 on the responses of separate T cell clones to peptide-sensitized HEK293 and MJS APC by quantifying extracellular IFN-γ levels. The lower suppression by vOX2 than by CD200 is also consistent with our previous studies (e.g., Fig. 3, clone YVL 63, and Fig. 5, clone RAK 44) and likely reflects the slightly lower levels of vOX2 than CD200 expression discussed above. Taken together, the data reinforce the notion that vOX2 and CD200, when expressed on the surface of different APC, inhibit the T cell responses of HLA-matched T cell clones to their cognate peptide epitope.
Because vOX2 and CD200 suppressed cytokine production by T cells, the effect of these molecules on the signaling pathway initiated by TCR-peptide binding was analyzed. Upon the presentation of an MHC-bound peptide to a TCR, a complex signaling cascade is initiated. The ITAM motifs of the TCR ζ chain and CD3 are phosphorylated by Lck or Fyn, Src family kinases that bind to the cytoplasmic tail of CD4 and CD8. Zap70 translocates to the phosphorylated ITAM tyrosines and binds to them via its two SH2 domains. Zap70 is subsequently phosphorylated by Lck and is crucial for the development of downstream signaling cascades (4). Activated p-Zap70 phosphorylates several domains on LAT and SLP-76, generating docking stations for other signaling molecules. Zap70-mediated phosphorylation of LAT is also essential for activation of the Ras pathway downstream of PLC-γ1 (29). The adaptor protein Ras, activated by PLC-γ1, recruits Raf-1 to the plasma membrane following TCR stimulation. Raf-1 is subsequently activated and in turn phosphorylates MEK-1 and MEK-2, the upstream initiators of ERK1/2 activation. Phosphorylated ERK (p-ERK1/2) is able to translocate to the nucleus and directly activate transcription factors such as AP-1, composed of Fos and Jun (1). Costimulation through the coreceptor CD28 augments the TCR signaling cascade. CD80 and CD86, proteins expressed by APC, bind to CD28 on the surface of resting T cells. Activation of phosphatidylinositol 3-kinase by CD28 subsequently phosphorylates Akt, a protein that has been identified as the regulator of IL-2 and IFN-γ secretion in T cells (2). Akt is also phosphorylated by the TCR signaling pathway downstream of Ras activation, suggesting that CD28 ligation may only enhance the TCR response rather than initiate a distinct signaling pathway.
Consequently, in the present study, intra-T-cell phosphoprotein signaling components were quantified, concentrating on the MAP kinases, due to their reported inhibition downstream of CD200R ligation (53). The cumulative data from all of the experiments, each performed independently, are summarized in Fig. 9a, and those from a representative experiment measuring the phosphorylation of ERK1/2 are shown in Fig. 9b. In both T cell clones, ERK1/2 phosphorylation was significantly reduced by the expression of either vOX2 or CD200 (Fig. 9a). Akt phosphorylation was also significantly inhibited in both T cell clones following their exposure to peptide-pulsed APC expressing either vOX2 or CD200, but not to the same extent as ERK1/2 phosphorylation (Fig. 9a). Phosphorylation of p38 was statistically significantly inhibited in the CD4+ T cell clone but not in the CD8+ clone following exposure to either vOX2- or CD200-expressing APC (Fig. 9a).
Fig 9.
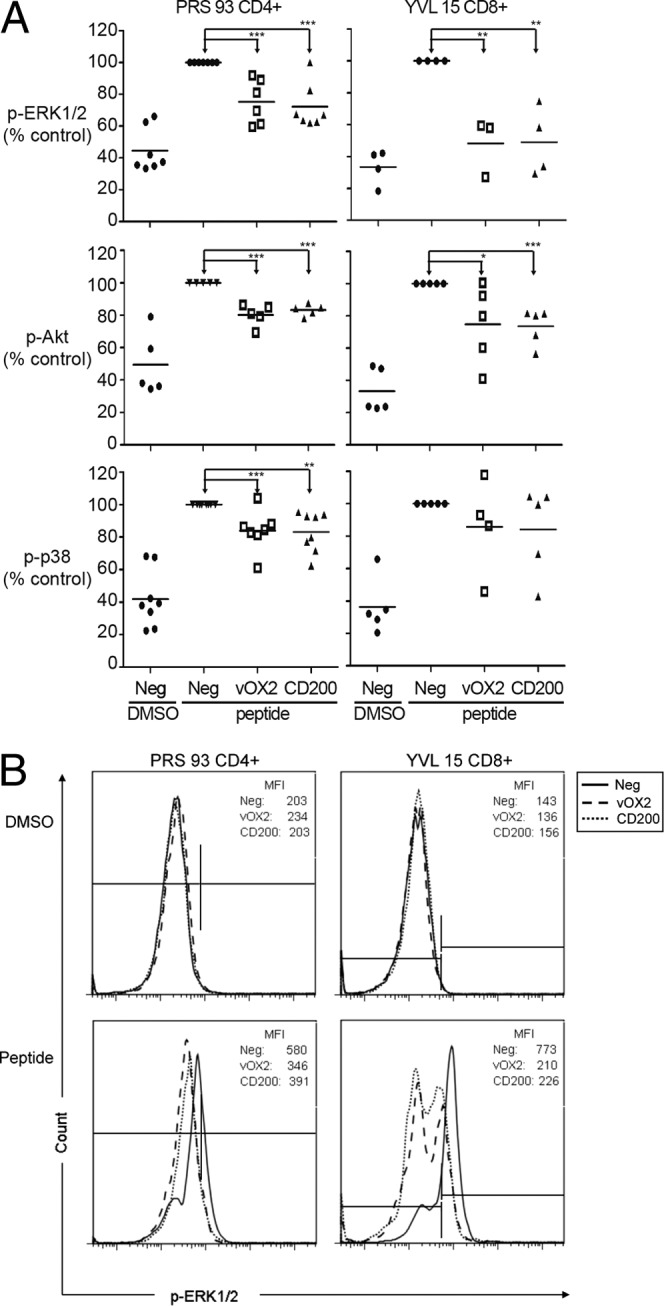
Expression of either vOX2 or CD200 on the surface of the cognate APC significantly reduces the phosphorylation of ERK1/2 and Akt in the T cell. Two human T cell clones (PRS 93 CD4+ and YVL 15 CD8+) were incubated for 5 min with cognate antigen peptide-pulsed BJAB cells transduced with a retroviral vector to express either vOX2 or CD200 or with the parental retroviral pQCXIP vector lacking an inserted gene (negative vector, Neg). Target signaling molecules were detected by antibody staining and quantified by flow cytometry. (A) Phosphoprotein levels (median fluorescence intensity) for each experiment were normalized to the levels obtained in parallel with peptide antigen-pulsed BJAB cells transduced with the parental pQCXIP vector lacking either vOX2 or CD200 (Neg) to generate the parameter plotted, i.e., percent control. Each icon indicates an independent experiment. The mean of each sample group is represented by a horizontal bar. *, P < 0.05; **, P < 0.01; ***, P < 0.001 (Student's one-tailed t test). (B) Data from one representative experiment quantifying p-ERK-1/2 are depicted for each clone. In the upper row, data are shown for cells treated without peptide (DMSO vehicle alone) and the lower row depicts data for cognate-peptide-treated cells. The left-hand marker was set to gate 99% of the cells from the DMSO-treated negative sample to be p-ERK-1/2 negative; a shift of the fluorescence to the right indicates greater ERK-1/2 phosphorylation. The median fluorescence intensity (MFI) values for this experiment are presented within each histogram.
To determine the specificity of these results, upstream phosphoprotein components of the T cell signaling pathway were quantified in parallel. Zap70 phosphorylation was readily detectable but was not suppressed by either vOX2 or CD200 in either T cell clone (Table 1). Likewise, SLP-76, associated with the LAT complex of adaptor proteins and a direct target of activated Zap70, was also not affected in either clone by either vOX2 or CD200 (Table 1).
Table 1.
Relative quantification of phosphorylation of intracellular signaling molecules in T cell clones cocultured with BJAB APC expressing vOX2 or CD200a
| Phosphosignaling molecule and T cell clone | % Phosphorylation of peptide-pulsed BJAB plus: |
||
|---|---|---|---|
| EV1 | vOX22 | CD2003 | |
| Zap-70 | |||
| CD4+ (SL c93) | 100 | 110.93 ± 8.33 | 105.93 ± 4.82 |
| CD8+ (IM140.1 Y15) | 100 | 94.34 ± 8.34 | 96.12 ± 6.14 |
| SLP-76 | |||
| CD4+ (SL c93) | 100 | 104.20 ± 7.26 | 112.15 ± 5.87 |
| CD8+ (IM140.1 Y15) | 100 | 98.92 ± 17.49 | 94.58 ± 4.99 |
EBV-specific T cell clones were cocultured with cognate antigen peptide-pulsed BJAB cells transduced with a retroviral vector to express either vOX2 (vOX22) or CD200 (CD2003) or with the parental retroviral pQXIP vector lacking an inserted gene (EV1). Peptides were PRS (HLA DRB3*0201restricted) for PRS 93 CD4+ and YVL (HLA-A2 restricted) for clone YVL 15 CD8+. Intracellular phosphorylated signaling molecules SLP-76 and Zap-70 were labeled with a fluorophore-conjugated monoclonal antibody and detected by flow cytometry. The no-peptide value of each sample was subtracted from the with-peptide value to account for the baseline level of phosphorylation. The data for BJAB-vOX2 and BJAB-CD200 were then normalized to the value for BJAB-EV. The data represent the mean ± the standard error of the mean of three to five experiments.
These data suggest that TCR-proximal events are not influenced by vOX2 and CD200 expression on the APC surface. Rather, TCR-distal events are suppressed, and of the signaling components analyzed, activation by phosphorylation of ERK1/2 is inhibited the most by vOX2 and CD200.
DISCUSSION
In the present study, we investigated the ability of the KSHV protein vOX2 to modulate cellular adaptive immune function. The data demonstrating inhibition of allogeneic proliferation of PBMC by native vOX2 (Fig. 1) generated the hypothesis that vOX2 (and CD200 [15, 16]) attenuates T cell-specific function. To test this hypothesis, a model in vitro system was established in which APC were engineered to express either native vOX2 or CD200. When these cells presented defined EBV-derived epitopes to either autologous PBMC (Fig. 2) or cognate HLA-matched human T cell clones (Fig. 3, 5, and 8), the data revealed that vOX2 and CD200 suppressed the antigen-specific T cell response. Two functions of the T cells were suppressed, i.e., (i) IFN-γ production, both extracellular (Fig. 2, 3, and 5) and intracellular (Fig. 8), and (ii) target cell killing ability, as defined by measuring the mobilization of the cytolytic granule component CD107a to the cell surface (Fig. 5 and 6).
Throughout these studies, there was a trend toward greater suppression of T cell responses by CD200 than by vOX2. Given that CD200 was expressed to a slightly higher level than vOX2 in both our HEK293 and MJS model APC (data not shown), this elevated expression of CD200 most likely accounts for this difference in T cell function-suppressing activity. Moreover, the level of ectopic expression of CD200 in our system resembles the level of natural expression in at least two primary human cell types, CD19+ B cells and HUVEC (Fig. 7b and c). The level of expression of ectopic vOX2 by both HEK293 and MJS APC was much lower than the level of endogenous vOX2 expressed by naturally infected BCBL-1 cells treated to undergo lytic KSHV replication (Fig. 7a and c). These data suggest that natural levels of expression of CD200 and vOX2 would be sufficient to suppress T cell responses and indicate physiological relevance for our studies.
The mechanism of suppression of T cell responses is associated with the inhibition of phosphorylation of ERK1/2 (Fig. 9), because the levels of phospho-ERK1/2 in responding T cells were significantly reduced by the expression of vOX2 or CD200 on the APC. Suppressed ERK1/2 phosphorylation has been associated with reduced T cell responses by others. It was correlated with UV-induced inhibition of IFN-γ production by ex vivo human cells (25) and reduced IFN-γ production and rheumatoid arthritis severity in mice invoked by deleting the gene encoding macrophage migration inhibitory factor (MIF) (38). MIF enhances ERK1/2 phosphorylation.
Akt phosphorylation in responding T cells was also inhibited by the presence of either vOX2 or CD200 on the surface of the APC, but not to the same extent as ERK1/2 phosphorylation (Fig. 9). Since Akt augments the production of IFN-γ (21), a contributing mechanistic role for vOX2 and CD200 in negatively modulating levels of phospho-AKT in the responding T cells is also likely.
Taken together, the findings of the present study implicate vOX2 and CD200 in providing a negative costimulatory signal to antigen-specific T cells. The data suggest that one role of CD200, a protein expressed on a diversity of cells (50), is therefore to contribute to the attenuation of antigen-specific T cell responses, providing a strategy analogous to that of the CTLA-4-CD80/CD86 axis. CD200 may function either in addition to or synergistically with other negative costimulatory signals, such as CTLA-4. It may also operate for those cells on which CTLA-4 ligands are absent. Our data provide a mechanistic explanation for CD200-mediated suppression of inflammation (7, 16, 19, 41), for reduced T cell responses to CD200-expressing tumor cells (24), and for the poorer prognosis of CD200-expressing multiple myeloma (28) and acute myeloid leukemia (47).
In the case of vOX2, the reason why KSHV has acquired this T cell immunomodulatory activity is presumably Darwinian, i.e., to help defend infected cells against elimination by KSHV-specific T cells, thereby facilitating virus replication. By convention, vOX2 will be expressed by those infected cells in which lytic KSHV replication is taking place. However, in vivo, it may also be expressed in those cells in which a proportion of the lytic-cycle genes are induced, including those undergoing abortive lytic replication. Indeed, the demarcation between genes expressed during latency and those expressed during lytic replication may be more diffuse than previously thought (for discussion, see references 17 and 32). Importantly, the data suggest a new paradigm in virus inhibition of T cell responses, i.e., the active provision of a negative T cell costimulatory signal.
In the context of KS pathogenesis, CD8+ T cell infiltration of tumors is abundant (27) and continuous rounds of lytic replication are likely required to recruit additional latently infected cells (17, 32). Thus, in this setting, one role for vOX2 would be to reduce the direct killing of KSHV-infected cells by antigen-specific cytotoxic T cells. The contribution of CD200 to immunoevasion by cancer stem cells (22) may be explained similarly.
ACKNOWLEDGMENTS
This work was funded by grants to D.J.B. from the Medical Research Council (MRC; G0400408), BBSRC (BBS/B/14442), and CR UK (C7934) and to D.J.B. and A.D.H. from the MRC (G0800154). A.D.H. is supported by an MRC personal fellowship (G0501074).
We thank M. Rowe and J. Zuo for helpful comments and reagents.
The funders had no role in study design, data collection and analysis, the decision to publish, or preparation of the manuscript.
Footnotes
Published ahead of print 4 April 2012
REFERENCES
- 1. Alberola-Ila J, Hernandez-Hoyos G. 2003. The Ras/MAPK cascade and the control of positive selection. Immunol. Rev. 191:79–96 [DOI] [PubMed] [Google Scholar]
- 2. Alegre ML, Frauwirth KA, Thompson CB. 2001. T-cell regulation by CD28 and CTLA-4. Nat. Rev. Immunol. 1:220–228 [DOI] [PubMed] [Google Scholar]
- 3. Aresté C, Blackbourn DJ. 2009. Modulation of the immune system by Kaposi's sarcoma-associated herpesvirus. Trends Microbiol. 17:119–129 [DOI] [PubMed] [Google Scholar]
- 4. Au-Yeung BB, et al. 2009. The structure, regulation, and function of ZAP-70. Immunol. Rev. 228:41–57 [DOI] [PubMed] [Google Scholar]
- 5. Blackbourn DJ, et al. 1997. CD8+ cells from HIV-2-infected baboons control HIV replication. AIDS 11:737–746 [DOI] [PubMed] [Google Scholar]
- 6. Bouvard V, et al. 2009. A review of human carcinogens—part B: biological agents. Lancet Oncol. 10:321–322 [DOI] [PubMed] [Google Scholar]
- 7. Broderick C, et al. 2002. Constitutive retinal CD200 expression regulates resident microglia and activation state of inflammatory cells during experimental autoimmune uveoretinitis. Am. J. Pathol. 161:1669–1677 [DOI] [PMC free article] [PubMed] [Google Scholar]
- 8. Brown KW, Gallimore PH. 1987. Malignant progression of an SV40-transformed human epidermal keratinocyte cell line. Br. J. Cancer 56:545–554 [DOI] [PMC free article] [PubMed] [Google Scholar]
- 9. Cameron CM, Barrett JW, Liu L, Lucas AR, McFadden G. 2005. Myxoma virus M141R expresses a viral CD200 (vOX-2) that is responsible for down-regulation of macrophage and T-cell activation in vivo. J. Virol. 79:6052–6067 [DOI] [PMC free article] [PubMed] [Google Scholar]
- 10. Chang Y, et al. 1994. Identification of herpesvirus-like DNA sequences in AIDS-associated Kaposi's sarcoma. Science 266:1865–1869 [DOI] [PubMed] [Google Scholar]
- 11. Chung YH, Means RE, Choi JK, Lee BS, Jung JU. 2002. Kaposi's sarcoma-associated herpesvirus OX2 glycoprotein activates myeloid-lineage cells to induce inflammatory cytokine production. J. Virol. 76:4688–4698 [DOI] [PMC free article] [PubMed] [Google Scholar]
- 12. Coscoy L, Ganem D. 2000. Kaposi's sarcoma-associated herpesvirus encodes two proteins that block cell surface display of MHC class I chains by enhancing their endocytosis. Proc. Natl. Acad. Sci. U. S. A. 97:8051–8056 [DOI] [PMC free article] [PubMed] [Google Scholar]
- 13. Foster-Cuevas M, Wright GJ, Puklavec MJ, Brown MH, Barclay AN. 2004. Human herpesvirus 8 K14 protein mimics CD200 in down-regulating macrophage activation through CD200 receptor. J. Virol. 78:7667–7676 [DOI] [PMC free article] [PubMed] [Google Scholar]
- 14. Francisco LM, Sage PT, Sharpe AH. 2010. The PD-1 pathway in tolerance and autoimmunity. Immunol. Rev. 236:219–242 [DOI] [PMC free article] [PubMed] [Google Scholar]
- 15. Gorczynski RM, et al. 1999. An immunoadhesin incorporating the molecule OX-2 is a potent immunosuppressant that prolongs allo- and xenograft survival. J. Immunol. 163:1654–1660 [PubMed] [Google Scholar]
- 16. Gorczynski RM, Chen Z, Yu K, Hu J. 2001. CD200 immunoadhesin suppresses collagen-induced arthritis in mice. Clin. Immunol. 101:328–334 [DOI] [PubMed] [Google Scholar]
- 17. Grundhoff A, Ganem D. 2004. Inefficient establishment of KSHV latency suggests an additional role for continued lytic replication in Kaposi sarcoma pathogenesis. J. Clin. Invest. 113:124–136 [DOI] [PMC free article] [PubMed] [Google Scholar]
- 18. Hislop AD, et al. 2007. A CD8+ T cell immune evasion protein specific to Epstein-Barr virus and its close relatives in Old World primates. J. Exp. Med. 204:1863–1873 [DOI] [PMC free article] [PubMed] [Google Scholar]
- 19. Hoek RM, et al. 2000. Down-regulation of the macrophage lineage through interaction with OX2 (CD200). Science 290:1768–1771 [DOI] [PubMed] [Google Scholar]
- 20. Ishido S, Wang C, Lee BS, Cohen GB, Jung JU. 2000. Downregulation of major histocompatibility complex class I molecules by Kaposi's sarcoma-associated herpesvirus K3 and K5 proteins. J. Virol. 74:5300–5309 [DOI] [PMC free article] [PubMed] [Google Scholar]
- 21. Kane LP, Andres PG, Howland KC, Abbas AK, Weiss A. 2001. Akt provides the CD28 costimulatory signal for up-regulation of IL-2 and IFN-gamma but not TH2 cytokines. Nat. Immunol. 2:37–44 [DOI] [PubMed] [Google Scholar]
- 22. Kawasaki BT, Farrar WL. 2008. Cancer stem cells, CD200 and immunoevasion. Trends Immunol. 29:464–468 [DOI] [PubMed] [Google Scholar]
- 23. Koning N, Swaab DF, Hoek RM, Huitinga I. 2009. Distribution of the immune inhibitory molecules CD200 and CD200R in the normal central nervous system and multiple sclerosis lesions suggests neuron-glia and glia-glia interactions. J. Neuropathol. Exp. Neurol. 68:159–167 [DOI] [PubMed] [Google Scholar]
- 24. Kretz-Rommel A, et al. 2007. CD200 expression on tumor cells suppresses antitumor immunity: new approaches to cancer immunotherapy. J. Immunol. 178:5595–5605 [DOI] [PubMed] [Google Scholar]
- 25. Li-Weber M, et al. 2005. Ultraviolet irradiation suppresses T cell activation via blocking TCR-mediated ERK and NF-kappa B signaling pathways. J. Immunol. 175:2132–2143 [DOI] [PubMed] [Google Scholar]
- 26. Mihrshahi R, Brown MH. 2010. Downstream of tyrosine kinase 1 and 2 play opposing roles in CD200 receptor signaling. J. Immunol. 185:7216–7222 [DOI] [PMC free article] [PubMed] [Google Scholar]
- 27. Milligan S, Robinson M, O'Donnell E, Blackbourn DJ. 2004. Inflammatory cytokines inhibit Kaposi's sarcoma-associated herpesvirus lytic gene transcription in in vitro-infected endothelial cells. J. Virol. 78:2591–2596 [DOI] [PMC free article] [PubMed] [Google Scholar]
- 28. Moreaux J, et al. 2006. CD200 is a new prognostic factor in multiple myeloma. Blood 108:4194–4197 [DOI] [PubMed] [Google Scholar]
- 29. Paz PE, et al. 2001. Mapping the Zap-70 phosphorylation sites on LAT (linker for activation of T cells) required for recruitment and activation of signalling proteins in T cells. Biochem. J. 356:461–471 [DOI] [PMC free article] [PubMed] [Google Scholar]
- 30. Qureshi OS, et al. 2011. Trans-endocytosis of CD80 and CD86: a molecular basis for the cell-extrinsic function of CTLA-4. Science 332:600–603 [DOI] [PMC free article] [PubMed] [Google Scholar]
- 31. Renne R, et al. 1996. Lytic growth of Kaposi's sarcoma-associated herpesvirus (human herpesvirus 8) in culture. Nat. Med. 2:342–346 [DOI] [PubMed] [Google Scholar]
- 32. Rezaee SA, Cunningham C, Davison AJ, Blackbourn DJ. 2006. Kaposi's sarcoma-associated herpesvirus immune modulation: an overview. J. Gen. Virol. 87:1781–1804 [DOI] [PubMed] [Google Scholar]
- 33. Rezaee SR, Gracie JA, McInnes IB, Blackbourn DJ. 2005. Inhibition of neutrophil function by the Kaposi's sarcoma-associated herpesvirus vOX2 protein. AIDS 19:1907–1910 [DOI] [PubMed] [Google Scholar]
- 34. Rosenblum MD, et al. 2004. Expression of CD200 on epithelial cells of the murine hair follicle: a role in tissue-specific immune tolerance? J. Invest. Dermatol. 123:880–887 [DOI] [PubMed] [Google Scholar]
- 35. Rubio V, et al. 2003. Ex vivo identification, isolation and analysis of tumor-cytolytic T cells. Nat. Med. 9:1377–1382 [DOI] [PubMed] [Google Scholar]
- 36. Rudd CE. 2008. The reverse stop-signal model for CTLA4 function. Nat. Rev. Immunol. 8:153–160 [DOI] [PubMed] [Google Scholar]
- 37. Salata C, et al. 2009. vOX2 glycoprotein of human herpesvirus 8 modulates human primary macrophages activity. J. Cell. Physiol. 219:698–706 [DOI] [PubMed] [Google Scholar]
- 38. Santos LL, Dacumos A, Yamana J, Sharma L, Morand EF. 2008. Reduced arthritis in MIF deficient mice is associated with reduced T cell activation: down-regulation of ERK MAP kinase phosphorylation. Clin. Exp. Immunol. 152:372–380 [DOI] [PMC free article] [PubMed] [Google Scholar]
- 39. Schneider H, et al. 2006. Reversal of the TCR stop signal by CTLA-4. Science 313:1972–1975 [DOI] [PubMed] [Google Scholar]
- 40. Shiratori I, et al. 2005. Down-regulation of basophil function by human CD200 and human herpesvirus-8 CD200. J. Immunol. 175:4441–4449 [DOI] [PubMed] [Google Scholar]
- 41. Snelgrove RJ, et al. 2008. A critical function for CD200 in lung immune homeostasis and the severity of influenza infection. Nat. Immunol. 9:1074–1083 [DOI] [PubMed] [Google Scholar]
- 42. Steven NM, Leese AM, Annels NE, Lee SP, Rickinson AB. 1996. Epitope focusing in the primary cytotoxic T cell response to Epstein-Barr virus and its relationship to T cell memory. J. Exp. Med. 184:1801–1813 [DOI] [PMC free article] [PubMed] [Google Scholar]
- 43. Stevenson PG, Efstathiou S, Doherty PC, Lehner PJ. 2000. Inhibition of MHC class I-restricted antigen presentation by gamma 2-herpesviruses. Proc. Natl. Acad. Sci. U. S. A. 97:8455–8460 [DOI] [PMC free article] [PubMed] [Google Scholar]
- 44. Sun J, Madan R, Karp CL, Braciale TJ. 2009. Effector T cells control lung inflammation during acute influenza virus infection by producing IL-10. Nat. Med. 15:277–284 [DOI] [PMC free article] [PubMed] [Google Scholar]
- 45. Tivol EA, et al. 1995. Loss of CTLA-4 leads to massive lymphoproliferation and fatal multiorgan tissue destruction, revealing a critical negative regulatory role of CTLA-4. Immunity 3:541–547 [DOI] [PubMed] [Google Scholar]
- 46. Tomescu C, Law WK, Kedes DH. 2003. Surface downregulation of major histocompatibility complex class I, PE-CAM, and ICAM-1 following de novo infection of endothelial cells with Kaposi's sarcoma-associated herpesvirus. J. Virol. 77:9669–9684 [DOI] [PMC free article] [PubMed] [Google Scholar]
- 47. Tonks A, et al. 2007. CD200 as a prognostic factor in acute myeloid leukaemia. Leukemia 21:566–568 [DOI] [PubMed] [Google Scholar]
- 48. Waterhouse P, et al. 1995. Lymphoproliferative disorders with early lethality in mice deficient in Ctla-4. Science 270:985–988 [DOI] [PubMed] [Google Scholar]
- 49. Wright GJ, et al. 2003. Characterization of the CD200 receptor family in mice and humans and their interactions with CD200. J. Immunol. 171:3034–3046 [DOI] [PubMed] [Google Scholar]
- 50. Wright GJ, Jones M, Puklavec MJ, Brown MH, Barclay AN. 2001. The unusual distribution of the neuronal/lymphoid cell surface CD200 (OX2) glycoprotein is conserved in humans. Immunology 102:173–179 [DOI] [PMC free article] [PubMed] [Google Scholar]
- 51. Xiao Z, Mescher MF, Jameson SC. 2007. Detuning CD8 T cells: down-regulation of CD8 expression, tetramer binding, and response during CTL activation. J. Exp. Med. 204:2667–2677 [DOI] [PMC free article] [PubMed] [Google Scholar]
- 52. Zelinskyy G, et al. 2009. The regulatory T-cell response during acute retroviral infection is locally defined and controls the magnitude and duration of the virus-specific cytotoxic T-cell response. Blood 114:3199–3207 [DOI] [PubMed] [Google Scholar]
- 53. Zhang S, Cherwinski H, Sedgwick JD, Phillips JH. 2004. Molecular mechanisms of CD200 inhibition of mast cell activation. J. Immunol. 173:6786–6793 [DOI] [PubMed] [Google Scholar]
- 54. Zuo J, et al. 2009. The Epstein-Barr virus G-protein-coupled receptor contributes to immune evasion by targeting MHC class I molecules for degradation. PLoS Pathog. 5:e1000255. [DOI] [PMC free article] [PubMed] [Google Scholar]