

Abstract
Viral pneumonia has been frequently reported during early stages of influenza virus pandemics and in many human cases of highly pathogenic avian influenza (HPAI) H5N1 virus infection. To better understand the pathogenesis of this disease, we produced nonlethal viral pneumonia in rhesus macaques by using an HPAI H5N1 virus (A/Anhui/2/2005; referred to as Anhui/2). Infected macaques were monitored for 14 days, and tissue samples were collected at 6 time points for virologic, histopathologic, and transcriptomic analyses. Anhui/2 efficiently replicated in the lung from 12 h to 3 days postinfection (p.i.) and caused temporal but severe pneumonia that began to resolve by day 14. Lung transcriptional changes were first observed at 6 h, and increased expression of vascular permeability regulators and neutrophil chemoattractants correlated with increased serum leakage and neutrophil infiltration in situ. Additional inflammatory, antiviral, and apoptotic genes were upregulated from 12 h, concurrent with viral antigen detection and increasing immune cell populations. A shift toward upregulation of acquired immunity was apparent after day 6. Expression levels of established immune cell molecular markers revealed remarkable similarity with pathological findings, indicating early and robust neutrophil infiltration, a slight delay in macrophage accumulation, and abundant late populations of T lymphocytes. We also characterized the putative mechanisms regulating a unique, pneumonia-associated biphasic fever pattern. Thus, this study is the first to use a comprehensive and integrative approach to delineate specific molecular mechanisms regulating influenza virus-induced pneumonia in nonhuman primates, an important first step toward better management of human influenza virus disease.
INTRODUCTION
In the last 100 years, four influenza virus pandemics have occurred in humans, resulting in widespread disease and severe loss of life. These include the 1918 Spanish influenza virus (H1N1; estimated 50 million deaths), 1957 Asian influenza virus (H2N2; estimated 2 million deaths), 1968 Hong Kong influenza virus (H3N2; estimated 1 million deaths), and most recently the 2009 swine-derived H1N1 influenza virus, which is responsible for more than 18,000 deaths to date (50, 53). In addition, since 1997, increasing numbers of humans have been infected with highly pathogenic avian influenza (HPAI) H5N1 viruses, with mortality occurring in nearly 60% of confirmed cases (51). Continued circulation and evolution of HPAI H5N1 viruses in wild birds and poultry populations, combined with sporadic human infections, makes the possibility of an HPAI H5N1 pandemic both tangible and alarming. To better prepare for future influenza virus pandemics and develop more effective prevention and intervention methods, a comprehensive understanding of virus-induced disease pathology is necessary.
One mutual feature of pandemic and HPAI H5N1 viruses is their ability to induce pure viral pneumonia in humans, a complication that is only rarely observed with seasonal influenza virus infections. Historical records indicate that humans suffered from viral pneumonia in the early phases of past pandemics more commonly than humans infected with seasonal viruses (21). Some patients infected with the 2009 pandemic H1N1 virus developed viral pneumonia characterized by severe alveolar damage (5, 13, 40, 48). Moreover, severe viral pneumonia is the most common complication of HPAI H5N1 virus infections and is a contributing factor in HPAI H5N1-induced mortality (4, 6, 12, 23, 38, 55). Influenza viruses with the potential to cause viral pneumonia in humans can establish infection in the lungs of mammalian models (i.e., mice, ferrets, and nonhuman primates [NHP]) (20, 24, 42, 49, 57), and studies in these models have yielded important discoveries about viral pathogenicity determinants and key host response events contributing to pathogenic mechanisms (2, 3, 9, 11, 17, 26, 30). However, the available data do not permit a complete understanding of the course of viral pneumonia, from the initial exposure phase through recovery. We therefore first established a rhesus macaque model of nonlethal influenza virus pneumonia using an HPAI H5N1 virus and then studied the host response at the clinical, cellular, and molecular levels to create an integrative portrait of pneumonia-induced pathogenesis. Our results facilitated the discovery of key differences between sublethal and lethal influenza virus pneumonia and further identified key host response mechanisms regulating early inflammatory cell lung infiltration and fever.
MATERIALS AND METHODS
Cells and virus.
Madin-Darby canine kidney (MDCK) cells were maintained in minimal essential medium (MEM) containing 5% newborn calf serum at 37°C in 5% CO2. Influenza A/Anhui/2/2005 (H5N1; referred to as Anhui/2), a clade 2.3 HPAI virus, was isolated from the bronchial secretions of a patient with a fatal outcome in the Anhui province in China in 2005 (15, 33, 44, 54). Virus stocks were prepared in MDCK cells and titers were determined using the 50% egg infectious dose (EID50) method (41).
Macaque infection.
Thirteen colony-bred male or female rhesus macaques (Macaca mulatta), 2.5 to 3.5 years old and ranging in weight from 2.8 to 4.4 kg, were used for experiments described here. Twelve macaques were individually placed under negative pressure and were infected intratracheally with 107 EID50 of Anhui/2 in 4 ml of phosphate-buffered saline (PBS). At 6 h, 12 h, 1 day, 3 days, 6 days, and 14 days postinfection (p.i.), two animals per time point were euthanized under anesthesia and necropsies were performed. Tissue samples were collected from oro/nasopharynx, lungs, bronchi, trachea, brain (cerebellum, cerebrum, and brain stems were collected separately), tonsils, liver, spleen, kidneys, heart, and colon and were either (i) stored at −80°C for virus titration, (ii) fixed in 10% neutral-buffered formalin for histological analysis and immunohistochemistry, or (iii) stored in RNAlater (Ambion, Austin, TX) at −80°C for RNA analyses. For all surviving animals at each time point, clinical symptoms (e.g., loss of appetite and lethargy) were monitored twice daily, body temperatures (TB) were recorded daily, and whole-blood samples (2 ml) were collected from the basilic vein (using K2 EDTA venous blood collection tubes; BD, Franklin Lakes, NJ) on days 0, 2, 3, 4, 6, 9, 12, and 14 p.i. The remaining macaque (mock infected) was inoculated with 4 ml of PBS intratracheally and euthanized at 6 h p.i. Lung tissues from the mock-infected animal were collected and stored as just described.
Hematology and detection of influenza virus-specific antibodies.
Analysis of peripheral blood hematology was conducted using a Cell-dyn 1200 analyzer (Abbott Laboratories, IL). For detection of influenza virus-specific antibodies, serum samples collected from macaque 11 (M11) and M12 (both euthanized on day 14) were pretreated with receptor-destroying enzyme (to eliminate inhibitors of hemagglutination) and assayed by either hemagglutination inhibition or serum neutralization tests.
Virus titration.
Tissue samples were thawed, weighed, and homogenized in 1 ml PBS (containing 1,000 units/ml penicillin and 1,000 μg/ml streptomycin) using a TissueLyser II homogenizer (Qiagen, Germany; 25 Hz for 5 min). Resultant homogenates were centrifuged at 2,000 rpm for 10 min, and then 10-fold serial dilutions of the suspensions were inoculated into 10-day-old embryonated chicken eggs for virus titration. Virus titers were calculated by the method of Reed and Muench (41).
Bacterial isolation and pathogenicity analysis.
Lung tissues were homogenized in PBS (0.1g/ml), and 100 μl was inoculated onto blood agar plates. After 48 h of incubation at 37°C under aerobic conditions, typical colonies were picked and amplified in Luria-Bertani broth. Subsequently, 6-week-old BALB/c mice were intraperitoneally inoculated with 100 μl of the amplified bacteria and were monitored by mortality and body weight loss over 14 days. Bacterial species were identified by 16S rRNA sequencing.
Pathological analysis.
Tissue samples preserved in 10% neutral-buffered formalin were processed for routine paraffin embedding. Five-microliter sections were stained with hematoxylin and eosin, and additional sections were cut for immunohistological staining with rabbit polyclonal antiserum against an H5N1 virus (A/Vietnam/1203/04). Specific antigen-antibody reactions were visualized by using the Dako EnVision system, with 3,3′ diaminobenzidine tetrahydrochloride (Dako Japan Inc., Tokyo, Japan).
qPCR.
cDNA was generated for equal amounts of total RNA from infected macaque lungs using the QuantiTect reverse transcription (RT) kit (Qiagen Inc., Valencia, CA), and the levels of hemagglutinin subtype 5 (H5 HA) and matrix (M) gene viral RNAs were determined by quantitative real-time reverse transcriptase PCR (qPCR) using an ABI 7500 PCR system and TaqMan chemistry (Applied Biosystems, Foster City, CA). Differences in gene expression were represented as log10 relative quantity (RQ), relative to a calibrator and normalized to a reference, using the 2−ΔΔCT method (35). Primer sequences are available upon request.
Microarray analysis.
Total RNA was extracted from lung tissues using an RNeasy minikit (Qiagen, Hilden, Germany), and equal amounts of RNA were subjected to amplification with the low RNA input linear amplification kit (Agilent Technologies, Santa Clara, CA), according to the manufacturer's recommendations. Probe labeling and microarray slide hybridization were performed as described elsewhere (27), using custom rhesus macaque oligonucleotide microarrays containing 22,000 probes corresponding to 18,000 unique genes (Agilent Technologies). Individual microarrays were performed for each infected lung tissue sample, and for comparison, three separate samples from the same mock-infected lung were pooled prior to microarray analysis. Slides were scanned with an Agilent DNA microarray scanner, and image data were processed using Agilent Feature Extractor version 8.1.1.1. Raw data were imported into a custom-designed laboratory information management system and then into Rosetta Resolver 7.2 (Rosetta Biosoftware, Seattle, WA) for subsequent analysis. Gene expression changes after infection were determined by comparing probe intensity values from infected lung tissues with that of the pooled mock-infected tissue, using the Rosetta Resolver 7.2 software. Primary gene expression data are available at http://viromics.washington.edu and are in accordance with proposed MIAME standards.
Cluster analysis.
Correlated temporal gene expression pattern groups (i.e., “clusters”) were identified from differentially expressed genes (defined as having an absolute log10 fold change of 0.3) by hierarchical clustering according to Eisen's method (14). Gene clusters were further analyzed for representative functions using Gene Ontology (GO) (http://www.geneontology.org/), and we required a P value of 0.01 for identification of significant molecular function (MF), biological process (BP), or cellular component (CC) GO annotations. Molecular network analysis was conducted using KeyMolnet Lite (IMMD Inc., Tokyo, Japan).
Assessment of cytokine and chemokine protein levels in serum and lung tissues.
Cytokine and chemokine concentrations in serum and lungs were determined using the MILLIPLEX MAP nonhuman primate cytokine magnetic bead panel kit (Millipore, Billerica, MA) and a Luminex detection system (Luminex Corporation, TX), according to the manufacturer's instructions. For this, lung tissues were prepared by homogenization in PBS (1 g tissue per 2 ml PBS) followed by centrifugation (300 × g for 10 min). Resultant supernatants were irradiated with UV light by using a CL-100 UV cross-linker (UVP, Inc., Upland, CA) for 10 min (6 × 10⁵ μJ/cm2) to inactivate the virus. Supernatant protein concentrations were then determined using a Pierce bicinchoninic acid (BCA) protein assay kit (Thermo Fisher Scientific Inc., MA), and supernatants were diluted with the assay diluent to a final protein concentration of 5,000 μg/ml.
Biosafety and ethical statements.
All experiments using the Anhui/2 virus were performed in a biosafety level 3+ containment laboratory, approved by the Chinese Ministry of Agriculture, in Harbin Veterinary Research Institute in China. All animal studies were approved by the Review Board of Harbin Veterinary Research Institute, Chinese Academy of Agricultural Sciences.
RESULTS
Rhesus macaques infected with influenza A/Anhui/2/2005 (H5N1) display symptoms consistent with sublethal viral pneumonia.
We are interested in developing a comprehensive in vivo model of influenza virus pathogenesis, from the initial stage following infection through recovery. Toward this end, we infected rhesus macaques with influenza A/Anhui/2/2005 (H5N1; referred to as Anhui/2) to induce viral pneumonia. Following inoculation, body temperatures (TB) and peripheral blood hematological profiles were monitored over a 14-day time course, and we also collected upper and lower respiratory tissues for virus titration and detailed histopathological and microarray analyses at 6 h, 12 h, 1 d, 3 days, 6 days, and 14 days postinfection (p.i.).
TB measured 24 h before the start of the experiment revealed a range of values among the macaque cohort (Fig. 1A). However, infected animals exhibited a uniform spike in TB (i.e., fever) at 1 to 2 days p.i., a subsequent retraction in TB, and a second fever at days 5 to 6 p.i. (Fig. 1A). Following the second fever, macaque TB decreased and returned to a level similar to initial measurements by 14 days p.i. Apparently coinciding with increased TB, lymphopenia occurred at days 2 and 6 p.i. (Fig. 1B; see also Table S1 in the supplemental material). Lymphopenia has been observed in cynomolgus macaques infected with influenza virus (2); however, the biphasic fever pattern has not been described in any other influenza virus infection model. Additional hematological analyses indicated early (2-day) and late (12-day) peripheral granulocytosis and increased platelet numbers on days 9 and 12 p.i. (see Table S1), while serum neutralization and hemagglutination inhibition assays indicated the production of influenza virus-specific antibodies by day 12 (Fig. 2). Most macaques infected with Anhui/2 exhibited some loss of appetite and/or reduced mental status through day 6 p.i. (data not shown), but no animals died over the course of the experiment. These observations indicated that Anhui/2 efficiently induced clinical disease in infected macaques and further implied that disease began to resolve by 14 days p.i.
Fig 1.
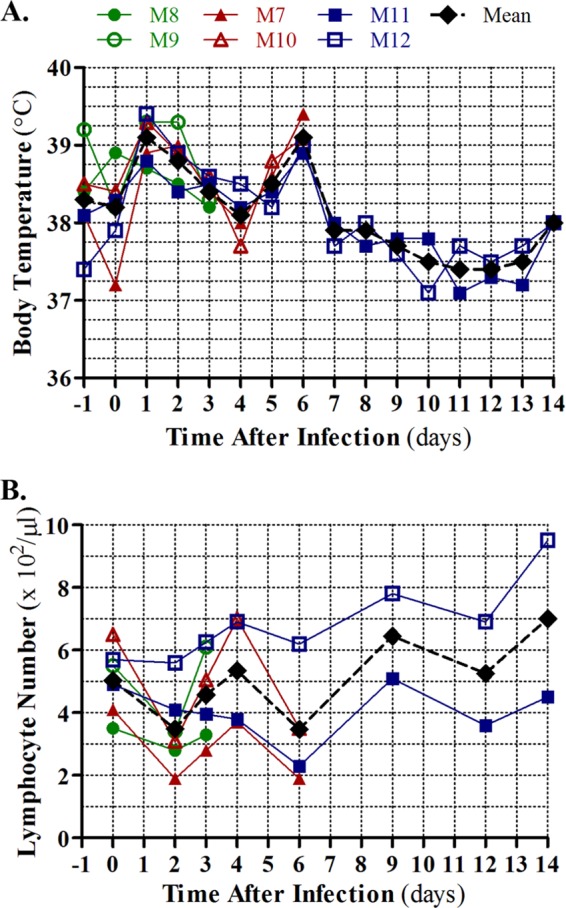
Clinical symptoms in Anhui/2-infected rhesus macaques. (A) Body temperatures (TB) of rhesus macaques infected with Anhui/2 were monitored every day from 1 day prior to infection to 14 days after infection. (B) Blood was collected from the same six macaques shown in panel A at the time points indicated in panel B, and total peripheral lymphocytes were quantified. A key for the colors and shapes depicting TB curves and lymphocyte numbers of specific macaques (indicated by M7, M8, M11, etc.) is shown above the TB plot. A mean TB and peripheral lymphocyte value for all surviving animals at each time point is shown in black.
Fig 2.
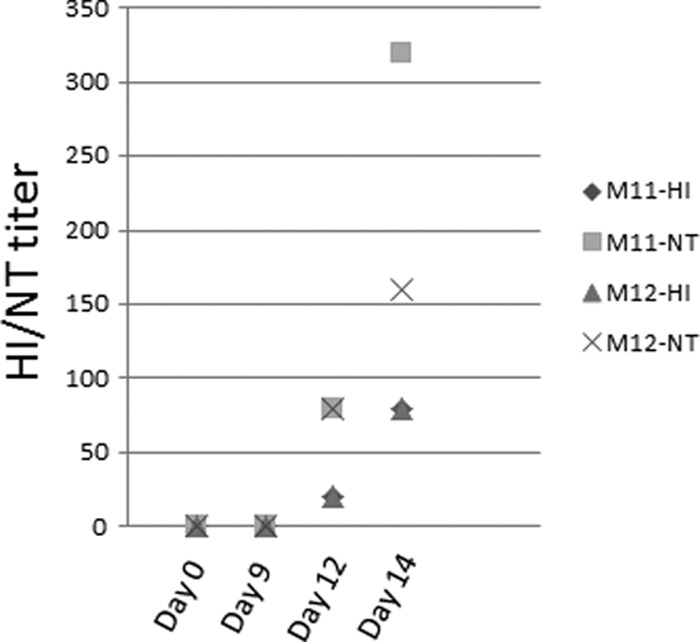
Serum antibody titers. At days 0, 9, 12, and 14 p.i., serum from two macaques (no. M11 and M12) was assayed for hemagglutination inhibition antibody titer (HI) and neutralization antibody titer (NT).
Virus was isolated from respiratory tissues (i.e., trachea, bronchus, and lung) from 6 h through 6 days p.i. but could not be detected in any of these tissues on day 14 p.i. (Table 1). In general, replication was efficient both in the upper respiratory tract (trachea and bronchus) and in all lobes of the lung, and virus titers peaked from 12 to 24 h p.i. The highest viral load was carried in the lungs (relative to other respiratory tissues), where titers reached 6.8 log10 50% egg infectious dose (EID50)/ml. No virus could be detected at any time points in any other tissues (i.e., heart, spleen, kidneys, liver, colon, brain, or blood) except for tonsils, where low virus titers were observed only on day 14 p.i. (M11, 4.0 log10 EID50/ml; M12, 3.25 log10 EID50/ml). Therefore, Anhui/2 replicates primarily in respiratory tissues, especially in the lungs, of rhesus macaques and does not undergo viremia or become disseminated to extrarespiratory sites other than the tonsils.
Table 1.
Virus titers in respiratory tissues
| Time | Animal | Virus titerb |
||||||||
|---|---|---|---|---|---|---|---|---|---|---|
| Trachea | Bronchus |
Right lung |
Left lung |
|||||||
| Right | Left | Upper | Middle | Lower | Upper | Middle | Lower | |||
| 6 h | M0a | <c | < | < | < | < | < | < | < | < |
| M1 | 3.55 | 5.8 | ND | 3.5 | 3.5 | 5.5 | < | 1.5 | 2.5 | |
| M2 | 2.8 | < | 3.05 | 3.5 | 2.75 | 3.75 | 5.25 | 4.5 | 4.75 | |
| 12 h | M3 | 4.05 | < | 4.8 | 5.5 | 6.5 | 6.5 | 6.75 | 6.5 | 6.5 |
| M4 | 4.55 | 5.05 | 5.55 | 5.75 | 5.5 | 5.5 | 4.5 | 4.75 | 5.25 | |
| 24 h | M5 | 4.05 | 4.55 | 4.8 | 6.5 | 6 | 6.75 | 5.25 | 5.5 | 5.75 |
| M6 | 1.8 | 4.8 | 4.05 | 1.98 | 1.5 | 4.5 | 4.5 | 6 | 6.5 | |
| 3 days | M8 | 2.5 | 4.63 | < | 5.55 | 2.46 | 3.23 | 5.3 | 3.8 | 4.8 |
| M9 | 2.98 | < | 2.98 | 1.28 | < | 1.28 | 3.8 | 1.5 | 4.3 | |
| 6 days | M7 | 4.05 | 2.98 | 2.98 | 2.8 | 4.8 | 3.98 | 2.28 | < | < |
| M10 | 3.98 | 4.05 | 3.73 | 4.05 | 2.8 | 3.55 | 3.55 | 3.55 | 3.55 | |
| 14 days | M11 | < | < | < | < | < | < | < | < | < |
| M12 | < | < | < | < | < | < | < | < | < | |
M0 was a mock-infected animal.
log10 EID50/ml.
<, not detected; ND, not determined.
It is well established that influenza virus infection predisposes infected individuals to bacterial superinfection by multiple species (e.g., Staphylococcus aureus, Haemophilus influenzae, Streptococcus species), and this can cause combined viral/bacterial pneumonia or postviral pneumonia (47). To exclude this possibility in our model, we examined six lung tissue samples (3 from the right lung and 3 from the left lung) from each macaque for the presence of pathogenic bacterial species. We did not isolate any of the typical influenza virus-associated bacteria and rather found the sporadic presence of Lactobacillus salivarius, Pseudomonas species, and Streptococcus viridans, with L. salivarius the most frequently identified (see Fig. S1 in the supplemental material). When each of these bacterial isolates—derived from the macaque lung tissues—was inoculated into mice, no pathogenic phenotype could be observed (data not shown). Thus, viral replication in the lungs in the absence of complicating bacterial coinfection, combined with the observed clinical symptoms (fever, lethargy, and lymphopenia), suggested that Anhui/2 could induce sublethal viral pneumonia in rhesus macaques.
Comprehensive pathological evaluation of Anhui/2-induced pneumonia in rhesus macaques.
To understand the kinetics of the host response and pathogenesis associated with Anhui/2 infections, we performed a systematic histopathological examination of infected lung tissues over the 14-day time course. Specific features of this analysis are described below, and we also show a graphical summary of microscopic findings for each time point in Fig. 3.
Fig 3.

Pathological findings. At 6 h (A), 12 h (B), 1 day (C), 3 days (D), 6 days (E), and 14 days (F) p.i., macaque lungs were examined at both the gross level and microscopically using hematoxylin and eosin (H&E) staining and immunohistochemical (IHC) detection of influenza virus antigens. In panels A and D to F, photographs of macaque lungs are shown in panel i, with gross lesions indicated by black arrowheads. Panel ii shows H&E (A, C to F) or IHC (B to D) of selected bronchiole and alveolar regions. “Alv” refers to alveolus, “Br” refers to bronchioles, “ConsD” refers to consolidation, “Ed” refers to edema, and “LF” refers to lymph follicle. In panel Bii, the inset is an enlarged image of the antigen staining indicated by the arrow. In panels Cii and Dii, the inset shows viral antigen staining in alveolus. For all time points (A to F), a graphical summary of pathological observations is shown in panel iii. Specific anatomical features are described in panel Aiii, and a cell type key is shown at the top of the figure. Viral antigen is indicated by red highlights.
Despite the lack of gross pneumonic lesions at 6 h p.i. (Fig. 3Ai), we observed minor biological reactions at the microscopic level. Specifically, there was evidence for neutrophilic bronchiolitis; bronchiolar coinfiltration of a small number of eosinophils, macrophages, and lymphocytes; and a low level of serum leakage (Fig. 3Aii and iii). We also observed eosinophilic bronchitis and perivascular infiltration of eosinophils (Fig. 3Aiii). These observations provide clear evidence of an early, nonspecific inflammatory response, dominated by neutrophils, and it is notable that this occurred in the absence of detectable viral antigen (Fig. 3Aiii). It seems likely that viral recognition by initial target cells results in the rapid production of factors that promote recruitment of various leukocytes into the bronchioles. Indeed, the early bronchiolar inflammatory influx suggests that this is the primary site of virus replication.
At 12 h p.i., significant viral antigen expression occurred in type II pneumocytes, Clara cells, and a few bronchial epithelial cells (Fig. 3Bii). Most of the infected cells were near bronchiole-alveolar junctions, in the same regions where inflammatory infiltrates were initially observed at 6 h p.i. In addition to bronchiolitis, we observed lymphocyte recruitment from bronchiole-associated lymphoid tissue and margination of leukocytes in the vasculature (Fig. 3Biii). By 24 h p.i., the inflammatory reaction increased. Besides the histological findings from the previous time point, we also observed prominent accumulation of neutrophils and macrophages with apoptotic cell debris in the bronchial lumen (Fig. 3Cii and iii). At this time point, antigen-positive cells were present not only in bronchiole-alveolar junctions but also in the peribronchiolar alveolus (Fig. 3Cii), and viral antigen was detected in both type II (Fig. 3Cii, arrowhead) and type I (Fig. 3Cii, arrow) pneumocytes. Prominent detection of viral antigens in multiple cell types between 12 and 24 h p.i. indicates efficient early viral replication and is consistent with the abundant levels of virus isolated from infected lungs at the same time points (Table 1). In addition, it is likely that increased apoptosis and inflammatory cell infiltrates are a direct consequence of the high levels of virus replication.
On day 3 p.i., significant gross pneumonic lesions were observed, roughly more proximal than distal to the trachea and bronchi (Fig. 3Di). At this time, peribronchiolar alveolitis and lung edema were significant (Fig. 3Dii), viral antigens were prominently observed (only in type I pneumocytes) in the alveolus (Fig. 3Dii, inset), and mitotic alveolar cells were scattered in the lesion (Fig. 3Diii). No leukocyte margination in the vasculature occurred. Gross lesions continued to be apparent at 6 days p.i. (Fig. 3Ei), and most of the alveolar spaces were filled with edema fluid, macrophages, lymphocytes, neutrophils, and cell debris from apoptotic cells (Fig. 3Eii). Some consolidation was apparent in the peribronchiolar alveolus (Fig. 3Eii), and scant viral antigens persisted only in alveolar type I pneumocytes (Fig. 3Eiii). Simultaneously, mitotic epithelial cells were frequently observed, and peribronchial lymph follicles were enlarged (Fig. 3Eiii).
Although gross pneumonic lesions were still observed on day 14 p.i., they were partially cicatrical in appearance (Fig. 3Fi), indicating that some tissue healing processes had occurred. Parts of the lung contained consolidated alveolus infiltrated by macrophages, lymphocytes, and plasma cells in the absence of viral antigen; overall, the presence of edema was negligible (Fig. 3Fii and iii). Additional observations included thickening of the alveolar walls, infiltration of foamy macrophages, and enlarged peribronchial lymph follicles containing many mitotic cells (Fig. 3Fii and iii).
All together, these pathological findings indicated that rhesus macaques exposed to Anhui/2 were actively infected and showed progressive pneumonia until 3 days p.i. Anhui/2 initially targeted cells at the boundary between the bronchioles and the alveolus, and inflammatory infiltrates were first observed in this region at 6 h p.i., in the absence of viral antigen detection. Subsequently, prominent viral replication and spread into the alveoli resulted in increasing immune cell infiltration and inflammation of the peribronchiolar-alveolar regions. By day 6 postinfection, Anhui/2-induced pneumonia began to regress, concurrent with diminished viral replication and the appearance of some signs of immune response resolution. Finally, by 14 days p.i., while some immune cells were retained in the infected regions of the lung, evidence of regeneration was prominent.
Dynamic global host transcriptional response of Anhui/2-infected rhesus macaque lung.
To gain a more detailed understanding of the host response to Anhui/2 infection, we next analyzed total RNA from lung tissues from two rhesus macaques for each time point using microarrays. Somewhat unexpectedly, there was significant variation in the global gene expression profiles for samples collected from the same time point. This was likely a result of localized differences in virus levels, since variation in host gene expression directly correlated with viral RNA load (HA and M1) in the same samples (see Fig. S2 in the supplemental material). Therefore, for further analysis, we selected individual samples containing sufficient viral RNA levels to serve as a representative for each time point (see Fig. S2, arrows). Differentially expressed (DE) genes (defined as those exhibiting a ±2-fold change relative to the mock-infected control) were first observed at 6 h p.i. (1,894 genes), peaked at 3 days p.i. (5,235 genes), and exhibited a reduction at the remaining time points (see Fig. S3 in the supplemental material). The increasing level of differential gene expression between 6 h and 3 days p.i. is consistent with increasing immune cell infiltrates and inflammation (Fig. 3A to D), and the subsequent regression in the amount of DE genes (e.g., 2,822 DE genes at 14 days p.i.) occurred in parallel with reduced inflammation (Fig. 3). In total, these data implied that microarray analysis of lung tissue generally reflected the host response over the infection time course, as described in detail in the histopathological examination (Fig. 3).
To acquire more specific insight into the host response to Anhui/2 in rhesus macaque lung, we next used hierarchical clustering to identify groups of differentially expressed genes (≥2-fold change relative to mock) exhibiting similar global expression profiles (referred to as “wave patterns”). We reasoned that gene clusters exhibiting wave patterns that correlated with specific pathological events may also have functions related to those events. We detected 16 unique clusters, and the function of each cluster was interrogated by Gene Ontology (GO) analysis. The average gene expression pattern for each cluster is shown in Fig. 4, along with representative GO annotations. Additionally, all significant (P < 0.01) GO biological processes, molecular functions, and cellular components—as well as the genes mapping to each annotation—for each cluster are included in Table S2 in the supplemental material.
Fig 4.

Wave pattern clusters of the global transcriptional response in Anhui/2-infected macaques. Total RNA isolated from macaque lung lesions at all six time points shown in Fig. 3 was subjected to microarray analysis. Hierarchical clustering was used to group the transcriptional response into “wave pattern clusters” exhibiting the same temporal gene expression patterns. Only genes that exhibited differential expression of ±0.3 log10 (approximately 2-fold change) relative to the mock-infected control in at least one time point were subjected to this analysis. Sixteen clusters were identified, and these were further analyzed for enriched GO categories. For each cluster, we show the average gene expression curve, with the cluster number (e.g., C12) in the lower left corner of the panel and the number of genes per cluster in the upper center area. Selected GO annotations are shown beneath each cluster, and all significant annotations (P < 0.01) are included in Table S1 in the supplemental material. The time points in which the first response was observed are indicated on the left.
Four wave pattern clusters (4, 11, 15, and 16) exhibited increased gene expression at 6 h p.i., and GO analysis revealed enriched annotations for cytokine receptor activity (e.g., IL1R1, IL1R2, IL7R, IL6ST, IL8RA, IL8RB) as well as a few cytokines and antiviral molecules (e.g., IL28A/B, interleukin 29 [IL-29], IL-9, PF4, and RSAD2/viperin) (Fig. 4; see Table S2 in the supplemental material). We also observed upregulation of genes involved in nitric oxide synthesis (e.g., NOS3) and the regulation of vascular permeability (e.g., LTB4R, VEGFC, FLT1, KDR) (see Table S2). These observations indicated that early host differential expression was dominated by genes involved in the initiation of the inflammatory response and further supported our earlier assertion that initial viral recognition events signal the expression of factors that promote leukocyte recruitment.
At intermediate time points (12 h to 3 days), the innate inflammatory response was clearly enhanced, as demonstrated by the continued addition of GO annotations related to this process. Several wave pattern clusters showed strong reactions at 12 h p.i. (2, 8, 9, and 10), and all except for cluster 8 were upregulated (Fig. 4). Cluster 9, which exhibited upregulation that peaked at 12 h p.i., was dominated by cytokine genes involved in regulating the functions of a wide array of immune cell types (e.g., TNFSF10/18, IL-15, CCL20, IFNA2/4/8/21, IFNB1, IL1A, IL12A, CCL15/20, IL-13, PPBP, and CXCL14) (see Table S2 in the supplemental material). Clusters 2 and 3, both exhibiting sustained upregulation starting from 12 to 24 h, contained additional cytokine genes and a signature for GO processes related to antiviral signaling functions (e.g., STAT2, TLR3, MYD88, DDX58, and ZC3HAV1/ZAP) and apoptosis (e.g., CASP1, PML, and TNFRSF10B). CCL4, in cluster 6, is a chemokine involved in the recruitment of monocyte/macrophages and lymphocytes (37), and PPBP and PF4 (in cluster 9) have potent chemoattractant activity directed toward neutrophils (1, 18, 43). This is consistent with our pathological findings, which indicated the influx of multiple immune cell types, but especially neutrophils, in the early phase (Fig. 3A). Moreover, these observations are consistent with abundant viral replication in the lung at 12 to 24 h (Table 1) and increasing levels of immune infiltrates and apoptotic debris observed through 3 days (Fig. 3B to D). In conjunction with the upregulated inflammatory, antiviral, and apoptosis genes during this phase, we also observed downregulation of genes involved in the negative regulation of the inflammatory response (cluster 8) (Fig. 4; see also Table S2).
A shift toward upregulation of genes involved in acquired immunity was observed after day 6 p.i. (Fig. 4; see also Table S2 in the supplemental material). Cluster 3—containing genes involved in T cell activation—started to increase gradually from 12 h p.i., peaked at 24 and 6 days p.i., and decreased on day 14 p.i. Additional genes involved in T cell differentiation (e.g., CD28, CD2, ZAP70, and IL-2) and isotype switching (e.g., gamma interferon (IFNG), IL27RA, and IL-2) peaked at 6 days p.i. (cluster 7). Interestingly, cluster 1 was heavily enriched for GO annotations related to mitosis, consistent with our observation of mitotic cells in alveoli on days 3 and 6 p.i. (Fig. 3D and E). While the exact proliferating cell type cannot be determined based on these data, we suggest that the abundant, late expression of mitosis-related genes, combined with parallel upregulation of adaptive immune processes related to T cells, points toward a mitotic T lymphocyte population in the alveolus during the late stage of infection. Immune cell process GO annotations were limited among genes that exhibited upregulation primarily at day 14 p.i. (cluster 14). However, this cluster was enriched for antigen processing and presentation, consistent with host recovery from disease at this time point (Fig. 4; see also Table S2).
In sum, the wave pattern analysis is consistent with histopathological findings, and together, these data suggest that Anhui/2-induced pneumonia occurs in three general phases: phase 1 (6 h), where virus exposure induces activation of proinflammatory and chemokine molecules, leading to recruitment of inflammatory cells in the absence of viral antigen expression; phase 2 (12 h to 3 days), where increasing expression of inflammatory, antiviral, and apoptotic genes occurs concomitantly with abundant viral antigen detection, substantial immune cell infiltration, and cellular apoptosis; and phase 3 (6 to 14 days), where adaptive immune cells, antigen presentation, and regenerative processes predominate.
Lung-specific and systemic cytokine and chemokine protein expression patterns during Anhui/2-induced pneumonia.
To complement the histopathological and microarray analyses of Anhui/2-infected lung, we next assessed protein levels of a panel of 10 major inflammatory cytokines and chemokines in both homogenates of infected lung tissues and peripheral blood (Fig. 5). IL1B, IL-6, IL-8, MCP-1/CCL2, and tumor necrosis factor (TNF) exhibited the earliest consistent upregulation in the lung (at 12 to 24 h), and we also observed moderately increased levels of IFNG at these time points (Fig. 5A). Interestingly, while IL-6 and IL-8 lung expression was acute and restricted to early time points, MCP-1/CCL2 and IL1B were continuously detected through 6 days, and TNF and IFNG exhibited a biphasic upregulation pattern (12 to 24 h and 6 days). When considered with histopathological findings, it seems likely that early increases in cytokine and chemokine levels result from the innate response of epithelial cells and macrophages stimulated by virus infection, while later peaks in TNF and IFNG are related to processes associated with adaptive immunity. Systemically, inflammatory molecules tended to be upregulated in a biphasic pattern (at 1 to 2 days and at 6 days) (Fig. 5B), coinciding with the biphasic fever pattern (Fig. 1A). By day 14 p.i., cytokines and chemokines in both lung and peripheral blood were mostly below the limit of detection (Fig. 5A and B). These results reflect the three phase pattern of the host response to Anhui/2-induced pneumonia and suggest that multiple cytokines and chemokines contribute to both tissue-localized (i.e., lung) and systemic effects of Anhui/2-associated inflammation.
Fig 5.

Lung-specific and systemic cytokine and chemokine protein expression patterns. Protein levels of a panel of 10 major inflammatory cytokines and chemokines were measured for lung (A) or serum (B), using a MILLIPLEX magnetic bead array. (A) Lung tissues collected at 6 h, 12 h, 1 days, 3 days, 6 days, and 14 days p.i. (two macaques per time point, see Table 1), as well as four lung tissue samples from the same mock-infected control macaque, were homogenized in PBS, and resultant supernatants containing equal protein concentrations were subjected to the bead array assay. (B) Serum samples were tested for the following macaques and time points: 0 h (M11 and M12), 6 h (M1 and M2), 12 h (M3 and M4), 24 h (M5 and M6), 2 days (M11 and M12), 3 days (M8 and M9), 4 days (M11 and M12), 6 days (M11 and M12), 9 days (M11 and M12), 12 days (M11 and M12), and 14 days (M11 and M12). For both panels A and B, cytokine/chemokine concentrations (pg/ml) for individual macaques are indicated by differentially shaded gray bars at each time point, and the specific molecule measured is shown at the top of each panel.
Time-dependent recruitment patterns for specific immune cell subtypes during Anhui/2-induced pneumonia.
To establish a more precise timeline for pulmonary recruitment of specific immune cell subtypes, whose presence is likely to impact both the progression and regression of influenza virus-induced pneumonia, we next analyzed gene expression patterns of transcripts known to be expressed by certain immune cell subtypes (Fig. 6).
Fig 6.
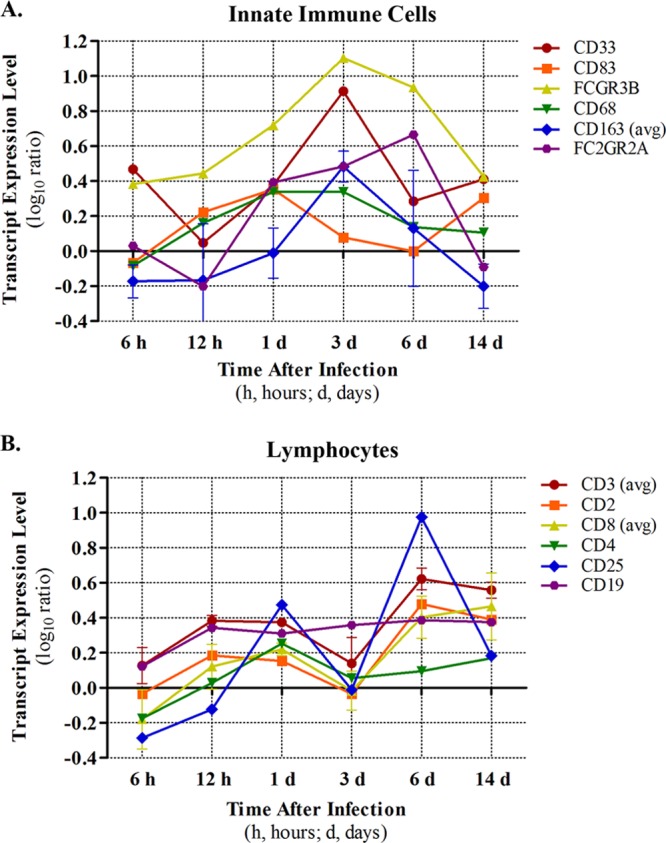
Estimation of temporal immune cell recruitment. Recruitment of inflammatory cells was estimated by expression levels of cell type-specific transcripts in the lung. Nonspecific immune cell markers are shown in panel A, and lymphocyte markers are shown in panel B. For some transcripts, average values were reported (indicated by “avg”) in cases where more than one transcript was available for a particular gene. Variation is indicated by ±standard deviation.
Consistent with our histopathological examination, which indicated neutrophilic bronchiolitis at 6 h p.i., and the upregulation of both PF4 and PPBP (neutrophil chemoattractants) at the same time point, we observed a prominent increase in the expression of a neutrophil-specific marker (FCGR3B) (8) in parallel (Fig. 6A). FCGR3B increased in expression at 12 h and 1 day, peaked in expression on day 3, and was somewhat downregulated thereafter. These data firmly suggest that neutrophils are abundant first responders during Anhui/2 infection of the lung and furthermore imply a strong neutrophil presence through the intermediate and recovery phases of infection. Notably, myeloid progenitor cells (i.e., CD33+) exhibited an expression profile that was quite similar to that of FCGR3B, both in timing and magnitude (Fig. 6A). CD83, a marker for activated dendritic cells (DC), was most prominently expressed at day 1 p.i. but exhibited some upregulation on day 14 as well. Presumably, DC migrate to the lung in response to CCL20, which is upregulated at 12 h p.i. (cluster 9) (Fig. 4; see Table S2 in the supplemental material). Macrophage cell markers (CD68 and CD163) exhibited peak expression on day 3 (similar to neutrophils) and were not as highly expressed at subsequent time points. Natural killer cells (FC2GR2; Fig. 6A) and eosinophils and basophils (CD125 and IL3RA, respectively; data not shown) were generally upregulated from day 1 to day 6 p.i.
In contrast with the innate immune cell markers just described, T lymphocyte markers showed a biphasic pattern of expression, suggesting biphasic recruitment to the lung in response to Anhui/2 infection (Fig. 6B). Indeed, a general marker for multiple T lymphocyte populations (CD3), as well as markers for cytotoxic (CD8) and regulatory (CD25) T cells, consistently exhibited an initial peak at day 1 p.i., followed by a second more prominent peak on day 6. Similarly, helper T cells (as indicated by CD4 expression levels) showed an early peak on day 1 and a milder level of upregulation on day 6. It is conceivable that the decrease in expression of T cell markers on day 3 is a result of dilution due to prominent increases in neutrophil and macrophage populations (Fig. 6A). However, we point out that increased T cell marker expression directly coincides with lymphopenia (Fig. 1B), implying that T cell populations undergo authentic biphasic influx into the lung during influenza virus infection. In addition, the cooccurring biphasic IFNG protein upregulation in lung tissue and serum further supports the biphasic dynamics of T cell populations in response to Anhui/2 infection (Fig. 5). B cell populations (indicated by CD19 expression) were upregulated early (12 h) and exhibited a stable level for the remainder of the experiment (Fig. 6B).
In general, these data (i) support our initial observations of the recruitment of multiple immune cell subtypes into bronchioles and alveoli during the initial exposure and early inflammatory phases of infection (6 to 24 h p.i.; Fig. 3A to C); (ii) suggest that neutrophils and macrophages are primarily responsible for the profuse inflammation observed during the intermediate phase (24 h to 3 days; Fig. 3C and D); and (iii) indicate that T lymphocytes are the most significant cell population functioning during the late inflammatory and recovery phases of infection (6 to 14 days; Fig. 3E and F).
Pyrogenic molecules and biphasic fever.
As already noted, the biphasic fever observed in this model resembled that seen in some pediatric patients (10, 19). To investigate the causes of this, we assessed the timing and levels of expression of several well-known pyrogenic factors and their regulators (Fig. 7). PTGS2/COX2, TNF, IFNG, IL1A, and IL1B all exhibited upregulation at the mRNA level by 12 h p.i., and all except for PTGS2 and IFNG were even more upregulated at day 1 (Fig. 7A). TNF, IL1B, and IFNG also exhibited upregulation at the protein level at 12 to 24 h in lung, while systemically all three exhibited a protein-level peak at 2 days (Fig. 5). Since the initial fever peak occurred at days 1 to 2 p.i., these data imply that all of these molecules may contribute to the first phase of the Anhui/2-induced biphasic fever. Among the pyrogenic factors, only IL1B showed continued upregulation at 3 days p.i. (mRNA and protein in lung), when the initial fever was retracted. While the expressions of positive regulators of IL1B activity (7, 22, 25, 29, 36, 39, 52, 56) were consistently upregulated over the course of the experiment (Fig. 7B), multiple negative regulators of IL1B (i.e., IL1R2, MMP1, MMP3, MMP9, and CARD16) (24, 28, 31, 45, 46) were strongly upregulated at day 3 p.i. (Fig. 7C). This suggests that the expression of IL1B-negative regulators could be one of the mechanisms responsible for the antipyretic effects seen on day 3, despite the continuous expression of IL1B. Notably, IFNG mRNA and protein expression exhibited a second peak on day 6 in lungs and was also upregulated at the protein level systemically, correlating with the second peak of the biphasic fever (Fig. 5, Fig. 7A). Given the continued expression of IL1B inhibitors at this time point (Fig. 7C), it seems likely that the second fever peak is largely regulated by IFNG and/or other factors (e.g., TNF or IL-6).
Fig 7.
Time course expression patterns of pyrogenic factors. Transcript expression values in infected macaque lung, as determined by microarray, were plotted. Representative pyrogenic molecules (A), representative positive regulators of IL1B activity (B), and representative negative regulators of IL1B activity (C).
DISCUSSION
Here, we have developed an integrated, comprehensive model of experimentally induced sublethal influenza virus pneumonia in rhesus macaques. Clinical, virologic, histopathologic, and transcriptional analyses revealed an early host inflammatory reaction to initial viral infection (i.e., within 6 h), which was exacerbated in the presence of abundant viral replication at downstream time points (i.e., 12 h and 3 days) and receded in a delayed manner relative to reductions in viral replication at days 6 to 14 p.i. Immune cell recruitment into the lung occurred in a temporally regulated manner, with neutrophils exhibiting prominent early recruitment and sustained levels, abundant macrophage recruitment from days 1 to 3, and late increases in multiple populations of lymphocytes. A biphasic fever pattern was uniquely associated with this infection model, and we demonstrated that multiple host pyrogenic molecules are likely responsible for early and late fever phases. This work is the first detailed analysis of influenza virus pneumonia in nonhuman primates to encompass such a comprehensive viewpoint. Further, our novel, integrated analysis approach allowed for the correlation of specific host response events and the molecular mechanisms driving these incidents.
Our pathological findings revealed that the Anhui/2 virus targeted cells deep within the lungs, causing pneumonia with marked exudation of proteinaceous edema fluid and severe alveolar damage. However, the number of infected cells decreased over time, inflammation eventually receded, and all animals recovered from acute pneumonia. In humans lethally infected with HPAI H5N1 viruses, diffuse alveolar damage has been observed, along with characteristic fibrin exudates and hyaline membrane formation (34, 38), indicating severe capillary damage and impairment of host immune reactions. In Anhui/2-infected macaques, lung lesions lacked massive fibrin exudates and hyaline membranes and rather were characterized by a large infiltration of immune cell components. This was established at the microscopic level (Fig. 3) and was further verified by analysis of the global transcriptional profile over the course of infection (Fig. 4; see Table S2 in the supplemental material). Our model, therefore, seems to represent a milder pneumonia with significant immune reactions compared to lethal HPAI H5N1 human cases.
Although several previous studies have addressed the pathogenesis of different influenza viruses in other macaque species (2, 3, 11, 24, 30, 42), this is the first report to describe the host response as early as 6 h after virus exposure. Neither gross lesions nor antigen-positive cells could be detected at this time point. However, microscopically, we observed neutrophil infiltration and serum leakage at the junctions between the terminal bronchioles and respiratory bronchioles. Serum leakage is a direct indicator of changes in capillary permeability, and this host condition was supported by microarray data of the earliest transcriptional response clusters, which included molecules involved in regulating vascular permeability (e.g., LTB4R, VEGFC, FLT1, KDR) (see Table S2). In conjunction, transcriptional analyses also revealed upregulation of neutrophil-attracting chemokines (e.g., PF4/CXCL4 and PPBP/CXCL7) (see Table S2) (1, 18, 43) as early as 6 h after influenza virus exposure. Thus, the combination of upregulation of neutrophil chemoattractant expression and increased vascular permeability are likely key host responses involved in initiation of early neutrophil migration into influenza virus-infected lungs. Interestingly, we have recently shown that PF4 and PPBP are highly transcriptionally upregulated in human bronchial epithelial cells infected with an HPAI H5N1 virus (32). Since viral antigen could be detected in bronchial epithelium in macaque lung as early as 12 h after virus exposure (Fig. 3), it is likely that these cells contribute, at least in part, to early neutrophilic infiltrations.
In our macaque-Anhui/2 infection model, we observed biphasic patterns for both fever and lymphopenia. While humans lethally infected with HPAI H5N1 viruses also experienced fever and lymphopenia, no biphasic patterns have been reported (6, 12, 55). Additionally, biphasic fevers are usually not observed in adult patients infected with seasonal influenza viruses (16). Rather, our findings most closely resembled fever patterns in pediatric patients who developed pneumonia after infection with seasonal influenza viruses, with or without secondary bacterial infection (10, 19). Since secondary bacterial pneumonia was not implicated in this model, we conclude that the biphasic fever was induced by pure viral pneumonia. Global transcriptional profiles of several pyrogenic molecules indicated different control mechanisms for each fever curve, with the first wave likely regulated by the combined effects of TNF, IFNG, IL1A, and IL1B and the second wave likely regulated by IFNG only. In sum, this is the first study to replicate pneumonia-associated biphasic fevers in an animal model of influenza virus infection and to identify putative molecular mechanisms responsible for this observation.
Pure viral pneumonia occurs in the early phase of new pandemics, when influenza virus-associated deaths typically peak (5, 21, 40). A more specific understanding of the mechanisms regulating this disease process is essential in the strategy for controlling human mortality associated with pandemic viruses. The macaque model presented here exhibits features that are consistent with viral pneumonia in humans and has yielded important findings for understanding the early molecular events that regulate the pneumonia-associated host response. Furthermore, this unique model system provides the basis for testing specific preventative or control measures aimed at managing influenza virus-induced pneumonic disease.
Supplementary Material
ACKNOWLEDGMENTS
We thank Asako Nakagawa for excellent technical assistance.
This work was supported by a grant-in-aid for specially promoted research from the Ministries of Education, Culture, Sports, Science, and Technology (Y.K., K.S.), by the Chinese National Key Basic Research Program (grant no. 973, 2011CB505000; H.C.), by grants-in-aid from Health, Labor, and Welfare of Japan (Y.K., K.S.), by a Contract Research Fund for the Program of Japan Initiative for Global Research Network on Infectious Diseases (Y.K., K.S.), by ERATO (Y.K., K.S.), by the Global Center of Excellence (G-COE) program (K.S., A.M.) (Japan Science and Technology Agency), by the Chinese National Natural Science Foundation for Distinguished Young Scholars (30825032; H.C.), by National Institute of Allergy and Infectious Diseases Public Health Service research grants (Y.K.), and by U.S. Public Health Service grants P51 RR000166 and R24 RR016354 (M.G.K.).
Footnotes
Published ahead of print 4 April 2012
Supplemental material for this article may be found at http://jvi.asm.org/.
REFERENCES
- 1. Baltus T, et al. 2005. Differential and additive effects of platelet-derived chemokines on monocyte arrest on inflamed endothelium under flow conditions. J. Leukoc. Biol. 78:435–441 [DOI] [PubMed] [Google Scholar]
- 2. Baskin CR, et al. 2009. Early and sustained innate immune response defines pathology and death in nonhuman primates infected by highly pathogenic influenza virus. Proc. Natl. Acad. Sci. U. S. A. 106:3455–3460 [DOI] [PMC free article] [PubMed] [Google Scholar]
- 3. Baskin CR, et al. 2004. Integration of clinical data, pathology, and cDNA microarrays in influenza virus-infected pigtailed macaques (Macaca nemestrina). J. Virol. 78:10420–10432 [DOI] [PMC free article] [PubMed] [Google Scholar]
- 4. Bauer TT, Ewig S, Rodloff AC, Muller EE. 2006. Acute respiratory distress syndrome and pneumonia: a comprehensive review of clinical data. Clin. Infect. Dis. 43:748–756 [DOI] [PMC free article] [PubMed] [Google Scholar]
- 5. Bautista E, et al. 2010. Clinical aspects of pandemic 2009 influenza A (H1N1) virus infection. N. Engl. J. Med. 362:1708–1719 [DOI] [PubMed] [Google Scholar]
- 6. Beigel JH, et al. 2005. Avian influenza A (H5N1) infection in humans. N. Engl. J. Med. 353:1374–1385 [DOI] [PubMed] [Google Scholar]
- 7. Black RA, Kronheim SR, Sleath PR. 1989. Activation of interleukin-1 beta by a co-induced protease. FEBS Lett. 247:386–390 [DOI] [PubMed] [Google Scholar]
- 8. Bux J. 1999. Nomenclature of granulocyte alloantigens. ISBT working party on platelet and granulocyte serology, granulocyte antigen working party. International Society for Blood Transfusion. Transfusion 39:662–663 [DOI] [PubMed] [Google Scholar]
- 9. Cameron CM, et al. 2008. Gene expression analysis of host innate immune responses during lethal H5N1 infection in ferrets. J. Virol. 82:11308–11317 [DOI] [PMC free article] [PubMed] [Google Scholar]
- 10. Cherry JD, Long SS. 1990. Influenza viruses, p 1183–1185 In Oski FA, DeAngelis CD, Feigin RD, Warshaw JB. (ed), Principles and practice of pediatrics. J.B. Lippincott Company, New York, NY [Google Scholar]
- 11. Cillóniz C, et al. 2009. Lethal influenza virus infection in macaques is associated with early dysregulation of inflammatory related genes. PLoS Pathog. 5:e1000604. [DOI] [PMC free article] [PubMed] [Google Scholar]
- 12. de Jong MD, et al. 2006. Fatal outcome of human influenza A (H5N1) is associated with high viral load and hypercytokinemia. Nat. Med. 12:1203–1207 [DOI] [PMC free article] [PubMed] [Google Scholar]
- 13. Domínguez-Cherit G, et al. 2009. Critically ill patients with 2009 influenza A(H1N1) in Mexico. JAMA 302:1880–1887 [DOI] [PubMed] [Google Scholar]
- 14. Eisen MB, Spellman PT, Brown PO, Botstein D. 1998. Cluster analysis and display of genome-wide expression patterns. Proc. Natl. Acad. Sci. U. S. A. 95:14863–14868 [DOI] [PMC free article] [PubMed] [Google Scholar]
- 15. Fan S, et al. 2009. Immunogenicity and protective efficacy of a live attenuated H5N1 vaccine in nonhuman primates. PLoS Pathog. 5:e1000409. [DOI] [PMC free article] [PubMed] [Google Scholar]
- 16. Fauci AS, et al. 1998. Harrison's principles of internal medicine, 14th ed Health Professional Division, New York, NY [Google Scholar]
- 17. Fornek JL, et al. 2009. A single-amino-acid substitution in a polymerase protein of an H5N1 influenza virus is associated with systemic infection and impaired T-cell activation in mice. J. Virol. 83:11102–11115 [DOI] [PMC free article] [PubMed] [Google Scholar]
- 18. Gleissner CA, von Hundelshausen P, Ley K. 2008. Platelet chemokines in vascular disease. Arterioscler. Thromb. Vasc. Biol. 28:1920–1927 [DOI] [PMC free article] [PubMed] [Google Scholar]
- 19. Hall CB, Douglas RG., Jr 1975. Nosocomial influenza infection as a cause of intercurrent fevers in infants. Pediatrics 55:673–677 [PubMed] [Google Scholar]
- 20. Hatta M, et al. 2007. Growth of H5N1 influenza A viruses in the upper respiratory tracts of mice. PLoS Pathog. 3:1374–1379 [DOI] [PMC free article] [PubMed] [Google Scholar]
- 21. Hers JF, Masurel N, Mulder J. 1958. Bacteriology and histopathology of the respiratory tract and lungs in fatal Asian influenza. Lancet ii:1141–1143 [DOI] [PubMed] [Google Scholar]
- 22. Hsu LC, et al. 2008. A NOD2-NALP1 complex mediates caspase-1-dependent IL-1beta secretion in response to Bacillus anthracis infection and muramyl dipeptide. Proc. Natl. Acad. Sci. U. S. A. 105:7803–7808 [DOI] [PMC free article] [PubMed] [Google Scholar]
- 23. Ito A, et al. 1996. Degradation of interleukin 1beta by matrix metalloproteinases. J. Biol. Chem. 271:14657–14660 [DOI] [PubMed] [Google Scholar]
- 24. Itoh Y, et al. 2009. In vitro and in vivo characterization of new swine-origin H1N1 influenza viruses. Nature 460:1021–1025 [DOI] [PMC free article] [PubMed] [Google Scholar]
- 25. Kamens K, et al. 1995. Identification and characterization of ICH-2, a novel member of the interleukin-1 beta-converting enzyme family of cysteine proteases. J. Biol. Chem. 270:15250–15256 [DOI] [PubMed] [Google Scholar]
- 26. Kash JC, et al. 2004. Global host immune response: pathogenesis and transcriptional profiling of type A influenza viruses expressing the hemagglutinin and neuraminidase genes from the 1918 pandemic virus. J. Virol. 78:9499–9511 [DOI] [PMC free article] [PubMed] [Google Scholar]
- 27. Kash JC, et al. 2006. Genomic analysis of increased host immune and cell death responses induced by 1918 influenza virus. Nature 443:578–581 [DOI] [PMC free article] [PubMed] [Google Scholar]
- 28. Kawasaki Y, et al. 2008. Distinct roles of matrix metalloproteases in the early-and late-phase development of neuropathic pain. Nat. Med. 14:331–336 [DOI] [PMC free article] [PubMed] [Google Scholar]
- 29. Kleinnijenhuis J, et al. 2009. Transcriptional and inflammasome-mediated pathways for the induction of IL-1beta production by Mycobacterium tuberculosis. Eur. J. Immunol. 39:1914–1922 [DOI] [PubMed] [Google Scholar]
- 30. Kobasa D, et al. 2007. Aberrant innate immune response in lethal infection of macaques with the 1918 influenza virus. Nature 445:319–323 [DOI] [PubMed] [Google Scholar]
- 31. Lee SH, Stehlik C, Reed JC. 2001. Cop, a caspase recruitment domain-containing protein and inhibitor of caspase-1 activation processing. J. Biol. Chem. 276:34495–34500 [DOI] [PubMed] [Google Scholar]
- 32. Li C, et al. 2011. Host regulatory network response to infection with highly pathogenic H5N1 avian influenza virus. J. Virol. 85:10955–10967 [DOI] [PMC free article] [PubMed] [Google Scholar]
- 33. Li Y, et al. 2010. Continued evolution of H5N1 influenza viruses in wild birds, domestic poultry, and humans in China from 2004 to 2009. J. Virol. 84:8389–8397 [DOI] [PMC free article] [PubMed] [Google Scholar]
- 34. Liem NT, et al. 2008. H5N1-infected cells in lung with diffuse alveolar damage in exudative phase from a fatal case in Vietnam. Jpn. J. Infect. Dis. 61:157–160 [PubMed] [Google Scholar]
- 35. Livak KJ, Schmittgen TD. 2001. Analysis of relative gene expression data using real-time quantitative PCR and the 2(-delta delta C(T)) method. Methods 25:402–408 [DOI] [PubMed] [Google Scholar]
- 36. Maelfait J, et al. 2008. Stimulation of Toll-like receptor 3 and 4 induces interleukin-1beta maturation by caspase-8. J. Exp. Med. 205:1967–1973 [DOI] [PMC free article] [PubMed] [Google Scholar]
- 37. Maurer M, von Stebut E. 2004. Macrophage inflammatory protein-1. Int. J. Biochem. Cell Biol. 36:1882–1886 [DOI] [PubMed] [Google Scholar]
- 38. Ng WF, To KF, Lam WW, Ng TK, Lee KC. 2006. The comparative pathology of severe acute respiratory syndrome and avian influenza A subtype H5N1—a review. Hum. Pathol. 37:381–390 [DOI] [PMC free article] [PubMed] [Google Scholar]
- 39. Ozören N, et al. 2006. Distinct roles of TLR2 and the adaptor ASC in IL-1beta/IL-18 secretion in response to Listeria monocytogenes. J. Immunol. 176:4337–4342 [DOI] [PubMed] [Google Scholar]
- 40. Perez-Padilla R, et al. 2009. Pneumonia and respiratory failure from swine-origin influenza A (H1N1) in Mexico. N. Engl. J. Med. 361:680–689 [DOI] [PubMed] [Google Scholar]
- 41. Reed L, Muench H. 1938. A simple method of estimating fifty per cent endpoints. Am. J. Hyg. (Lond.) 27:493–497 [Google Scholar]
- 42. Safronetz D, et al. 2011. Pandemic swine-origin H1N1 influenza A virus isolates show heterogeneous virulence in macaques. J. Virol. 85:1214–1223 [DOI] [PMC free article] [PubMed] [Google Scholar]
- 43. Schenk BI, Petersen F, Flad HD, Brandt F. 2002. Platelet-derived chemokines CXC chemokine ligand (CXCL)7, connective tissue-activating peptide III, and CXCL4 differentially affect and cross-regulate neutrophil adhesion and transendothelial migration. J. Immunol. 169:2602–2610 [DOI] [PubMed] [Google Scholar]
- 44. Shu Y, Yu H, Li D. 2006. Lethal avian influenza A (H5N1) infection in a pregnant woman in Anhui Province, China. N. Engl. J. Med. 354:1421–1422 [DOI] [PubMed] [Google Scholar]
- 45. Sims JE. 2002. IL-1 and IL-18 receptors, and their extended family. Curr. Opin. Immunol. 14:117–122 [DOI] [PubMed] [Google Scholar]
- 46. Symons JA, Young PR, Duff GW. 1995. Soluble type II interleukin 1 (IL-1) receptor binds and blocks processing of IL-1 beta precursor and loses affinity for IL-1 receptor antagonist. Proc. Natl. Acad. Sci. U. S. A. 92:1714–1718 [DOI] [PMC free article] [PubMed] [Google Scholar]
- 47. van der Sluijs KF, van der Poll T, Lutter R, Juffermans NP, Schultz MJ. 2010. Bench-to-bedside review: bacterial pneumonia with influenza-pathogenesis and clinical implications. Crit. Care 14:219. [DOI] [PMC free article] [PubMed] [Google Scholar]
- 48. Venkata C, Sampathkumar P, Afessa B. 2010. Hospitalized patients with 2009 H1N1 influenza infection: the Mayo Clinic experience. Mayo Clin. Proc. 85:798–805 [DOI] [PMC free article] [PubMed] [Google Scholar]
- 49. Watanabe T, et al. 2009. Viral RNA polymerase complex promotes optimal growth of 1918 virus in the lower respiratory tract of ferrets. Proc. Natl. Acad. Sci. U. S. A. 106:588–592 [DOI] [PMC free article] [PubMed] [Google Scholar]
- 50. WHO 18 August 2011, accession date Pandemic (H1N1) 2009---update 110. http://www.who.int/csr/don/2010_07_23a/en/index.html WHO, Geneva, Switzerland [Google Scholar]
- 51. WHO 18 August 2011, accession date Cumulative number of confirmed human cases of avian influenza A/(H5N1) reported to WHO. http://www.who.int/csr/disease/avian_influenza/country/cases_table_2011_08_09/en/index.html WHO, Geneva, Switzerland [Google Scholar]
- 52. Willingham SB, et al. 2009. NLRP3 (NALP3, cryopyrin) facilitates in vivo caspase-1 activation, necrosis, and HMGB1 release via inflammasome-dependent and-independent pathways. J. Immunol. 183:2008–2015 [DOI] [PMC free article] [PubMed] [Google Scholar]
- 53. Wright P, Neumann G, Kawaoka Y. 2007. Orthomyxoviruses. In Knipe D, Howley P. (ed), Fields virology, p 1691–1740 Lippincott Williams & Wilkins, Philadelphia, PA [Google Scholar]
- 54. Yu H, et al. 2007. Avian influenza H5N1 study group. Human influenza A (H5N1) cases, urban areas of People's Republic of China, 2005–2006. Emerg. Infect. Dis. 13:1061–1064 [DOI] [PMC free article] [PubMed] [Google Scholar]
- 55. Yu H, et al. 2008. Clinical characteristics of 26 human cases of highly pathogenic avian influenza A (H5N1) virus infection in China. PLoS One 3:e2985. [DOI] [PMC free article] [PubMed] [Google Scholar]
- 56. Zhang Y, Saccani S, Shin H, Nikolajczyk BS. 2008. Dynamic protein associations define two phases of IL-1beta transcriptional activation. J. Immunol. 181:503–512 [DOI] [PMC free article] [PubMed] [Google Scholar]
- 57. Zitzow LA, et al. 2002. Pathogenesis of avian influenza A (H5N1) viruses in ferrets. J. Virol. 76:4420–4429 [DOI] [PMC free article] [PubMed] [Google Scholar]
Associated Data
This section collects any data citations, data availability statements, or supplementary materials included in this article.