

Abstract
Hepatitis C virus (HCV) infection significantly increases the prevalence of type 2 diabetes mellitus (T2DM). Insulin receptor substrate 1 (IRS-1) plays a key role in insulin signaling, thus enabling metabolic regulation in mammalian cells. We have previously shown that HCV infection modulates phosphorylation of Akt, a downstream target of IRS-1. In this study, we further examined the status of total IRS-1 and the downstream regulation of the Akt pathway in understanding mTOR/S6K1 signaling using HCV genotype 2a (clone JFH1)-infected hepatocytes. Inhibition of IRS-1 expression was observed in HCV-infected hepatocytes compared to that in a mock-infected control. The status of the tuberous sclerosis complex (TSC-1/TSC-2) was significantly decreased after HCV infection of human hepatocytes, showing a modulation of the downstream Akt pathway. Subsequent study indicated an increased level of Rheb and mTOR expression in HCV-infected hepatocytes. Interestingly, the phosphoS6K1 level was higher in HCV-infected hepatocytes, suggesting a novel mechanism for IRS-1 inhibition. Ectopic expression of TSC-1/TSC-2 significantly recovered the IRS-1 protein expression level in HCV-infected hepatocytes. Further analyses indicated that HCV core protein plays a significant role in modulating the mTOR/S6K1 signaling pathway. Proteasome inhibitor MG 132 recovered IRS-1 and TSC1/2 expression, suggesting that degradation occurred via the ubiquitin proteasome pathway. A functional consequence of IRS-1 inhibition was reflected in a decrease in GLUT4 protein expression and upregulation of the gluconeogenic enzyme PCK2 in HCV-infected hepatocytes. Together, these observations suggested that HCV infection activates the mTOR/S6K1 pathway in inhibiting IRS-1 function and perturbs glucose metabolism via downregulation of GLUT4 and upregulation of PCK2 for insulin resistance.
INTRODUCTION
Hepatitis C virus (HCV) often causes chronic infection and may lead to end stage liver disease (16). Approximately 200 million people worldwide are chronically infected with HCV, and it is the leading cause of liver transplantation in the western world (17). Chronic HCV infection can lead to a spectrum of liver disease, including diabetes, steatosis, scarring of the liver to cirrhosis, and hepatocellular carcinoma (16, 17, 27, 31, 32). Infection by HCV often leads to insulin resistance and can predispose to the onset of type 2 diabetes (17). Insulin resistance is a specific feature of chronic hepatitis C infection (31, 32, 38). Insulin resistance and diabetes adversely affect disease progression in chronic hepatitis C infection (2, 13, 14, 38). Several mechanisms are likely to be involved in the pathogenesis of HCV-related insulin resistance (1).
Biological effects of insulin occur through the phosphorylation of insulin receptor substrate 1 (IRS-1) and IRS-2 (42, 45, 46). Numerous defects in insulin signaling, including decreased activation of the insulin receptor β-subunit and a reduced tyrosine phosphorylation of insulin receptor substrate (IRS-1), have been identified in type 2 diabetic patients. Reports suggest that HCV upregulates suppressor of cytokine signaling 3 (SOCS3) expression (30) and increases tumor necrosis factor alpha (TNF-α) secretion (42), thereby impairing the insulin signaling pathway. Phosphorylation of Ser/Thr residues of IRS-1 blocks interactions with the insulin receptor, inhibits insulin signal transduction, and may also target IRS-1 for degradation (3, 4). An imbalance occurs between positive IRS-1 Tyr phosphorylation and negative Ser phosphorylation of IRS-1 in an insulin-resistant state (44).
Major progress has occurred in recent years in our understanding of the biochemical functions of the TSC1 and TSC2 gene products tuberin and hamartin, respectively (34). Cells lacking either TSC1 or TSC2 display constitutive activation of S6K1 (24). Mammalian Akt phosphorylates TSC2 at two to four critical sites, including S939 and T1462 (50), and in one study, overexpression of a dominant active Akt led to accelerated degradation of TSC1 and TSC2 by a ubiquitin/proteasome pathway (15). In addition, overexpression of TSC1/TSC2 blocks S6K1 activation (34). TSC1/TSC2 is a critical intermediate in the signaling pathway from PI3K to mTOR and downstream elements, serving as a brake on mTOR activity. However, the mechanism of this effect was unknown until recently, when multiple investigators discovered that TSC1/TSC2 functioned as a GTPase-activating protein (GAP), belonging to a conserved member of the Ras family, Rheb. Overexpression of Rheb has effects on cell size and cell cycle that are entirely similar to the effects of TSC1 or TSC2 loss (40). Overexpression of Rheb leads to high-level activation of S6K1, while reduction in Rheb by small interfering RNA (siRNA) reduces growth factor-induced S6K1 activation (23).
Previous reports have shown that HCV infection interferes with normal glucose metabolism (35), and increased blood glucose levels are associated with HCV infection. Kasai et al. (29) have shown that HCV replication downregulates cell surface expression of GLUT2, thereby lowering glucose uptake by hepatocytes. We have previously reported that HCV core protein upregulates Ser-312 phosphorylation of IRS-1 and impairs the Akt signaling pathway, which may in part be involved in the generation of insulin resistance (11). Thus, we became interested in understanding the mechanism of HCV-mediated regulation of the downstream Akt signaling pathway. In this study, we have shown that HCV infection of hepatocytes suppresses the expression of TSC-1/TSC-2 and activates Rheb, which in turn activates mTOR and its downstream target S6K1 in inhibiting insulin signaling via IRS-1 degradation (Fig. 1). Ectopic expression of TSC-1/TSC-2 significantly recovered IRS-1 levels in HCV protein-expressing hepatocytes, further emphasizing their role in mTOR/S6K1/IRS-1 signaling. HCV infection downregulates the expression of glucose transporter (GLUT4) and upregulates expression of the gluconeogenic enzyme PCK2, both of which are known to increase blood glucose levels.
Fig 1.
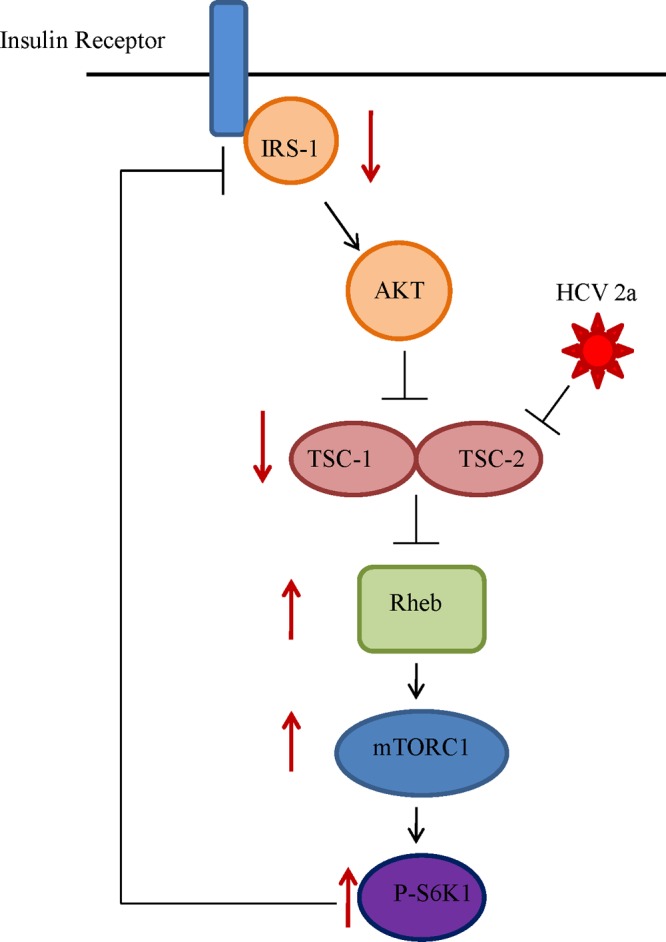
Simplified schematic presentation of HCV genotype 2a-mediated blocking of the insulin signaling pathway. We suggested previously that HCV infection upregulates Ser-312 phosphorylation of IRS-1 and impairs the Akt signaling pathway by modulation of Ser/Thr phosphorylation in the upstream insulin signaling pathway (11). Analysis of the downstream signaling pathway reveals that HCV further downregulates tumor suppressor TSC1/TSC2, resulting in an upregulation of Rheb. This results in downstream activation of mTOR and S6K1, which in turn acts as a negative regulator of IRS-1, causing insulin resistance. Directions of solid arrows on the side indicate up- or downregulation of specific signaling molecules.
MATERIALS AND METHODS
Immortalized human hepatocytes, transfection, and generation of cell culture-grown HCV.
Immortalized human hepatocytes (IHH) were generated by stable transfection of the HCV core (genotype 1a) genomic region into primary hepatocytes as previously described (12, 39). IHH exhibited a weak level of HCV core protein expression and were differentiated (28). IHH and Huh7.5 cells were transfected with a plasmid DNA-containing core gene from HCV genotype 2a under the control of a cytomegalovirus (CMV) promoter in a mammalian expression vector (pcDNA3-Core) using Lipofectamine 2000 (Invitrogen, Carlsbad, CA). Stable colonies from transfected cells were selected, using neomycin as previously described (39). Mock-transfected cells were used in parallel as a control. HCV genotype 2a (clone JFH1) was grown in IHH or Huh7.5 cells as previously described (28). Cell culture supernatant was filtered through a 0.45-μm-pore-size cellulose acetate membrane (Nalgene, Rochester, NY). HCV RNA was quantified by real-time PCR (in an ABI Prism 7000 real-time thermocycler), using HCV analyte-specific reagents (ASRs) (Abbott Molecular) (Department of Pathology, Saint Louis University). Virus growth was measured from cell culture supernatant using a fluorescent focus-forming assay. HCV titer was calculated to be ∼105 focus-forming units/ml. We have used a multiplicity of infection (MOI) of 1 for virus infection of hepatocytes.
Antibodies.
Commercially available antibodies to IRS-1, IRS-2, p-Ser-1101 IRS-1, TSC1, TSC2, Rheb, mTOR, S6K1, PCK2 (Cell Signaling Technology, Danvers, MA), and GLUT4 (Santa Cruz Biotechnology, Inc., CA) and horseradish peroxidase (HRP)-conjugated antibody to actin (Sigma-Aldrich, St. Louis, MO) were procured. A rabbit antiserum to HCV core antigen was kindly provided by Arvind Patel (University of Glasgow, United Kingdom).
Plasmid DNAs.
Human TSC-1 and TSC-2 plasmid DNAs were obtained from Addgene (Cambridge, MA).
Western blot analysis.
Proteins from cell lysates in sample-reducing buffer were resolved by SDS-PAGE. Proteins were transferred onto a nitrocellulose membrane and blocked with 3% nonfat dry milk. The membrane was incubated with a primary antibody, followed by a secondary antibody coupled to horseradish peroxidase to detect protein bands by chemiluminescence (Amersham, Piscataway, NJ). Cellular actin was detected, using a specific antibody, for comparisons of the protein load in each lane.
Real-time PCR analyses for PCK2 mRNA levels.
Cellular RNA was isolated by TRIzol (Invitrogen, Carlsbad, CA). cDNA synthesis was carried out by using random hexamers and ThermoScript II RNase H reverse transcriptase (Invitrogen). The mRNA statuses of IRS-1 and PCK2 were determined by real-time PCR (Applied Biosystems, Foster City, CA) by using specific oligonucleotide primers (assay identification number Hs00356436_m1 PCK2; Applied Biosystems). The results were normalized for 18S. All reactions were performed in triplicate in an ABI Prism 7500 Fast analyzer.
Immunofluorescence.
IHH adapted in Dulbecco modified Eagle medium (DMEM) was grown in an 8-well chamber slide to about 60% confluence. On the next day, cells were infected with HCV2a (clone JFH1) and grown in DMEM containing 2% FBS for 72 h. Cells were serum starved for 3 h in DMEM containing 0.1% fetal bovine serum (FBS) and incubated at 37°C for 1 h 30 min in the presence of insulin (200 nM). Cells were fixed with formaldehyde (3.7%) and permeabilized using 0.2% Triton X-100. Cells were stained for GLUT4 with a mouse monoclonal antibody and a secondary antibody conjugated with Alexa Fluor 488 (Molecular Probes, CA). Cells were treated with ProLong Gold antifade reagent with DAPI (4′6-diamidino-2-phenylindole) (Invitrogen, Carlsbad, CA) for fluorescence microscopy (Olympus FV1000). HCV core protein was also stained using a rabbit polyclonal antibody and a secondary antibody conjugated with Alexa Fluor 594 (Molecular Probes, CA).
RESULTS
HCV genotype 2a infection impairs IRS-1 expression.
IHH and Huh7.5 cells were infected with HCV genotype 2a (clone JFH1), and the IRS-1 status was determined by Western blot analysis using specific antibodies. HCV core protein expression was examined as an index of viral infection (Fig. 2A). IRS-1 protein was undetectable in virus-infected hepatocytes (Fig. 2B). To determine whether HCV core protein is involved in regulating IRS-1, we transfected IHH and Huh7.5 cells with HCV core plasmid DNA and observed that the viral protein decreased the expression of IRS-1 in both cell types (Fig. 2C). The level of IRS-2 was also determined in HCV 2a-infected cells to examine if this effect was specific for IRS-1. HCV 2a infection did not significantly alter IRS-2 protein level in IHH or Huh7.5 cells (Fig. 2D). The results from this set of experiments suggested that total IRS-1 expression is markedly reduced in HCV genotype 2a-infected hepatocytes as well as in hepatocytes transiently transfected with HCV core plasmid DNA.
Fig 2.
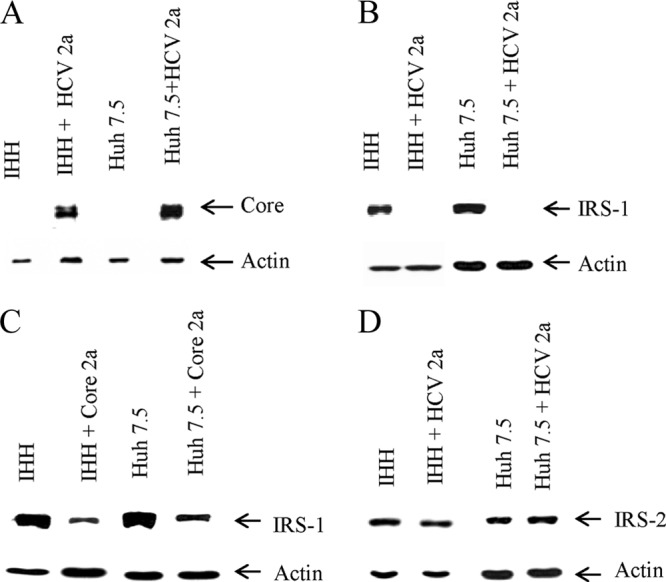
IRS-1 expression is markedly reduced upon HCV infection or HCV core protein expression. (A) Expression status of HCV core protein in HCV genotype 2a-infected IHH or Huh7.5 cells is shown. (B) IRS-1 status in cell culture-grown HCV genotype 2a-infected IHH or Huh7.5 cells. The expression status of actin in each lane was determined as a loading control. Mock-infected cells were included as a negative control. (C) IRS-1 protein expression status in IHH and Huh7.5 cells following transient transfection of HCV core. (D) IRS-2 expression status in HCV genotype 2a-infected IHH and Huh7.5 cells.
HCV infection suppresses TSC-1/TSC-2 and increases Rheb expression.
We previously reported that HCV impairs Akt activation (11). Here, we investigated the status of the tumor suppressor complex TSC-1/TSC-2, which lies downstream in the IRS-1/Akt signaling pathway. For this, IHH and Huh7.5 cells were mock treated or infected with HCV genotype 2a. The status of TSC-1/TSC-2 was determined by Western blot analysis using specific antibodies. The actin level was also determined for use as a loading control. TSC-1/TSC-2 expression could not be detected in HCV 2a-infected IHH or Huh7.5 cells (Fig. 3A). The effect of HCV core protein was separately determined by transfecting into IHH or Huh7.5 cells. Core from HCV 2a suppressed TSC-1/TSC-2 expression (Fig. 3B). Since TSC-1/TSC-2 acts directly to suppress activation of a downstream target, Rheb (Ras homolog enriched in brain), we wanted to determine its status in HCV 2a-infected IHH and Huh7.5 cells. Rheb was highly upregulated in IHH and Huh7.5 cells infected with HCV 2a compared to that in mock-treated cells (Fig. 3C). Transfection with core from HCV genotype 2a increased Rheb expression in both IHH and Huh7.5 cells (Fig. 3D). Thus, our results suggested that HCV genotype 2a activates Rheb via repression of the tumor suppressor complex TSC-1/TSC-2 and HCV core protein plays a key role in this process.
Fig 3.
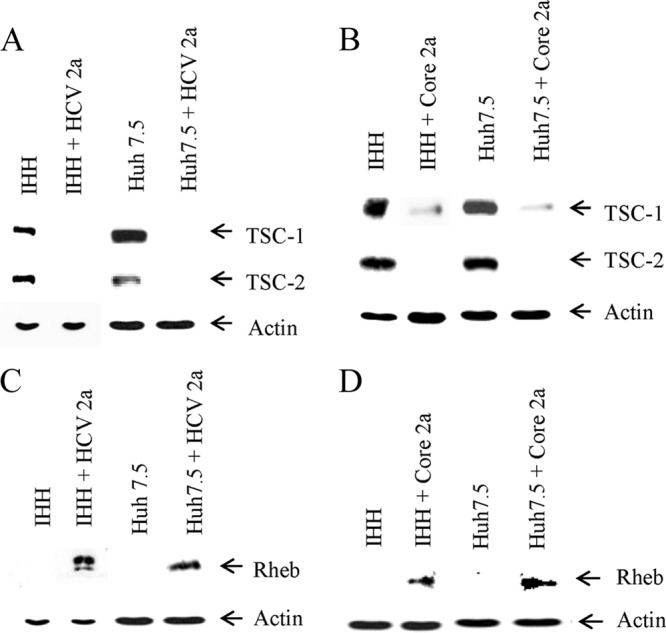
HCV genotype 2a infection or introduction of core gene inversely correlates with the TSC1/TSC2 and Rheb expression status. (A) Mock- or HCV genotype 2a-infected IHH or Huh7.5 cells were analyzed for TSC-1/TSC-2 expression status by Western blot analysis. The expression level of actin in each lane was determined as a loading control. (B) The TSC-1/TSC-2 expression status from HCV core 2a-transfected IHH and Huh7.5 cells is shown. (C) IHH and Huh7.5 cells infected with HCV genotype 2a were similarly analyzed for the expression level of Rheb. The expression status of actin in each lane was used as a loading control. (D) The expression status of Rheb from HCV core 2a-transfected IHH or Huh7.5 cells is shown.
HCV infection enhances mTOR and pS6K1 expression.
Next, we determined the expression status of mTOR and its activated phosphorylated moiety, a downstream signaling component of Rheb. For this, IHH was infected with HCV genotype 2a. An increase in both total and phosphorylated mTOR (phospho-Ser-2448) expression was observed in infected hepatocytes (Fig. 4A). Insulin-induced anabolic responses, most notably ribosome biogenesis and protein synthesis, rely in part on S6K1, a member of the A, G, and C family of serine/threonine protein kinases. S6K1 is a downstream target of mTOR. Therefore, we examined the phospho-S6K1 (Thr-389) status in HCV 2a-infected hepatocytes. For this, IHH and Huh7.5 cells were separately infected with HCV genotype 2a. The phospho-S6K1 level was upregulated in HCV genotype 2a-infected IHH or Huh7.5 cells (Fig. 4B and C), suggesting a novel mechanism for IRS-1 inhibition. Transient transfection of HCV core in IHH and Huh7.5 cells also increased the p-S6K1 level, suggesting the involvement of core protein in modulating the expression of p-S6K1 (Fig. 4D). We also measured the total S6K1 level by Western blot analysis and found similar expression levels in HCV 2a-infected and core 2a-transfected cells and the control (Fig. 4E and F). These results suggested that HCV genotype 2a infection enhances both mTOR and phospho-S6K1 status and the involvement of core protein in modulating expression in this signaling pathway.
Fig 4.

HCV genotype 2a infection enhances expression of mTOR and p-S6K1. (A) Mock- and HCV genotype 2a-infected IHH cells were analyzed for total and Ser-2448 phosphorylation status of mTOR. The tubulin level in each lane was determined as a loading control. (B and C) Activated phosphorylated-S6K1 (Thr-389) status in mock- or HCV genotype 2a-infected IHH or Huh7.5 cells, respectively, were analyzed by Western blot. The tubulin or actin level in each lane was used for comparison of protein loads. (D) p-S6K1 expression status from HCV core 2a-transfected IHH or Huh7.5 cells is shown. (E) Total S6K1 status in mock-infected or HCV genotype 2a-infected IHH or Huh7.5 cells were analyzed by Western blotting. (F) Total S6K1 expression status from HCV core 2a-transfected IHH or Huh7.5 cells is also shown.
Mechanisms for degradation of IRS-1 and TSC-1/TSC-2.
We wanted to determine how IRS-1 and TSC-1/TSC-2 expression is downregulated in HCV genotype 2a-infected or HCV core plasmid DNA-transfected hepatocytes. For this, we infected IHH and Huh7.5 cells with the virus. After 72 h of infection, the cells were mock treated or incubated with 10 μM MG132 (proteasome inhibitor) for 6 h. We observed recovery of IRS-1 expression in both IHH and Huh7.5 cells infected with HCV genotype 2a in the presence of MG132 (Fig. 5A and B). A similar recovery of TSC-1/TSC-2 expression was also observed in IHH and Huh7.5 cells infected with virus in the presence of MG132 (Fig. 5C and D). These results suggested that IRS-1 and TSC-1/TSC-2 are degraded by the ubiquitin proteasome pathway in HCV-infected hepatocytes.
Fig 5.

IRS-1 and TSC-1/TSC-2 are proteasomally degraded via the ubiquitin pathway. (A and B) IRS-1 status was determined in IHH and Huh7.5 cells infected with HCV genotype 2a in the presence or absence of proteasome inhibitor MG 132 (10 μM). Mock-infected cells were similarly treated with or without MG132. (C and D) TSC-1/TSC-2 status was determined in IHH and Huh7.5 cells infected with HCV genotype 2a in the presence or absence of proteasome inhibitor MG 132. Mock-infected cells were similarly treated with or without MG132. (E and F) IRS-1 Ser-1101 phosphorylation by HCV genotype 2a. Phosphorylation status of IRS-1 Ser-1101 in mock- or HCV 2a-infected IHH or Huh7.5 cells with or without MG132 treatment. The actin level was determined as a loading control.
Phosphorylation of IRS-1 at Ser-1101 via the mTOR-S6K1 pathway is reported to release IRS-1 from intracellular complexes, thereby enabling its degradation (22). S6K1 phosphorylates IRS-1 at multiple serine residues, including Ser-1101, which leads to degradation of IRS-1 (49). We wanted to determine if activated S6K1 was phosphorylating IRS-1 at the Ser-1101 residue. Since we could recover IRS-1 expression from MG132-treated HCV 2a-infected cells, we reprobed the same blot to see if Ser-1101 of IRS-1 was phosphorylated by activated p-S6K1. Interestingly, we found that there was phosphorylation of Ser-1101 of IRS-1 in HCV genotype 2a-infected IHH and Huh7.5 cells (Fig. 5E and F). This result indicated that IRS-1 is degraded specifically via the activation of S6K1 in HCV-infected hepatocytes.
Recovery of IRS-1 in HCV protein-expressing cells following ectopic expression of TSC-1/TSC-2.
Plasmid DNAs encoding TSC-1 and TSC-2 were cotransfected into prior HCV core 2a-introduced IHH to determine if the IRS-1 protein expression level can be rescued. Interestingly, overexpression of TSC-1/TSC-2 rescued IRS-1 protein to a detectable level as determined by Western blot analysis (Fig. 6A). A significant recovery of IRS-1 was observed in a similar experiment upon introduction of TSC-1/TSC-2 into HCV genotype 2a-infected Huh7.5 cells (Fig. 6B). The difference in the rescue level of IRS-1 could be due to the level of viral protein expression in transiently versus virus-infected hepatocytes. The results from this set of experiments further emphasize the role of TSC-1/TSC-2 in the regulation of IRS-1 through the mTOR/S6K1/IRS-1 signaling pathway.
Fig 6.
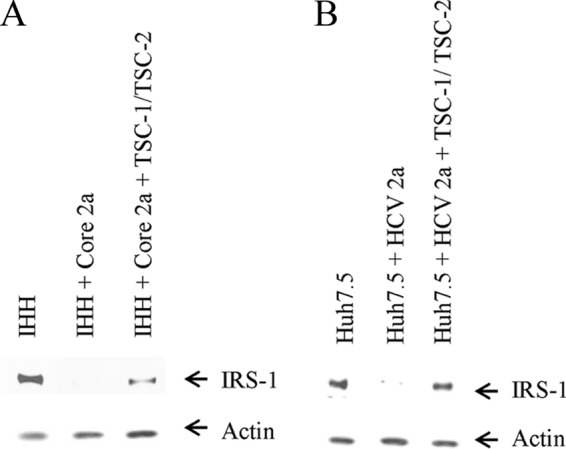
Ectopic expression of TSC-1/TSC-2-rescued IRS-1 protein expression. (A and B) Western blot analyses displaying increased IRS-1 protein levels upon ectopic expression of TSC-1/TSC-2 in IHH transfected with HCV core 2a or Huh7.5 cells infected with HCV genotype 2a. The actin level was determined as a loading control.
HCV downregulates GLUT-4 expression level.
GLUT-4 is normally an adipose- and muscle-specific glucose transporter. However, expression of GLUT4 has also been observed in liver-specific cells (HepG2, hepatic stellate cells [HSC], and IHH). Here, we determined how HCV infection affects glucose uptake in hepatocytes. For this, we analyzed the status of glucose transporter (GLUT-4), a protein involved in glucose uptake from hepatocyte surface. Western blot analysis suggested that the GLUT-4 level is significantly downregulated in HCV genotype 2a-infected IHH (Fig. 7A). Treatment with MG132 (10 μM) did not rescue the GLUT-4 protein level, suggesting a proteasome-independent degradation process (Fig. 7B). Immunofluorescence microscopy also suggested a lower level of GLUT-4 expression in HCV genotype 2a-infected IHH compared to control cells (Fig. 7C). Downregulation of GLUT-4 results in decreased uptake of glucose from blood via cells which in turn causes the level of blood glucose to rise. We also used a cell surface marker (CD81) to see the cellular localization of GLUT-4 in the presence of insulin and found that GLUT-4 was mostly present on the surface of IHH in the presence of insulin. But this surface expression was reduced upon HCV 2a infection (data not shown). The results from this set of experiments indicated that HCV2a represses GLUT-4 expression on the hepatocyte surface, which results in a higher blood glucose level.
Fig 7.

HCV genotype 2a infection represses GLUT-4 expression and enhances gluconeogenic enzyme PCK2 mRNA expression level. (A) Mock- and HCV genotype 2a-infected IHH cells were analyzed for GLUT-4 protein expression by Western blotting. The actin levels were determined in each lane as a loading control. (B) Mock and HCV genotype 2a-infected IHH were analyzed for GLUT-4 protein expression by Western blot in the presence and absence of MG132 (10 μM). Actin levels were determined in each lane as a loading control. (C) Immunofluorescence displaying cellular localization of GLUT-4 in HCV genotype 2a-infected IHH. Mock- or HCV-infected cells were treated with insulin (200 nM) after 72 h of infection. Green indicates localization of GLUT4, and red indicates HCV core protein expression. (D) Relative PCK2 mRNA expression status in mock- and HCV genotype 2a-infected IHH cells. (E) A similar analysis for PCK2 mRNA expression from Huh7.5 cells is shown. The results were normalized to endogenous 18S rRNA. (F) The protein level of PCK2 was determined by Western blotting in IHH and Huh7.5 cells infected with HCV genotype 2a.
HCV infection enhances gluconeogenic PCK2 expression.
Gluconeogenesis is regulated mainly at the transcriptional level by FoxO1 through activation of genes, including G6PC. We have previously shown upregulation of G6PC mRNA in HCV-infected cells (10). Here, we examined how HCV genotype 2a infection impairs the gluconeogenic process by looking at the gluconeogenic enzyme PCK2. For this, we determined the PCK2 mRNA expression level in IHH and Huh7.5 cells infected with HCV genotype 2a. We observed an increased expression of PCK2 mRNA in HCV 2a-infected IHH or Huh7.5 cells (Fig. 7D and E). HCV 2a infection also increased PCK2 protein levels in both IHH and Huh7.5 cells. (Fig. 7F). Increased PCK2 levels indicate an increased rate of gluconeogenesis. Hence more production of glucose from noncarbohydrate substrates results in an increased blood glucose level, which disturbs the normal glucose homeostasis in blood.
DISCUSSION
In this study, we have shown that HCV genotype 2a infection of hepatocytes activates the mTOR/S6K1 signaling pathway and inhibits IRS-1 function. HCV perturbs glucose metabolism via downregulation of the glucose transporter (GLUT4) and upregulation of key gluconeogenic enzyme PCK2. Tyrosine phosphorylation of IRS molecules by insulin receptor kinase is an important step for insulin action on target cells. Activation of PI3K and one of its downstream Akt targets is essential for most of the metabolic effects of insulin. Therefore, a defect at any point in this pathway may lead to insulin resistance.
We have previously shown that HCV infection or viral protein expression from transfected genes encoding the core or full length in cells increased the phosphorylated Ser-312–IRS-1 protein level but did not consistently alter total IRS-1 status (11). Insulin-stimulated degradation of IRS-1 via the PI3 kinase pathway is believed to be dependent upon the Ser-312 phosphorylation of IRS-1 (26), although the kinetics of phosphorylation and degradation is not clear due to a complexity involving multiple phosphorylation sites. In this study, we have observed that total IRS-1 is degraded upon HCV genotype 2a infection of IHH or Huh7.5 cells. The apparent difference in IRS-1 degradation could be due to a change in kinetics in cell lines and/or an altered level of virus protein expression. However, our primary observations from both studies suggest that HCV infection results in insulin resistance via IRS-1 modulation. IRS proteins are key players in propagating insulin signaling and are therefore subjected to feedback regulatory systems that inhibit their action. Feedback regulation involves phosphatase-mediated dephosphorylation (20) or Ser/Thr phosphorylation of functionally active Tyr-phosphorylated IRS proteins (47). Ser/Thr phosphorylation can induce dissociation of IRS proteins from the insulin receptor or from downstream effectors or could lead to their degradation (47). Identification of IRS-1 Ser-1101 as a target of S6K1 has been reported earlier (43). The present study focused on a Ser-1101, which upon phosphorylation may interfere with the association between IRS-1 and the insulin receptor (22, 49). Here, we have shown that Ser-1101 phosphorylation of IRS-1 results in IRS degradation. On the other hand, Ser-312 phosphorylation of IRS-1 inactivates IRS-1 and may lead to its eventual degradation resulting in insulin resistance.
We have shown previously that HCV core protein expression decreases glucose uptake in human hepatocytes (11). Therefore, we determined the status of the glucose transporter (GLUT4), responsible for uptake of glucose from the cell surface, and found that GLUT4 was significantly downregulated in HCV-infected hepatocytes. Since HCV infection is associated with T2DM and is characterized by a high blood glucose level, we wanted to determine how HCV affects glucose metabolism at the gluconeogenic steps. We observed that HCV infection increases mRNA and protein levels of the gluconeogenic enzyme PCK2. Our results agree with the observations from Deng et al. (19), suggesting that HCV infection promotes hepatic gluconeogenesis.
HCV core protein does not modulate phosphorylation of Akt at Thr-308, while Ser-473 phosphorylation is significantly increased (11). This IRS-1 modulation could participate, in part, in the generation of a state associated with insulin resistance. However, other mechanisms may also be involved in the modulation of IRS-1 for insulin resistance (30). Activation of Akt by insulin appears to require phosphorylation of Thr-308 and Ser-473 by PDK1 and TORC2, respectively (5, 6, 21). Studies on insulin-induced glucose uptake in rat adipose cells in the presence of 7-hydroxystaurosporine suggested that Thr-308 phosphorylation of Akt is necessary for increased glucose uptake, whereas Ser-473 phosphorylation is not (33, 44). Dysregulation of the Ser/Thr protein kinase Akt underlies the pathology of a number of common human diseases, such as cancer and diabetes.
Here, we have shown that the tumor suppressor complex (TSC-1/TSC-2), a downstream target of Akt, is significantly inhibited by HCV genotype 2a. Rheb is a direct target of the tuberous sclerosis tumor suppressor proteins (47, 48). We found that Rheb is significantly upregulated in HCV 2a-infected hepatocytes. The signaling function of mTOR complex 1 is activated by Rheb-GTP (8) and stimulates phosphorylation of downstream component S6K1 (37). We observed that HCV 2a activates mTOR and results in activation of S6K1, which in turn causes IRS-1 downregulation (Fig. 1). Ectopic expression of TSC-1/TSC-2 results in rescue of IRS-1 expression. Thus, activation of mTOR/S6K1 is likely occurring via downregulation of TSC-1/TSC-2 by HCV and not mediated by Akt itself. The effects of HCV on TSC, Rheb, and mTOR may occur independently. However, upregulation of Rheb and mTOR appears to be an event concurrent with inhibition of TSC.
We were curious to determine the possible mechanism by which IRS-1 and TSC-1/TSC-2 are degraded, and hence we used the proteasome inhibitor MG 132 to determine if we can prevent IRS-1 and TSC-1/TSC-2 degradation. We observed that MG132 treatment of hepatocytes prevented degradation of IRS-1 and the TSC1/2 complex, suggesting that they were being degraded by the ubiquitin proteasome pathway. S6K1 phosphorylates IRS-1 at multiple serine residues, including Ser-1101, which cause IRS-1 to be degraded via the proteasome (22, 49). Since S6K1 was activated by HCV genotype 2a infection, we wanted to determine if activated S6K1 was actually initiating the degradation of IRS-1. Since we could recover IRS-1 expression in MG132-treated HCV 2a-infected cells, we reprobed the same blot to see the status of Ser-1101 of IRS-1. Interestingly, we found that IRS-1 was phosphorylated specifically at the Ser-1101 residue in HCV genotype 2a-infected cells. This result suggests that mTOR/S6K1 is activated in HCV-infected hepatocytes and causes IRS-1 degradation. Ectopic expression of TSC-1/TSC-2 significantly rescued IRS-1 protein expression, further suggesting their modulated role in the mTOR/S6K1/IRS-1 signaling loop in HCV infection.
Diabetes is a known complication of all liver diseases, especially in the advanced stage. However, clinical and experimental work suggests a direct role for HCV in glucose metabolism (35). HCV-infected cirrhotic patients may present with T2DM more frequently than patients with cirrhosis of other origins (7). A retrospective analysis with chronic viral hepatitis reported that diabetes occurred in 21% of HCV-infected patients but only in 12% of hepatitis B virus (HBV)-infected subjects (36). Multivariate analysis suggested that HCV infection and age were independent predictors of diabetes, and HCV genotype 2a was found in 29% of HCV-infected diabetic patients but only in 3% of controls (25).
Experimental data suggested a direct interference of HCV with the insulin cascade via proteasomal degradation of the IRS-1 and IRS-2 (30) and their functional impairment through increased levels of proinflammatory cytokines, such as TNF-α (41) or another postreceptor defect (9). Knobler and Schattner (32) have suggested that HCV patients with more severe liver disease may have an exaggerated intrahepatic TNF-α response, resulting in insulin resistance and a higher risk of developing diabetes. In patients with HCV genotype 3a, the virus may alter intrahepatic insulin signaling through a downregulation of peroxisome proliferator-activated receptor gamma (18). Other researchers have shown that HCV downregulates IRS-1 and -2 through upregulation of suppressor of cytokine signaling 3 (SOCS3) (30). Downregulation of IRS-1 and IRS-2 in HCV core-transgenic mice livers and HCV core-transfected human hepatoma cells occurs via a proteosomal degradation mechanism. Our study generated novel mechanistic information on the activation of an mTOR/S6K1 signaling pathway for IRS-1 suppression by HCV genotype 2a.
ACKNOWLEDGMENTS
We thank Arvind Patel and Chen Liu for providing antibodies and Lin Cowick for preparation of the manuscript.
This work was supported by grant DK080812 from the National Institutes of Health.
Footnotes
Published ahead of print 28 March 2012
REFERENCES
- 1. Adinolfi LE, Durante-Mangoni E, Zampino R, Ruggiero G. 2005. Review article: hepatitis C virus-associated steatosis—pathogenic mechanisms and clinical implications. Aliment. Pharmacol. Ther. 2(Suppl):52–55 [DOI] [PubMed] [Google Scholar]
- 2. Adinolfi LE, et al. 2001. Steatosis accelerates the progression of liver damage of chronic hepatitis C patients and correlates with specific HCV genotype and visceral obesity. Hepatology 33:1358–1364 [DOI] [PubMed] [Google Scholar]
- 3. Aguirre V, et al. 2002. Phosphorylation of Ser307 in insulin receptor substrate-1 blocks interactions with the insulin receptor and inhibits insulin action. J. Biol. Chem. 277:1531–1537 [DOI] [PubMed] [Google Scholar]
- 4. Aguirre V, Uchida T, Yenush L, Davis R, White MF. 2000. The c-Jun NH2-terminal kinase promotes insulin resistance during association with insulin receptor substrate-1 and phosphorylation of Ser(307). J. Biol. Chem. 275:9047–9054 [DOI] [PubMed] [Google Scholar]
- 5. Alessi DR, et al. 1996. Mechanism of activation of protein kinase B by insulin and IGF-1. EMBO J. 15:6541–6551 [PMC free article] [PubMed] [Google Scholar]
- 6. Alessi DR, et al. 1997. Characterization of a 3-phosphoinositide-dependent protein kinase which phosphorylates and activates protein kinase Bα. Curr. Biol. 7:261–269 [DOI] [PubMed] [Google Scholar]
- 7. Allison ME, Wreghitt T, Palmer CR, Alexander GJM. 1994. Evidence for a link between hepatitis C virus infection and diabetes mellitus in a cirrhotic population. J. Hepatol. 21:1135–1139 [DOI] [PubMed] [Google Scholar]
- 8. Avruch J, et al. 2009. Activation of mTORC1 in two steps: Rheb-GTP activation of catalytic function and increased binding of substrates to raptor. Biochem. Soc. Trans. 37:223–226 [DOI] [PubMed] [Google Scholar]
- 9. Aytug S, Reich D, Sapiro LE, Bernstein D, Begum N. 2003. Impaired IRS-1/PI3-kinase signalling in patients with HCV: a mechanism for increased prevalence of type 2 diabetes. Hepatology 38:1384–1392 [DOI] [PubMed] [Google Scholar]
- 10. Banerjee A, Meyer K, Mazumdar B, Ray RB, Ray R. 2010. Hepatitis C virus differentially modulates activation of forkhead transcription factors and insulin-induced. metabolic gene expression. J. Virol. 84:5936–5946 [DOI] [PMC free article] [PubMed] [Google Scholar]
- 11. Banerjee S, et al. 2008. Hepatitis C virus core protein upregulates serine phosphorylation of insulin receptor substrate-1 and impairs the downstream Akt/protein kinase B signaling pathway for insulin resistance. J. Virol. 82:2606–2612 [DOI] [PMC free article] [PubMed] [Google Scholar]
- 12. Basu A, Meyer K, Ray RB, Ray R. 2002. Hepatitis C virus core protein is necessary for the maintenance of immortalized human hepatocytes. Virology 298:53–62 [DOI] [PubMed] [Google Scholar]
- 13. Castera L, Pawlotsky JM, Dhumeaux D. 2003. Worsening of steatosis and fibrosis progression in hepatitis C. Gut 52:1531. [DOI] [PMC free article] [PubMed] [Google Scholar]
- 14. Clark JM, Diehl AM. 2002. Hepatic steatosis and type 2 diabetes mellitus. Curr. Diab. Rep. 2:210–215 [DOI] [PubMed] [Google Scholar]
- 15. Dan HC, et al. 2002. PI3K/AKT pathway regulates TSC tumor suppressor complex by phosphorylation of tuberin. J. Biol. Chem. 277:35364–35370 [DOI] [PubMed] [Google Scholar]
- 16. Dash S, et al. 2005. HCV-hepatocellular carcinoma: new findings and hope for effective treatment. Microsc. Res. Tech. 68:130–148 [DOI] [PubMed] [Google Scholar]
- 17. Decock S, Verslype C, Fevery J. 2007. Hepatitis C and insulin resistance: mutual interactions. Acta Clin. Belg. 62:111–119 [DOI] [PubMed] [Google Scholar]
- 18. De Gottardi A, et al. 2006. Peroxisome proliferator-activated receptor-alpha and -gamma mRNA levels are reduced in chronic hepatitis C with steatosis and genotype 3 infection. Aliment. Pharmacol. Ther. 23:107–114 [DOI] [PubMed] [Google Scholar]
- 19. Deng L. 2011. Hepatitis C virus infection promotes hepatic gluconeogenesis through an NS5A-mediated, FoxO1-dependent pathway. J. Virol. 85:8556–8568 [DOI] [PMC free article] [PubMed] [Google Scholar]
- 20. Elchebly M, et al. 1999. Increased insulin sensitivity and obesity resistance in mice lacking the protein tyrosine phosphatase-1B gene. Science 283:1544–1548 [DOI] [PubMed] [Google Scholar]
- 21. Engelman JA, Luo J, Cantley LC. 2006. The evolution of phosphatidylinositol 3-kinases as regulators of growth and metabolism. Nat. Rev. Genet. 7:606–619 [DOI] [PubMed] [Google Scholar]
- 22. Fritsche L, Weigert C, Häring H-U, Lehmann R. 2008. How insulin receptor substrate proteins regulate the metabolic capacity of the liver—implications for health and disease. Curr. Med. Chem. 15:1316–1329 [DOI] [PubMed] [Google Scholar]
- 23. Garami A, et al. 2003. Insulin activation of Rheb, a mediator of mTOR/S6K/4E-BP signaling, is inhibited by TSC1 and 2. Mol. Cell 11:1457–1466 [DOI] [PubMed] [Google Scholar]
- 24. Goncharova EA, et al. 2002. Tuberin regulates p70 S6 kinase activation and ribosomal protein S6 phosphorylation: a role for the TSC2 tumor suppressor gene in pulmonary lymphangioleiomyomatosis (LAM). J. Biol. Chem. 277:30958–30967 [DOI] [PubMed] [Google Scholar]
- 25. Gray A, et al. 1995. High prevalence of hepatitis C infection in Afro-Caribbean patients with type 2 diabetes and abnormal liver function tests. Diabet. Med. 12:244–249 [DOI] [PubMed] [Google Scholar]
- 26. Greene MW, Sakaue H, Wang L, Alessi DR, Roth RA. 2003. Modulation of insulin-stimulated degradation of human insulin receptor substrate-1 by Serine 312 phosphorylation. J. Biol. Chem. 278:8199–8211 [DOI] [PubMed] [Google Scholar]
- 27. Jeffers L. 2000. Hepatocellular carcinoma: an emerging problem with hepatitis C. J. Natl. Med. Assoc. 92:369–371 [PMC free article] [PubMed] [Google Scholar]
- 28. Kanda T, et al. 2006. Generation of infectious hepatitis C virus in immortalized human hepatocytes. J. Virol. 80:4633–4639 [DOI] [PMC free article] [PubMed] [Google Scholar]
- 29. Kasai D, et al. 2009. HCV replication suppresses cellular glucose uptake through down-regulation of cell surface expression of glucose transporters. J. Hepatol. 50:883–894 [DOI] [PubMed] [Google Scholar]
- 30. Kawaguchi T, et al. 2004. Hepatitis C virus down-regulates insulin receptor substrates 1 and 2 through up-regulation of suppressor of cytokine signaling 3. Am. J. Pathol. 165:1499–1508 [DOI] [PMC free article] [PubMed] [Google Scholar]
- 31. Knobler H, et al. 2003. Tumor necrosis factor-alpha-induced insulin resistance may mediate the hepatitis C virus-diabetes association. Am. J. Gastroenterol. 98:2751–2756 [DOI] [PubMed] [Google Scholar]
- 32. Knobler H, Schattner A. 2005. TNF-α, chronic hepatitis C and diabetes: a novel triad. QJM 98:1–6 [DOI] [PubMed] [Google Scholar]
- 33. Kondapaka SB, Zarnowski M, Yver DR, Sausville EA, Cushman SW. 2004. 7-Hydroxystaurosporine (UCN-01) inhibition of Akt Thr308 but not Ser473 phosphorylation: a basis for decreased insulin-stimulated glucose transport. Clin. Cancer Res. 10:7192–7198 [DOI] [PubMed] [Google Scholar]
- 34. Kwiatkowski DJ. 2003. Rhebbing up mTOR: new insights on TSC1 and TSC2, and the pathogenesis of tuberous sclerosis. Cancer Biol. Ther. 2:471–476 [DOI] [PubMed] [Google Scholar]
- 35. Lecube A, Hernández C, Genescà J, Simó R. 2006. Glucose abnormalities in patients with hepatitis C virus infection epidemiology and pathogenesis. Diabetes Care 29:1140–1149 [DOI] [PubMed] [Google Scholar]
- 36. Mason AL, et al. 1999. Association of diabetes mellitus and chronic hepatitis C virus infection. Hepatology 29:328–333 [DOI] [PubMed] [Google Scholar]
- 37. Mohseni M, Park BH. 2010. PIK3CA and KRAS mutations predict for response to everolimus therapy: now that's RAD001. J. Clin. Invest. 120:2655–2658 [DOI] [PMC free article] [PubMed] [Google Scholar]
- 38. Moucari R, et al. 2008. Insulin resistance in chronic hepatitis C: association with genotypes 1 and 4, serum HCV RNA level, and liver fibrosis. Gastroenterology 134:416–423 [DOI] [PubMed] [Google Scholar]
- 39. Ray RB, Meyer K, Ray R. 2000. Hepatitis C virus core protein promotes immortalization of primary human hepatocytes. Virology 271:197–204 [DOI] [PubMed] [Google Scholar]
- 40. Saucedo LJ, et al. 2003. Rheb promotes cell growth as a component of the insulin/TOR signalling network. Nat. Cell Biol. 5:566–571 [DOI] [PubMed] [Google Scholar]
- 41. Shintani Y, et al. 2004. Hepatitis C virus infection and diabetes: direct involvement of the virus in the development of insulin resistance. Gastroenterology 126:840–848 [DOI] [PubMed] [Google Scholar]
- 42. Tamemoto H, et al. 1994. Insulin resistance and growth retardation in mice lacking insulin receptor substrate-1. Nature 372:182–186 [DOI] [PubMed] [Google Scholar]
- 43. Tremblay F, et al. 2007. Identification of IRS-1 Ser-1101 as a target of S6K1 in nutrient- and obesity-induced insulin resistance. Proc. Natl. Acad. Sci. U. S. A. 104:14056–14061 [DOI] [PMC free article] [PubMed] [Google Scholar]
- 44. Virkamaki A, Ueki K, Kahn CR. 1999. Protein-protein interaction in insulin signaling and the molecular mechanisms of insulin resistance. J. Clin. Invest. 103:931–943 [DOI] [PMC free article] [PubMed] [Google Scholar]
- 45. Withers DJ, et al. 1998. Disruption of IRS-2 causes type 2 diabetes in mice. Nature 391:900–904 [DOI] [PubMed] [Google Scholar]
- 46. Yi Z, et al. 2007. Global assessment of regulation of phosphorylation of insulin receptor substrate (IRS)-1 by insulin in vivo in human muscle. Diabetes 56:1508–1516 [DOI] [PubMed] [Google Scholar]
- 47. Zhang H, et al. 2003. Loss of Tsc1/Tsc2 activates mTOR and disrupts PI3K-Akt signalling through downregulation of PDGFR. J. Clin. Invest. 112:1223–1233 [DOI] [PMC free article] [PubMed] [Google Scholar]
- 48. Zhang Y, et al. 2003. Rheb is a direct target of the tuberous sclerosis tumour suppressor proteins. Nat. Cell Biol. 5:578–581 [DOI] [PubMed] [Google Scholar]
- 49. Zhang J, Gao Z, Yin J, Quon MJ, Ye J. 2008. S6K directly phosphorylates IRS-1 on Ser-270 to promote insulin resistance in response to TNF-(alpha) signaling through IKK2. J. Biol. Chem. 283:35375–35382 [DOI] [PMC free article] [PubMed] [Google Scholar]
- 50. Zick Y. 2001. Insulin resistance: a phosphorylation-based uncoupling of insulin signaling. Trends Cell Biol. 11:437–441 [DOI] [PubMed] [Google Scholar]