Abstract
While obstructive jaundice has been associated with a predisposition toward infections, the effects of bile duct ligation (BDL) on bulk intrahepatic T cells have not been clearly defined. The aim of this study was to determine the consequences of BDL on liver T cell phenotype and function. Following BDL in mice, we found that bulk liver T cells were less responsive to allogeneic or syngeneic antigen-loaded DC. Spleen T cell function was not affected and the viability of liver T cells was preserved. BDL expanded the number of CD4+CD25+FoxP3+ regulatory T cells (Treg), which were anergic to direct CD3 stimulation and mediated T cell suppression in vitro. Adoptively transferred CD4+CD25- T cells were converted into Treg within the liver following BDL. In vivo depletion of Treg following BDL restored bulk liver T cell function, but exacerbated the degrees of inflammatory cytokine production, cholestasis, and hepatic fibrosis. Thus, BDL expands liver Treg which reduce the function of bulk intrahepatic T cells yet limit liver injury.
INTRODUCTION
Bile duct ligation (BDL) is a well-established model of obstructive jaundice (1), a condition known to alter immunity and physiology. Obstructive jaundice leads to intrahepatic inflammation and fibrosis. Jaundiced patients are at increased risk for complications following surgical procedures (2-6), and suffer from significant metabolic (7, 8) and immunologic derangements (9-11), including altered proliferative responses among splenic and peripheral blood lymphocytes (10, 12). The effects of BDL on bulk liver T cells and Treg have not been defined. Regulatory T cells (Treg) have recently been suggested to contribute to the phenomenon of portal vein tolerance (13) and their presence in the liver has been well documented (14, 15). We speculated that liver Treg may further suppress intrahepatic T cell function in the setting of BDL.
Intrahepatic T cells produce high levels of immunomodulatory cytokines and are suppressed by their environment (16). In particular, liver T cells produce high levels of IL-4 and IL-10 and have an impaired response to DC in vitro and in vivo. Therefore, the normal liver may suppress T cell function via several mechanisms. Given the reduced function of peripheral lymphocytes following BDL (10, 11) and the baseline suppression of intrahepatic T cells (16), we hypothesized that BDL would further diminish intrahepatic T cell function, potentially related to alterations in Treg immunobiology. Herein, we investigated the effects of BDL on murine liver T cells. The results demonstrate that BDL alters the function of bulk liver T cells, accompanied by an expansion of liver Treg. Conversion of CD4+CD25- T cells to Treg in the liver was demonstrated, and depletion of Treg led to recovery of bulk liver T cell alloresponsiveness. Treg depletion also led to increased levels of cholestasis and intrahepatic inflammation. Therefore, liver Treg may play a dual role in the setting of obstructive jaundice by suppressing T cell function while limiting cholestasis and hepatic fibrosis.
MATERIALS AND METHODS
Mice
Adult 6-10 week old male C57Bl/6 (B6, H-2Kb) and Balb/c (H-2Kd) mice were purchased from Taconic Farms (Germantown, NY). OT-II TCR transgenic Rag-2-/- mice on a B6 background were also obtained from Taconic. FoxP3-GFP (C.Cg-Foxp3tm2Tch/J) mice were purchased from the Jackson Laboratory (Bar Harbor, ME). Animals were maintained in a pathogen-free facility at the Sloan-Kettering Institute or Roger Williams Hospital. Procedures were approved by the Institutional Animal Care and Use Committees (IACUC). Histologic sections with routine staining were performed at the Boston University Medical Center Experimental Pathology Service Core.
Surgical Procedures
Mice were anesthetized with intraperitoneal (i.p.) administration of ketamine (Fort Dodge Animal Health, Fort Dodge, Iowa) and xylazine (Lloyd Laboratories, Shenandoah, Iowa) or inhaled anesthetic. The abdomens were then shaved and prepared in sterile fashion. An upper-midline laparotomy incision was made and the common bile duct was ligated with 6-0 silk suture (Ethicon, Somerville, New Jersey). The peritoneum and fascia were closed with absorbable suture material, followed by skin clips. All steps excluding ligation of the bile duct were performed for sham operations. Criteria for successful BDL at the time of animal sacrifice included jaundiced soft tissues, patchy liver discoloration, and biliary tree dilation. Over 95% of operations met our criteria for successful BDL.
Cell Preparation
Liver nonparenchymal cells (NPC) were isolated as previously described, with modifications (17). Briefly, animals were euthanized and the portal vein was injected with 3 ml of 1% (wt/vol) collagenase IV (Sigma, St. Louis, MO) in HBSS. For serum chemistry analysis, blood was harvested from the heart prior to portal vein infusion. The liver was mechanically disrupted prior to incubation in 10 ml of 1% collagenase at 37°c for twenty minutes. The resulting cell suspension was passed through sterile 100 μm nylon mesh filters (Falcon, BD Biosciences) and centrifuged three times at 30g for 5 minutes to remove hepatocytes. The specimens were pelleted (300 g × 7 minutes), red cells were lysed, and the remaining cells were washed in complete media (RPMI 1640, 10% FBS, 2mM L-glutamine, 0.1% 2-mercaptoethanol, 100 u/ml penicillin, 100 ug/ml streptomycin). The pellet containing NPC was resuspended in 3.0 ml of RPMI and then combined with 2.0 ml of 40% (wt/vol) Optiprep (Sigma) to remove debris and enrich the cells. The suspension was layered under 4 ml of GBSS and spun at 500g for 15 minutes. The cell layer at the interface was then harvested. Splenocyte suspensions were prepared by morselizing the tissue, and filtering through a 70 μm nylon membrane (Falcon). Liver NPC or splenocytes were incubated with 1μg of anti-FcγR III/II monoclonal antibody 2.4G2 (Fc block; Monoclonal Antibody Core Facility, Sloan-Kettering Institute, NY) per 1×10⁶ cells and then fractionated based on Thy1.2 [CD90.2] or CD11c expression using immuno-magnetic beads (Miltenyi Biotech, Auburn, CA) and two positive selection columns (Miltenyi). Cells were then counted and nonviable cells were identified by uptake of Trypan Blue (Sigma). The following definitions were used for analysis and to purify cells: bulk T cells (Thy 1.2+), CD4 T cells (Thy1.2+CD4+CD8-NK1.1-CD1d/α-galactosyl ceramide-γδ-), and Treg (Thy1.2+CD4+ CD25+ for functional studies and CD3+CD4+CD25+FoxP3+ for phenotype). The purity of sorted cell populations was typically greater than 97%.
Flow cytometry
Flow cytometry was performed on FACScan or LSR-II flow cytometers (BD Biosciences). Voltages were set based on unstained cells and compensation was adjusted using single-stained controls. Samples were incubated with Fc block prior to staining with antibodies against CD3 [145-2C11], CD4 [RM4-4], CD8 [53-6.7], CD25 [2A3], CD27 [LG.3A10], CD69 [FN50], NK1.1 [PK136], γδ TCR [GL3], GITR [DTA-1], and FoxP3 [FJK-16s] which were conjugated to fluorescein isothiocyanite (FITC), phycoerythrin (PE), peridinin chlorophyll-a protein (PerCP), allophycocyanin (APC), APC-Cy7, or PE-Cy7 (BD Biosciences). Cellular fixation and permeabilization for intracellular FoxP3 staining was performed following extracellular marker staining as instructed (BD Biosciences). NK1.1- NKT cells were excluded during some analyses (Figures 1D and 4) and FACS by identifying them with a CD1d:Ig fusion protein (BD Biosciences) loaded with α-galactosylceramide (α-GalCer, Kirin, Tokyo, Japan), which was secondarily stained with anti-mouse IgG1 FITC (BD Biosciences) according to the manufacturer's protocol. Dead cells were excluded with 7-amino-actinomycin-D (7-AAD, BD Biosciences) and apoptotic cells were stained with Annexin-V per the manufacturer's protocol (BD Biosciences).
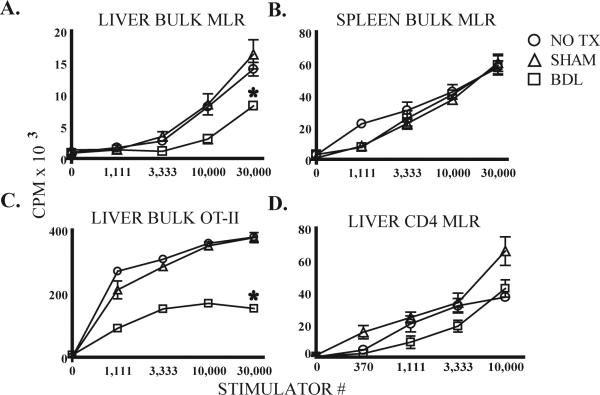
Figure 1. Liver bulk T cells are suppressed following BDL.
B6 mice underwent bile duct ligation (BDL), sham laparotomy (SHAM), or no treatment (NO TX). After 7 days, T cells were stimulated with DC. Bulk liver (A) but not spleen (B) T cell function in MLR was suppressed by BDL. Similar findings were noted when liver T cells from OT-II mice 7 days after BDL were stimulated with OVA-loaded syngeneic DC (C). The conventional CD4 (CD25-NK1.1-CD1d/αGalCer-γδ-) T cell response to allogeneic DC was not affected by BDL (D). Proliferation of T cells or DC cultured alone was negligible. Means and standard deviations are shown based on triplicate wells and the data are representative of 3 or more repetitions with 3 or more livers pooled per group. *p<0.05
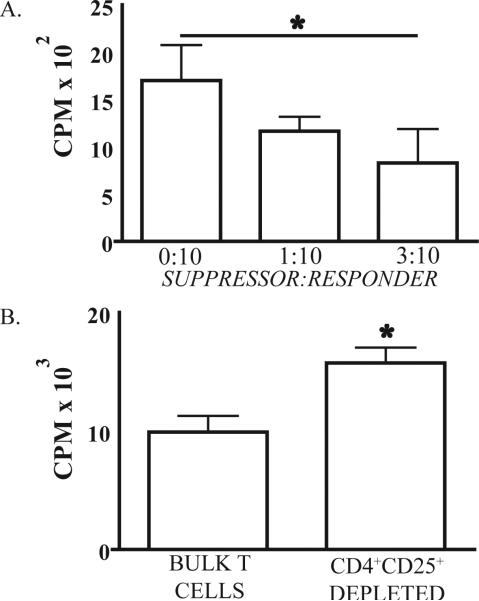
Figure 4. Liver CD4+ CD25+ T cells from BDL treated mice have suppressive properties.
(A) 1 × 10⁴ CD4+CD25- liver T cells and varying numbers of CD4+CD25+ T cells from BDL mice were cultured with 5 × 10³ splenic DC from Balb/c mice in a 3 day mixed leukocyte reaction (MLR). CD4+CD25- and CD4+CD25+ liver T cells were purified from the same jaundiced animals. (B) From BDL mice, 5 × 10⁴ bulk liver T cells or bulk liver T cells sorted to exclude CD4+CD25+ cells were cultured with 3 × 10⁴ splenic DC from Balb/c mice in a 3 day MLR. Proliferation of T cells or DC cultured alone was negligible. Mean and standard deviation are shown based on triplicate wells and the data are representative of 2 repetitions with three or more livers pooled in each group. *p<0.05
T cell stimulation assays
Mixed leukocyte reactions (MLRs) were performed as previously described (16) by culturing splenic DC from Balb/c mice with B6 T cells. CD4+CD25+ T cells were excluded by FACS or added in varying concentrations for some experiments. In vitro antigen-specific CD4 T cell activation was assayed with OT-II transgenic T cells specific for OVA(18). Bulk OT-II T cells were co-cultured with OVA323-339-loaded DC. For T cell stimulation in the absence of antigen presenting cells (APCs), 1 × 10⁵ bulk T cells or 1 × 10⁴ CD4+CD25- or CD4+CD25+ T cells were cultured in 96-well flat-bottom plates (Falcon) with anti-CD28 (20 μg/ml) and plate-bound anti-CD3 (BD Biosciences). Cell proliferation was measured by pulsing with 3H-thymidine (1 μCi/well) on day 3 or flow cytometry to measure CFSE dissolution. When CFSE was used, cells were labeled according to the manufacturer's protocol (Invitrogen, Carlsbad, CA). Supernatant was harvested from triplicate wells for cytokine measurement with cytometric bead array (BD Biosciences).
In vivo experiments
Treg were targeted by administration of 100μg of anti-CD25 (PC61, BD Biosciences), anti-GITR (DTA1, BD), or normal saline i.p. on days -1, 0, 5, and 7 relative to BDL or SHAM. For Treg conversion assays, CD4+CD25- B6 splenocytes were isolated using immunomagnetic beads (Miltenyi) and 1 ×10⁶ CFSE+CD4+CD25- splenocytes were then adoptively transferred via portal vein following BDL or SHAM. Portal vein injections were carried out via 30-gauge needles using volumes of 200μl. A 3 × 3 mm piece of Surgicel (Ethicon) was applied to the portal vein puncture site and direct pressure applied for 60 seconds to achieve hemostasis.
Statistics
Statistical analyses were performed using a two-tailed t test (Prism 5.00 for Windows, GraphPad Software, San Diego California USA). p<0.05 was deemed statistically significant.
RESULTS
Bile duct ligation impairs bulk liver T cell function
We performed BDL in mice and tested the function of bulk T cells (all Thy1.2+ liver NPC) in vitro. Seven days after BDL, bulk liver T cells had a diminished response to allogeneic DC (Figure 1A). Similar impairment of liver T cell function was apparent as early as 3 and as long as 12 days (not shown). Longer time points could not be reliably evaluated as most mice did not survive beyond 12 days after BDL. Thus, we chose to examine the effects of BDL at day 7 for our subsequent analyses. The effects of BDL were specific to liver T cells, as the alloproliferation of bulk spleen T cells was unaffected (Figure 1B). We also investigated whether BDL affected the CD4 T cell antigen-specific response by performing BDL in OT-II mice. Following BDL, the ability of OT-II bulk liver T cells to mount a response to OVA-loaded syngeneic DC was impaired (Figure 1C).
Although bulk liver cells had diminished function following BDL, it was unclear if the intrinsic function of CD4 T cells was altered or if other cells in the bulk liver T cell population were mediating a suppressive effect. We focused on conventional liver CD4 T cells for this experiment given our previous finding that these cells are suppressed within their native environment (16). Conventional CD4 T cells were prepared by excluding potentially suppressive NKT, Treg, and γδ T cells. Treg were excluded by elimination of CD4+CD25+ T cells (19-21). We found that the alloproliferation of conventional CD4 cells was not significantly affected by BDL (Figure 1D). Similarly, the responsiveness of liver conventional CD4 cells to direct CD3 stimulation was not diminished following BDL (not shown). Of note, Annexin-V staining and DAPI uptake by bulk liver T cells were not altered following BDL seven days following operation (not shown).
BDL results in an expansion of liver Treg
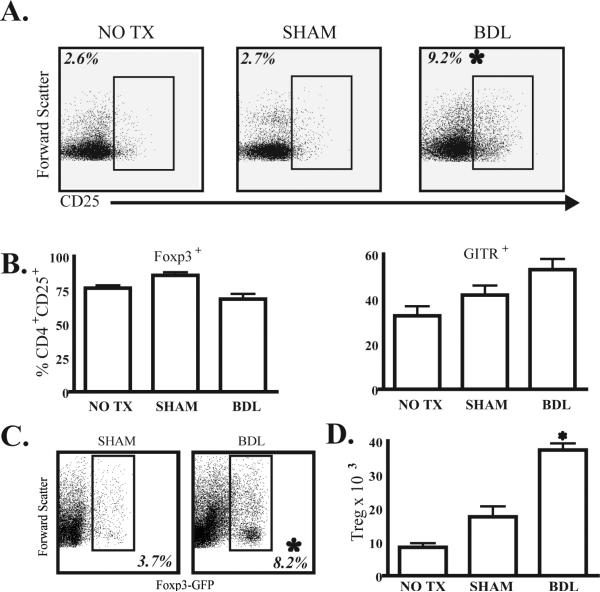
Having found that BDL impaired the bulk liver T cell population but not conventional liver CD4 T cells, we speculated that a sub-population of liver T cells was mediating a suppressive effect. We focused on liver Treg given their known suppressive properties in other models (14, 22). While the overall number of liver NPC and bulk T cells was not affected by BDL, the proportion of CD4+CD25+ T cells within the liver increased three-fold (Figure 2A). An increase in CD4+CD25+ liver T cells was also observed in the livers of OT-II mice following BDL (not shown). Although we found that the frequency of CD4+CD25+ liver T cells was consistently increased after BDL, we considered that CD25 expression may be upregulated nonspecifically. We measured the percentage of CD4+CD25+ T cells that also expressed FoxP3 and GITR, which are indicators of Treg in mice (19, 23). The majority of CD4+CD25+ liver T cells expressed FoxP3 and GITR (Figure 2B) and we also confirmed liver Treg expansion in FoxP3-GFP transgenic mice (Figure 2C). The Treg expansion in the liver following BDL was verified by a significant increase in the absolute cell count as well (Figure 2D). We also determined that the majority of liver CD4+CD25+ T cells were Treg on the basis of FoxP3 expression in OT-II mice (not shown), consistent with the work of other groups (24, 25).
Figure 2. BDL expands liver regulatory T cells in B6 mice.
(A) Flow cytometry was used to determine the frequency of CD25+ lymphocytes among the liver CD4 T cell (CD3+CD4+NK-γδ-) population at 7 days following BDL. CD25 gating was based on negative isotype control staining. (B) To determine the proportion of the CD4+CD25+ liver T cell population that were actually Treg, we measured the levels of FoxP3 and GITR expression among these cells in all three groups. (C) Liver Treg expansion following BDL was confirmed in FoxP3-GFP mice, in which all FoxP3+ cells co-express GFP. We gated upon viable CD3+CD4+ liver T cells to determine the proportion of cells expressing GFP and hence FoxP3. (D) The total number of CD4+CD25+FoxP3+ cells per liver is shown. Percentages and absolute numbers are means from 3 animals per group and are representative of 2-3 repetitions. *p<0.05
CD4+ CD25- T cells convert to Treg within the liver following BDL
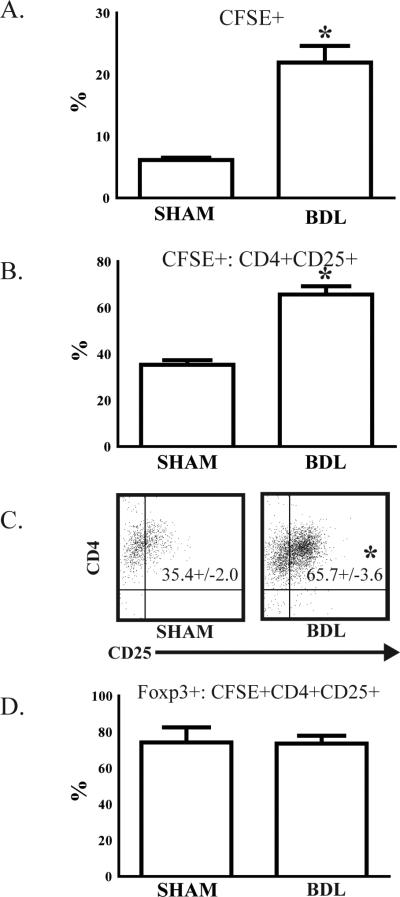
The above data demonstrate an increased number of liver Treg following BDL. To determine if Treg are derived from peripheral conversion within the liver, CFSE-labeled CD4+CD25-syngeneic T cells were adoptively transferred via the portal vein during BDL or SHAM procedures. On day 7, livers were harvested and adoptively transferred CFSE+ cells were analyzed by flow cytometry. Jaundiced mice had a significantly higher percentage of CFSE+ adoptively transferred cells among bulk liver T cells (Figure 3A). When compared to SHAM livers, a nearly two-fold higher proportion of adoptively transferred CFSE+CD4+CD25- T cells converted to a Treg phenotype (CD4+CD25+) following BDL (Figure 3B and 3C). We confirmed that over 70% of converted CD4+CD25+ T cells expressed FoxP3+ in both BDL and SHAM groups (Figure 3D).
Figure 3. Liver Treg expansion is due in part to conversion of CD4+ CD25- T cells.
To determine if liver Treg were derived from CD4 T cell precursors following BDL, CD4+CD25-splenic T cells were isolated from B6 mice, labeled with CFSE, and then (1 × 10⁶) adoptively transferred via the portal vein at the time of BDL or SHAM. After 7 days, liver T cells were harvested and analyzed by flow cytometry. (A) The proportion of CFSE+ adoptively transferred cells among bulk (Thy1.2+) liver T cells was significantly higher following BDL. (B & C) To determine the proportion of adoptively transferred cells that adopted a Treg phenotype, we measured CD25 expression among CFSE+ cells. (D) FoxP3 expression was confirmed in isolated, converted CD4+CD25+ T cells. Representative of two repetitions with 3 mice per group. *p<0.05
Liver CD4+ CD25+ T cells demonstrate suppressive function following BDL
We next sought to determine if CD4+CD25+ liver T cells following BDL possessed Treg functional properties. We chose to measure Treg inhibition of MLR, a known suppressive effect of Treg (26). To this end, we cultured CD4+CD25- T cells with varying numbers of CD4+CD25+ T cells from BDL livers in the presence of allogeneic DC. We found that CD4+CD25+ T cells, isolated from BDL treated animals, were able to suppress the response of CD4+CD25- T cells to allogeneic DC (Figure 4A). CD4+CD25+ liver T cells isolated from control animals did not demonstrate suppressive function (not shown). To further validate these findings, we performed the converse experiment by eliminating CD4+CD25+ T cells from bulk liver T cells purified from jaundiced animals. Removal of CD4+CD25+ T cells from the bulk T cell population led to a restoration of alloproliferation (Figure 4B). Liver CD4+CD25+ T cells from BDL mice also demonstrated relative hyporesponsiveness to direct CD3/CD28 stimulation when compared to CD4+CD25- T cells from the same animals (not shown).
In vivo depletion of Treg results in recovery of bulk liver T cell function
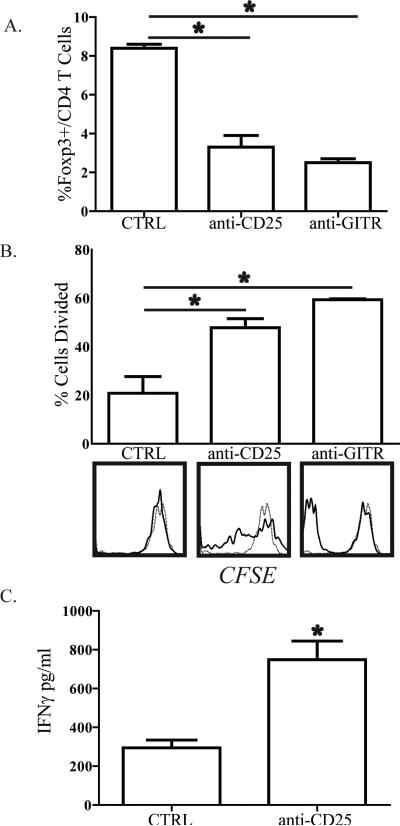
To determine if the presence of Treg in the liver following BDL was necessary for ex vivo bulk liver T cell dysfunction, we depleted Treg in mice subjected to BDL. Anti-CD25 or anti-GITR antibody was administered i.p. on days -1, 0, 5, and 7 relative to BDL or SHAM operations. On day 8, animals were sacrificed and bulk liver T cells were isolated and labeled with CFSE prior to stimulation with allogeneic DC. The efficiency of depleting Treg with either anti-CD25 or anti-GITR was confirmed (Figure 5A). Bulk liver T cells isolated from animals treated with anti-CD25 demonstrated improved responsiveness to stimulation by allogeneic DC compared to control mice with intact Treg populations (Figure 5B). We confirmed these findings by measuring IFNγ levels in the supernatant from the MLR assays. Bulk liver T cells produced significantly higher levels of IFNγ when isolated from jaundiced mice having been treated with anti-CD25 (Figure 5C). Treatment of mice with anti-GITR also resulted in markedly enhanced ex vivo bulk liver T cell alloresponsiveness following BDL (Figure 5B). The positive functional effects of anti-CD25 and anti-GITR treatments were not apparent in bulk liver T cells isolated from SHAM mice (not shown).
Figure 5. In vivo depletion of regulatory T cells restores bulk liver T cell function following BDL.
B6 mice were treated with 100μg of anti-CD25 (PC61) or anti-GITR (DTA1) i.p. on days -1, 0, 5, and 7 in relation to BDL. On D8, livers were harvested and Thy1.2+ bulk T cells were isolated for confirmation of depletion or labeled with CFSE and co-cultured with allogeneic splenic DC. After 72-96 hours of co-culture, T cells were analyzed by flow cytometry to measure the (A) percentage of FoxP3+ cells among CD4 T cells remaining after depletion and (B) proliferation by CFSE dissolution. For proliferation data, the bar graphs show percentage of cells that divided. On the histograms, solid lines represent T cells stimulated with DC and the dashed lines unstimulated T cells. (C) IFNγ in supernatants from the anti-CD25 depletion experiment was analyzed by cytometric bead array confirm enhanced T cell function following Treg depletion. Data are representative of 3 independent experiments.
Depletion of Treg promotes a pro-inflammatory cytokine profile among liver T cells
To determine the physiologic impact of Treg expansion in the setting of obstructive jaundice, we measured cytokine production by liver T cells with or without Treg depletion. When Treg were depleted from B6 mice subjected to BDL, bulk liver T cells made significantly lower levels of IL-10 after allogeneic stimulation (Figure 6A). In contrast, bulk liver T cell IL-6 production was enhanced following Treg depletion in jaundiced animals (Figure 6B).
Figure 6. Liver Treg depletion results in diminished IL-10 but increased IL-6 production from liver T cells following bile duct ligation.
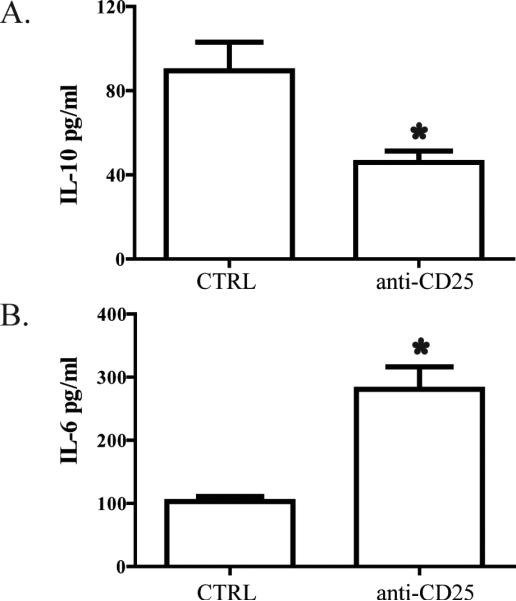
B6 mice were treated with 100μg of anti-CD25 (PC61) i.p. on days -1, 0, 5, and 7 in relation to BDL. On D8, liver bulk T cells were harvested and co-cultured with allogeneic splenic DC for 3-5 days. Supernatant was harvested and (A) IL-10 or (B) IL-6 were measured by cytometric bead array. Data are representative of two independent experiments.
Treg depletion exacerbates cholestasis and hepatic fibrosis following BDL
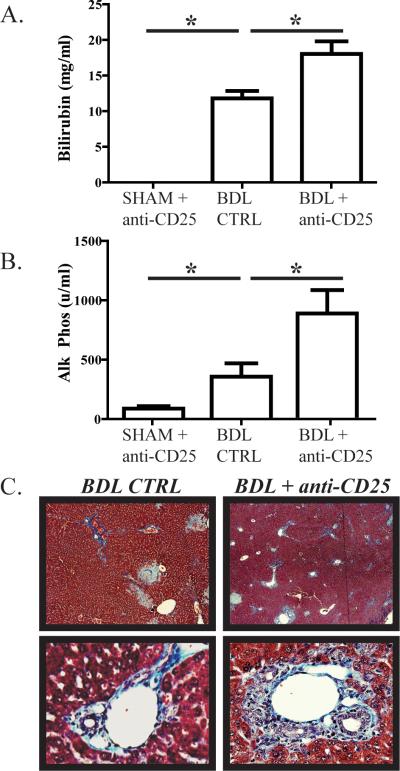
We next determined if the more inflammatory cytokine profile of liver T cells following Treg depletion in jaundiced animals was associated with measurable increases in intrahepatic cholestasis and fibrosis. Following BDL, serum bilirubin levels were significantly higher when Treg were depleted (Figure 7A). Alkaline phosphatase levels increased nearly two-fold following BDL as a consequence of Treg depletion (Figure 7B). The exacerbation of intrahepatic inflammation associated with Treg depletion was confirmed histologically through demonstration of greater degrees of infiltration by inflammatory cells and peri-portal fibrosis using Mallory's trichrome stain (Figure 7C).
Figure 7. Liver Treg depletion exacerbates biliary tract injury and cholestasis during obstructive jaundice.
B6 mice were treated with 100μg of anti-CD25 (PC61) i.p. on days -1, 0, 5, and 7 in relation to BDL. On day 8, animals were sacrificed for blood collection and histologic assessment of liver tissue. When Treg were depleted, BDL resulted in significantly higher serum bilirubin (A) and alkaline phosphatase (B) levels. (C) Liver tissue analyzed with Mallory's trichrome stain to demonstrate collagen confirmed that Treg depletion resulted in excessive peri-portal fibrosis and infiltration with inflammatory cells. Images shown are at 100X (top row) and 200X magnification (bottom row).
DISCUSSION
Our data demonstrate that obstructive jaundice suppresses bulk liver T cell function in association with an expansion of Treg, which modulate the extent of cholestasis and fibrosis. The expansion of liver Treg was due, at least in part, to conversion of CD4+CD25- T cells into cells with a Treg phenotype (CD4+CD25+FoxP3+). The suppressive function of expanded liver Treg was demonstrated in vitro and in vivo. While Treg expansion adversely affected the function of bulk liver T cells, Treg protected the liver parenchyma by limiting the degrees of cholestasis and fibrosis, in addition to altering cytokine production by bulk liver T cells. Taken together, our results implicate liver Treg as mediators of immunosuppression and modulators of liver injury in the setting of biliary obstruction.
Biliary obstruction has been associated with numerous systemic and intrahepatic derangements, including immunologic dysfunction (2-4, 7, 8, 27, 28). While jaundice has been shown to alter the function of splenic and peripheral blood lymphocytes, the effect of biliary obstruction on bulk intrahepatic T cells is less clear. Our data demonstrate that the function of bulk liver T cells is suppressed following BDL in association with an expansion of intrahepatic Treg. As depletion of Treg with either anti-CD25 or anti-GITR led to a restoration of bulk liver T cell function when tested ex vivo, we speculate that Treg play a critical role in mediating suppression of liver T cells in the setting of obstructive jaundice. While, depletion of Treg with either anti-CD25 (29) or anti-GITR (30) restored bulk liver T cell function, the degree of intrahepatic inflammation was exacerbated. These functional results corroborate our phenotype studies suggesting that the majority of expanded CD4+CD25+ liver T cells are in fact Treg (19, 23, 31). We did not find a significant difference between anti-CD25 and anti-GITR terms of Treg depletion efficiency or restoration of T cell alloresponsiveness (Figure 5).
The suppressive function of the expanded liver CD4+CD25+ T cells was confirmed by multiple, independent in vivo and in vitro experiments . Liver CD4+CD25+ T cells from BDL livers demonstrated the ability to suppress the in vitro proliferation of CD4+CD25- T cells in response to DC (Figure 4A and 4B) and anti-CD3/anti-CD28 (not shown), similar to prior reports (32-34). CD4+CD25+ liver T cells isolated from control animals did not demonstrate suppression (not shown). Enhanced Treg suppressor function in the setting of intrahepatic inflammation was demonstrated in a study involving Concanavalin A-induced liver injury (14). Therefore, in the setting of either BDL or Concanavalin A-induced liver injury, liver Treg may acquire enhanced suppressive function. This is also supported by our in vivo experiment in which Treg depletion led to enhanced ex vivo bulk liver T cell function in BDL but not SHAM mice.
Suppression of bulk liver T cell function following BDL may be disadvantageous from the standpoint of vulnerability to infection, but the expansion of Treg may benefit the host by ameliorating the degree of intrahepatic cholestasis and fibrosis. Depletion of Treg in mice subjected to BDL resulted in significantly higher levels of serum alkaline phosphatase and bilirubin, suggesting that Treg modulated the extent of intrahepatic inflammation (Figure 7). Histologic analysis of liver tissue following BDL with or without Treg depletion revealed that the degree of fibrosis was higher in mice treated with the anti-CD25 antibody. Similarly, treatment with anti-GITR resulted in increased levels of intrahepatic fibrosis (not shown). The increased damage to liver tissue following Treg depletion in jaundiced mice was accompanied by increased IL-6 and decreased IL-10 production by bulk liver T cells (Figure 6). While other cytokines may be ultimately implicated as well, our data suggest that alterations in IL-6 and IL-10 levels contribute to the modulation of intrahepatic inflammation by Treg in the setting of biliary obstruction.
While we cannot fully account for the source of expanded Treg in jaundiced mice, our data indicate that intrahepatic conversion of CD4+CD25- T cells into Treg occurred. A significantly higher proportion of adoptively transferred CD4+CD25- T cells converted to Treg following BDL compared to SHAM based upon expression of CD25 and FoxP3 (Figure 6). Our data do not, however, exclude that migration of Treg into the liver occurred as well. Treg have been demonstrated to migrate across the hepatic sinusoidal endothelium and therefore an influx of Treg from extrahepatic sources may have contributed to the expansion found in our model of obstructive jaundice (35).
Our findings with BDL and depletion of Treg suggest that liver Treg mediated suppressive effects in vivo within the liver. While these data lend support to the importance of Treg in mediating liver T cell suppression in the setting of obstructive jaundice, other cell types likely contribute to liver T cell suppression as well. Recently, invariant natural killer T cells have been purported to modulate the inflammatory milieu following BDL (36). We did not find an increase in the proportion of NKT, but BDL resulted in an expansion of γδ T cells (not shown), which we previously demonstrated to have suppressive properties (16). We also did not directly study the effect of BDL on other liver NPC such as DC, LSEC, and Kupffer cells. It is possible that these cell types may mediate additional effects, as we have found DC to become activated following BDL (1). There are other potential explanations for our findings that liver T cell function is altered following BDL. Bile acids and bilirubin accumulate in the liver following BDL and mediate direct effects (37, 38). It is likely that the functional changes observed among liver T cells are due to several alterations within the intrahepatic environment and an expansion of Treg represents but one contributing factor. In addition, Treg may also have direct or indirect suppressive effects on DC through alterations in the intrahepatic cytokine milieu (39).
BDL has been associated with an increase in systemic inflammatory cytokines (40) and bacterial translocation (28). We did find bacteria to be present in the blood and bile following BDL, in addition to enhanced production of IL-6 and MCP-1 by bulk liver T cells (not shown). Whether Treg depletion with the associated alterations in IL-6 and IL-10 levels prevents bacteremia and bactibilia remains to be determined. While biliary obstruction appears to have systemic effects, alterations in T cell function or phenotype were specific to the liver in our study. Previous reports have indicated that BDL results in functional impairment of both spleen and peripheral blood T lymphocytes (10, 12). However, we did not detect functional changes in spleen T cells following BDL (Figure 1B). Other groups studied rats instead of mice (12) or studied the response of spleen T cells to phytohemaglutinin and not DC (10-12). In addition, our method of T cell isolation from the liver or spleen differed from other groups. Consistent with our data, another group reported that inflammation resulted in Treg expansion in the liver but not the spleen (41). Given that the inflammatory consequences of BDL (Figure 6) are predominantly detected in the liver, it is not surprising that the immunologic sequelae are most pronounced in the liver as well.
Taken together, our data demonstrate that BDL in mice affects the function of intrahepatic T cells in association with an expansion of Treg. In particular, bulk liver T cells have a diminished response to DC. These alterations are accompanied by an increase in Treg which was found to be related to a conversion of CD4+CD25- cells. Depletion of Treg led to recovery of bulk liver T cell function but an increase in cholestasis and fibrosis, which were associated with significant changes in IL-6 and IL-10 production. These findings suggest that, in the setting of obstructive jaundice, liver Treg may negatively impact intrahepatic immunity while limiting the detrimental effects of the associated inflammatory response. A more detailed understanding of the mechanisms underlying these observations may allow for clinically useful immunomodulatory strategies in the setting of biliary occlusion.
Acknowledgments
We would like to thank the Kirin Brewery Co., LTD for providing the α-GalCer compound and Dr. Angela Darko of the Department of Pathology at Roger Williams for assisting with interpretation of our histologic data.
Grant Support:
This work was supported by T32CA09501 (UIC) and DK068346 (RPD).
REFERENCES
- 1.Bleier JI, Katz SC, Chaudhry UI, Pillarisetty VG, Kingham TP, 3rd, Shah AB, Raab JR, DeMatteo RP. Biliary obstruction selectively expands and activates liver myeloid dendritic cells. J Immunol. 2006;176:7189–7195. doi: 10.4049/jimmunol.176.12.7189. [DOI] [PubMed] [Google Scholar]
- 2.Armstrong CP, Dixon JM, Duffy SW, Elton RA, Davies GC. Wound healing in obstructive jaundice. Br J Surg. 1984;71:267–270. doi: 10.1002/bjs.1800710405. [DOI] [PubMed] [Google Scholar]
- 3.Bailey ME. Endotoxin, bile salts and renal function in obstructive jaundice. Br J Surg. 1976;63:774–778. doi: 10.1002/bjs.1800631011. [DOI] [PubMed] [Google Scholar]
- 4.Jiang WG, Puntis MC. Immune dysfunction in patients with obstructive jaundice, mediators and implications for treatments. HPB Surg. 1997;10:129–142. doi: 10.1155/1997/49076. [DOI] [PMC free article] [PubMed] [Google Scholar]
- 5.Greig JD, Krukowski ZH, Matheson NA. Surgical morbidity and mortality in one hundred and twenty-nine patients with obstructive jaundice. Br J Surg. 1988;75:216–219. doi: 10.1002/bjs.1800750309. [DOI] [PubMed] [Google Scholar]
- 6.Dixon JM, Armstrong CP, Duffy SW, Davies GC. Factors affecting morbidity and mortality after surgery for obstructive jaundice: a review of 373 patients. Gut. 1983;24:845–852. doi: 10.1136/gut.24.9.845. [DOI] [PMC free article] [PubMed] [Google Scholar]
- 7.Starnes HF, Jr., Conti PS, Warren RS, Jeevanandam M, Brennan MF. Altered peripheral amino acid uptake in obstructive jaundice. J Surg Res. 1987;42:383–393. doi: 10.1016/0022-4804(87)90173-9. [DOI] [PubMed] [Google Scholar]
- 8.Younes RN, Vydelingum NA, Derooij P, Scognamiglio F, Andrade L, Posner MC, Brennan MF. Metabolic alterations in obstructive jaundice: effect of duration of jaundice and bile-duct decompression. HPB Surg. 1991;5:35–48. doi: 10.1155/1991/27457. [DOI] [PMC free article] [PubMed] [Google Scholar]
- 9.Greve JW, Gouma DJ, Soeters PB, Buurman WA. Suppression of cellular immunity in obstructive jaundice is caused by endotoxins: a study with germ-free rats. Gastroenterology. 1990;98:478–485. doi: 10.1016/0016-5085(90)90841-n. [DOI] [PubMed] [Google Scholar]
- 10.Pinto M, Kaplun A. Immune status in mice with experimental biliary obstruction. Clin Immunol Immunopathol. 1980;16:396–405. doi: 10.1016/0090-1229(80)90181-6. [DOI] [PubMed] [Google Scholar]
- 11.Thompson RL, Ranjbar S, Rowlands BJ. T-lymphocyte transformation in experimental obstructive jaundice: the role of serum-suppressive factors. World J Surg. 1993;17:783–785. doi: 10.1007/BF01659096. [DOI] [PubMed] [Google Scholar]
- 12.Thompson RL, Hoper M, Diamond T, Rowlands BJ. Development and reversibility of T lymphocyte dysfunction in experimental obstructive jaundice. Br J Surg. 1990;77:1229–1232. doi: 10.1002/bjs.1800771112. [DOI] [PubMed] [Google Scholar]
- 13.He F, Chen Z, Xu S, Cai M, Wu M, Li H, Chen X. Increased CD4+CD25+Foxp3+ regulatory T cells in tolerance induced by portal venous injection. Surgery. 2009;145:663–674. doi: 10.1016/j.surg.2009.01.016. [DOI] [PubMed] [Google Scholar]
- 14.Erhardt A, Biburger M, Papadopoulos T, Tiegs G. IL-10, regulatory T cells, and Kupffer cells mediate tolerance in concanavalin A-induced liver injury in mice. Hepatology. 2007;45:475–485. doi: 10.1002/hep.21498. [DOI] [PubMed] [Google Scholar]
- 15.Kobayashi N, Hiraoka N, Yamagami W, Ojima H, Kanai Y, Kosuge T, Nakajima A, Hirohashi S. FOXP3+ Regulatory T Cells Affect the Development and Progression of Hepatocarcinogenesis. Clin Cancer Res. 2007;13:902–911. doi: 10.1158/1078-0432.CCR-06-2363. [DOI] [PubMed] [Google Scholar]
- 16.Katz SC, Pillarisetty VG, Bleier JI, Kingham TP, Chaudhry UI, Shah AB, DeMatteo RP. Murine liver CD4 T cells are functionally distinct and suppressed by environmental factors. Hepatology. 2005;42:293–300. doi: 10.1002/hep.20795. [DOI] [PubMed] [Google Scholar]
- 17.Pillarisetty VG, Katz SC, Bleier JI, Shah AB, Dematteo RP. Natural killer dendritic cells have both antigen presenting and lytic function and in response to CpG produce IFN-gamma via autocrine IL-12. J Immunol. 2005;174:2612–2618. doi: 10.4049/jimmunol.174.5.2612. [DOI] [PubMed] [Google Scholar]
- 18.Barnden MJ, Allison J, Heath WR, Carbone FR. Defective TCR expression in transgenic mice constructed using cDNA-based alpha- and beta-chain genes under the control of heterologous regulatory elements. Immunol Cell Biol. 1998;76:34–40. doi: 10.1046/j.1440-1711.1998.00709.x. [DOI] [PubMed] [Google Scholar]
- 19.Khattri R, Cox T, Yasayko SA, Ramsdell F. An essential role for Scurfin in CD4+CD25+ T regulatory cells. Nat Immunol. 2003;4:337–342. doi: 10.1038/ni909. [DOI] [PubMed] [Google Scholar]
- 20.Takahashi T, Tagami T, Yamazaki S, Uede T, Shimizu J, Sakaguchi N, Mak TW, Sakaguchi S. Immunologic self-tolerance maintained by CD25(+)CD4(+) regulatory T cells constitutively expressing cytotoxic T lymphocyte-associated antigen 4. J Exp Med. 2000;192:303–310. doi: 10.1084/jem.192.2.303. [DOI] [PMC free article] [PubMed] [Google Scholar]
- 21.Nakamura K, Kitani A, Strober W. Cell contact-dependent immunosuppression by CD4(+)CD25(+) regulatory T cells is mediated by cell surface-bound transforming growth factor beta. J Exp Med. 2001;194:629–644. doi: 10.1084/jem.194.5.629. [DOI] [PMC free article] [PubMed] [Google Scholar]
- 22.Wei HX, Chuang YH, Li B, Wei H, Sun R, Moritoki Y, Gershwin ME, Lian ZX, Tian Z. CD4+ CD25+ Foxp3+ regulatory T cells protect against T cell-mediated fulminant hepatitis in a TGF-beta-dependent manner in mice. J Immunol. 2008;181:7221–7229. doi: 10.4049/jimmunol.181.10.7221. [DOI] [PubMed] [Google Scholar]
- 23.Shimizu J, Yamazaki S, Takahashi T, Ishida Y, Sakaguchi S. Stimulation of CD25(+)CD4(+) regulatory T cells through GITR breaks immunological self-tolerance. Nat Immunol. 2002;3:135–142. doi: 10.1038/ni759. [DOI] [PubMed] [Google Scholar]
- 24.Thornton AM, Shevach EM. CD4+CD25+ immunoregulatory T cells suppress polyclonal T cell activation in vitro by inhibiting interleukin 2 production. J Exp Med. 1998;188:287–296. doi: 10.1084/jem.188.2.287. [DOI] [PMC free article] [PubMed] [Google Scholar]
- 25.Zhang X, Izikson L, Liu L, Weiner HL. Activation of CD25(+)CD4(+) regulatory T cells by oral antigen administration. J Immunol. 2001;167:4245–4253. doi: 10.4049/jimmunol.167.8.4245. [DOI] [PubMed] [Google Scholar]
- 26.Godfrey WR, Ge YG, Spoden DJ, Levine BL, June CH, Blazar BR, Porter SB. In vitro-expanded human CD4(+)CD25(+) T-regulatory cells can markedly inhibit allogeneic dendritic cell-stimulated MLR cultures. Blood. 2004;104:453–461. doi: 10.1182/blood-2004-01-0151. [DOI] [PubMed] [Google Scholar]
- 27.Scott-Conner CE, Grogan JB. The pathophysiology of biliary obstruction and its effect on phagocytic and immune function. J Surg Res. 1994;57:316–336. doi: 10.1006/jsre.1994.1151. [DOI] [PubMed] [Google Scholar]
- 28.Kuzu MA, Kale IT, Col C, Tekeli A, Tanik A, Koksoy C. Obstructive jaundice promotes bacterial translocation in humans. Hepatogastroenterology. 1999;46:2159–2164. [PubMed] [Google Scholar]
- 29.Setiady YY, Coccia JA, Park PU. In vivo depletion of CD4+FOXP3+ Treg cells by the PC61 anti-CD25 monoclonal antibody is mediated by FcgammaRIII+ phagocytes. Eur J Immunol. 2010;40:780–786. doi: 10.1002/eji.200939613. [DOI] [PubMed] [Google Scholar]
- 30.Coe D, Begom S, Addey C, White M, Dyson J, Chai JG. Depletion of regulatory T cells by anti-GITR mAb as a novel mechanism for cancer immunotherapy. Cancer Immunol Immunother. 2010;59:1367–1377. doi: 10.1007/s00262-010-0866-5. [DOI] [PMC free article] [PubMed] [Google Scholar]
- 31.Sakaguchi S, Sakaguchi N, Asano M, Itoh M, Toda M. Immunologic self-tolerance maintained by activated T cells expressing IL-2 receptor alpha-chains (CD25). Breakdown of a single mechanism of self-tolerance causes various autoimmune diseases. J Immunol. 1995;155:1151–1164. [PubMed] [Google Scholar]
- 32.Li L, Godfrey WR, Porter SB, Ge Y, June CH, Blazar BR, Boussiotis VA. CD4+CD25+ regulatory T-cell lines from human cord blood have functional and molecular properties of T-cell anergy. Blood. 2005;106:3068–3073. doi: 10.1182/blood-2005-04-1531. [DOI] [PMC free article] [PubMed] [Google Scholar]
- 33.Takahashi T, Kuniyasu Y, Toda M, Sakaguchi N, Itoh M, Iwata M, Shimizu J, Sakaguchi S. Immunologic self-tolerance maintained by CD25+CD4+ naturally anergic and suppressive T cells: induction of autoimmune disease by breaking their anergic/suppressive state. Int Immunol. 1998;10:1969–1980. doi: 10.1093/intimm/10.12.1969. [DOI] [PubMed] [Google Scholar]
- 34.Kubo T, Hatton RD, Oliver J, Liu X, Elson CO, Weaver CT. Regulatory T cell suppression and anergy are differentially regulated by proinflammatory cytokines produced by TLR-activated dendritic cells. J Immunol. 2004;173:7249–7258. doi: 10.4049/jimmunol.173.12.7249. [DOI] [PubMed] [Google Scholar]
- 35.Shetty S, Weston CJ, Oo YH, Westerlund N, Stamataki Z, Youster J, Hubscher SG, Salmi M, Jalkanen S, Lalor PF, Adams DH. Common Lymphatic Endothelial and Vascular Endothelial Receptor-1 Mediates the Transmigration of Regulatory T Cells across Human Hepatic Sinusoidal Endothelium. J Immunol. 2011;186:4147–4155. doi: 10.4049/jimmunol.1002961. [DOI] [PMC free article] [PubMed] [Google Scholar]
- 36.Wintermeyer P, Cheng CW, Gehring S, Hoffman BL, Holub M, Brossay L, Gregory SH. Invariant natural killer T cells suppress the neutrophil inflammatory response in a mouse model of cholestatic liver damage. Gastroenterology. 2009;136:1048–1059. doi: 10.1053/j.gastro.2008.10.027. [DOI] [PMC free article] [PubMed] [Google Scholar]
- 37.Gianni L, Di Padova F, Zuin M, Podda M. Bile acid-induced inhibition of the lymphoproliferative response to phytohemagglutinin and pokeweed mitogen: an in vitro study. Gastroenterology. 1980;78:231–235. [PubMed] [Google Scholar]
- 38.Taube M, Elliot P, Ellis H. Jaundice and wound healing: a tissue-culture study. Br J Exp Pathol. 1981;62:227–231. [PMC free article] [PubMed] [Google Scholar]
- 39.Veldhoen M, Moncrieffe H, Hocking RJ, Atkins CJ, Stockinger B. Modulation of dendritic cell function by naive and regulatory CD4+ T cells. J Immunol. 2006;176:6202–6210. doi: 10.4049/jimmunol.176.10.6202. [DOI] [PubMed] [Google Scholar]
- 40.Bemelmans MH, Gouma DJ, Greve JW, Buurman WA. Cytokines tumor necrosis factor and interleukin-6 in experimental biliary obstruction in mice. Hepatology. 1992;15:1132–1136. doi: 10.1002/hep.1840150626. [DOI] [PubMed] [Google Scholar]
- 41.Saeki C, Nakano M, Takahashi H, Saito S, Homma S, Tajiri H, Zeniya M. Accumulation of functional regulatory T cells in actively inflamed liver in mouse dendritic cell-based autoimmune hepatic inflammation. Clin Immunol. 135:156–166. doi: 10.1016/j.clim.2009.12.002. [DOI] [PubMed] [Google Scholar]


