

Abstract
Quiescence is a state of reversible cell cycle arrest that can grant protection against many environmental insults. In some systems, cellular quiescence is associated with a low metabolic state characterized by a decrease in glucose uptake and glycolysis, reduced translation rates and activation of autophagy as a means to provide nutrients for survival. For cells in multiple different quiescence model systems, including Saccharomyces cerevisiae, mammalian lymphocytes and hematopoietic stem cells, the PI3Kinase/TOR signaling pathway helps to integrate information about nutrient availability with cell growth rates. Quiescence signals often inactivate the TOR kinase, resulting in reduced cell growth and biosynthesis. However, quiescence is not always associated with reduced metabolism; it is also possible to achieve a state of cellular quiescence in which glucose uptake, glycolysis and flux through central carbon metabolism are not reduced. In this review, we compare and contrast the metabolic changes that occur with quiescence in different model systems.
Keywords: autophagy, glucose uptake, metabolism, quiescence, TOR
Introduction to Quiescence
Ensuring the continuity of life requires that individual cells and entire organisms can survive not only in ideal environments, but also in conditions of scarcity. When conditions are unfavorable for proliferation, many cells have the capacity to enter a non-dividing state, sometimes for years, while retaining their ability to reenter the proliferative cell cycle.1,2 This state of reversible cell cycle arrest, known as quiescence, is common and can be seen in stem cells, eggs and spores. Some quiescent cells are surprisingly hardy: they can survive long periods of nutrient starvation, cold temperatures and even desiccation. Entry into quiescence is often associated with dramatic changes in metabolism, defined as the uptake of nutrients and the use of these nutrients for the synthesis of macromolecules and energy. Indeed, proliferating and quiescent fibroblasts are expected to have very different metabolic requirements. While proliferating cells must devote much of their metabolic capacity to biosynthesis in order to create the material necessary to form a new cell, quiescent cells are relieved of this steep metabolic requirement. Many but not all quiescent cells respond by downregulating the synthesis of proteins and activating pathways that sustain them during periods of non-division.
Here we review the metabolic changes during quiescence in multiple model systems: bacteria, yeast, lymphocytes, hematopoietic stem cells, fibroblasts and cancer cells. Quiescent yeast and mammalian cells share a similar set of responses to conditions that are not suitable for proliferation: cell cycle arrest with 2N DNA content,1,3,4 condensed chromosomes,5 reduced rRNA synthesis,6 decreased translation,7 decreased cell size, activation of autophagy (described more fully below)8 and increased resistance to a variety of stresses.2 The signals for quiescence vary for different types of cells. Bacteria and yeast can enter stationary phase, a condition in which they cease cell growth and proliferation, in response to depletion of the glucose in their culture medium or in response to deprivation for a specific nutrient. In mammals, the proliferative state of individual cells is regulated by a host of factors that include not only the presence or absence of nutrients, but also cues from proliferative signaling molecules such as mitogens and situational cues. Quiescent T lymphocytes respond to stimulation of their T-cell receptor with the appropriate antigen by becoming activated, proliferating and secreting cytokines that participate in the immune response. Hematopoietic stem cells (HSCs) are also largely quiescent, but in response to cytokines, they will proliferate to form progeny that form the hematopoietic system. Dermal fibroblasts are typically quiescent, a state in which they secrete the extracellular matrix that forms the external environment. In response to a wound, the fibroblasts are activated, proliferate, migrate and coordinate a wound-healing response. Finally, there may be individual cells within a tumor mass that enter a quiescent or dormant state, possibly in response to a lack of nutrients, detachment from the substratum or hypoxia resulting from the lack of a blood supply. The reemergence of these cells from dormancy may contribute to tumor recurrence.
Cell cycle regulation in response to nutrient deprivation or quiescence cues is often mediated through cyclin-dependent kinase inhibitors. In yeast, the decision to commit to a cell cycle is made in START. Passing through START and entering S phase is regulated by the yeast cyclin-dependent kinase and its associated cyclins.9,10 When nutrients are limiting, Saccharomyces cerevisiae (S. cerevisiae) do not pass through START, but instead exit the mitotic cell cycle in early G1 and enter stationary phase. The cyclin-dependent kinase inhibitor SIC1 is an important regulator of S-phase entry.11 In mammalian cells, a complex between cyclin E and cdk2 is central for progression through G1. Quiescence signals such as the cytokine TGFβ, hormone withdrawal, serum starvation and contact inhibition result in the upregulation of cyclin-dependent kinase inhibitors, including p27Kip1 (reviewed in refs. 12–16). Cyclin-dependent kinase inhibitors also maintain cells in a quiescent state, as their elimination can result in inappropriate cell cycle entry.17,18
In this review, we will first describe the pathways that are important for the regulation of metabolism with quiescence. Then we will describe the metabolic changes associated with quiescence in the model systems listed above. We conclude by comparing and contrasting the metabolic profiles of different quiescent states.
Introduction to the Pathways that Control Metabolic State: TOR
One pathway that is critical for determining the metabolic state of cells is the highly evolutionarily conserved TOR (target of rapamycin) pathway (reviewed in refs. 19 and 20). Extracellular and intracellular information about the availability of nutrients and the cell’s energetic state are integrated into the TOR pathway, which then helps to define cell growth rates. When nutrients are plentiful, the TOR regulatory kinase phosphorylates and activates downstream targets that promote cell growth and increase cell size. When nutrients are scarce and in response to other triggers, the TOR pathway becomes inactive. Cells with inactive TOR reduce energy-intensive processes and induce catabolic programs that allow the cell to recover metabolites and energy from existing macromolecules to ensure their survival.
In mammalian cells, mTOR (mammalian target of rapamycin), in association with its cooperating proteins, phosphorylates targets that promote protein synthesis and cell growth.21 In mammals, there are two TOR proteins, mTORC1, which is sensitive to rapamycin, and mTORC2, which is not.19,22 mTORC1 plays an important role in promoting translation and two important targets of its kinase activity are 4E-BP1 and S6 kinase.23 Phosphorylation of 4E-BP1 releases its inhibition of eIF-4E,24 which can, in turn, recruit the translation initiation complex to 5' caps and increase cap-dependent translation rates.25,26 mTOR also phosphorylates and activates S6 kinase. S6K phosphorylates S6 protein of the 40S ribosomal subunit and other targets and activates translation.27-29 mTORC2, in contrast, phosphorylates and activates Akt (also called protein kinase B),19,30-32 which inhibits apoptosis and promotes survival. mTORC2 also targets proteins important for cytoskeletal organization.19,22,33 Excessive TOR activity results in increased cell growth,34,35 while TOR inhibition results in reduced cell growth and smaller cell size.34,35 The TOR proteins are conserved in yeast, and they perform a similar functional role through distinct targets as described further below.33,36
Introduction to Pathways that Regulate Metabolism: PI3K
The phosphatidylinositol-3-kinase (PI3K) pathway is the pathway through which extracellular insulin and growth factors affect mTOR activity and thereby modulate the cell’s metabolic state.37,38 PI3K phosphorylates the lipid phosphatidylinositol-4,5-bisphosphate to generate phosphatidylinositol-3,4,5-trisphosphate [PtdIns(3,4,5)P3], which creates lipid docking sites on the cytoplasmic face of the plasma membrane (Fig. 1). This activity is opposed by the dephosphorylating action of tumor suppressor PTEN phosphatase.39 The pro-survival kinase Akt can bind to PtdIns(3,4,5)P3 on the cytosolic face of the lipid membrane, become activated and phosphorylate downstream targets. Among the targets of Akt is the tuberous sclerosis complex (TSC), which it inhibits.40-42 TSC acts as a GTPase-activating protein and thereby inhibits the activity of the Rheb GTPase.43-45 Rheb, in turn, activates TOR.43,45-49 When nutrients are plentiful, Akt is active; TSC is inactive, and Rheb-GTPase activates mTOR. When nutrients are scarce, Akt is inactive; the TSC complex is active; Rheb is inhibited, and mTORC1 is inactivated.50,51 Mutations in the TSC complex result in constitutive activation of mTOR and tuberous sclerosis disease,40,41,52-55 an autosomal dominant disorder characterized by benign tumors affecting virtually all organ systems of the body.56

Figure 1. External factors induce cell growth and suppress autophagy via Akt and TOR. Upon stimulation by external factors, such as growth factors, the receptor tyrosine kinase is phosphorylated and recruits PI3K. PI3K phosphorylates PtdIns(4,5)P2 to PtdIns(3,4,5)P3, which then recruits PDK and Akt to the cell membrane. Akt, when phosphorylated by mTORC2 and PDK, inhibits TSC, which in turn inhibits Rheb. When activated, Rheb promotes mTORC1 action, which leads to an increase in biosynthesis and suppression of autophagy via ULK1. Thus, nutrient-rich conditions lead to high activity of PI3K, Akt, and mTORC1, while nutrient depletion causes reduced PI3K activity and a resulting decrease in mTORC1 activity.
mTOR activity is also responsive to intracellular energy levels, which are sensed by the Lkb1 kinase. A high ratio of AMP to ATP, indicative of an energy-depleted state, leads to activation of the tumor suppressor Lkb1. Lkb1 then activates AMPK and 12 other related kinases.57-60 AMPK restores cellular ATP levels through phosphorylation of key regulatory proteins involved in protein synthesis, fatty acid and glucose metabolism and glucose transport,61 resulting in a reduction in energy-intensive cellular activity. AMPK also phosphorylates TSC, which results in inactivation of mTOR and a decrease in biosynthesis when the cell is depleted of energy equivalents.44,62,63 Thus, when extracellular conditions indicate that nutrients are rich and ATP is plentiful, mTOR transitions the cell into a growth mode. If the cell is in an energy-poor state or nutrients are unavailable, mTOR inactivation results in decreased translational activity, and, instead, there is a shift to an alternative metabolic program in which the cell reclaims energy and metabolites.
There is also a close connection between TOR activation and the cell cycle. Treatment with the TOR inhibitor rapamycin causes yeast to arrest in G0/G1 in a quiescence-like state.64 The PI3K-TOR pathway is also implicated in control of quiescence exit and entry in other model systems, for instance, Drosophila melanogaster neuroblasts, progenitor cells that give rise to the central nervous system. Drosophila neuroblasts enter a quiescent state from which they exit in response to a nutritional checkpoint that requires amino acids. Cell cycle reentry of neuroblasts from quiescence was found to be dependent on PI3K and TOR signaling.65
Introduction to Pathways that Regulate Metabolism: Autophagy
Cells that are in nutrient-poor environments or are not actively growing tend to coordinately regulate two distinct processes: on the one hand, they reduce the rate at which macromolecules including proteins are synthesized, and on the other hand, they activate catabolic processes that allow them to recapture energy by breaking down macromolecules. One approach to achieving an increase in catabolism is the activation of autophagy (Fig. 2). Autophagy, or macroautophagy more specifically, is an evolutionarily conserved mechanism through which cytoplasmic proteins and organelles are engulfed into autophagosomes and degraded in lysosomes. The biological functions of autophagy include the reclamation of metabolites and ATP, the elimination of damaged proteins and organelles, the elimination of pathogens, tumor suppression and antigen presentation.66 Defects in autophagy have been implicated in liver disease, neurodegeneration, Crohn’s disease and metabolic syndrome.67
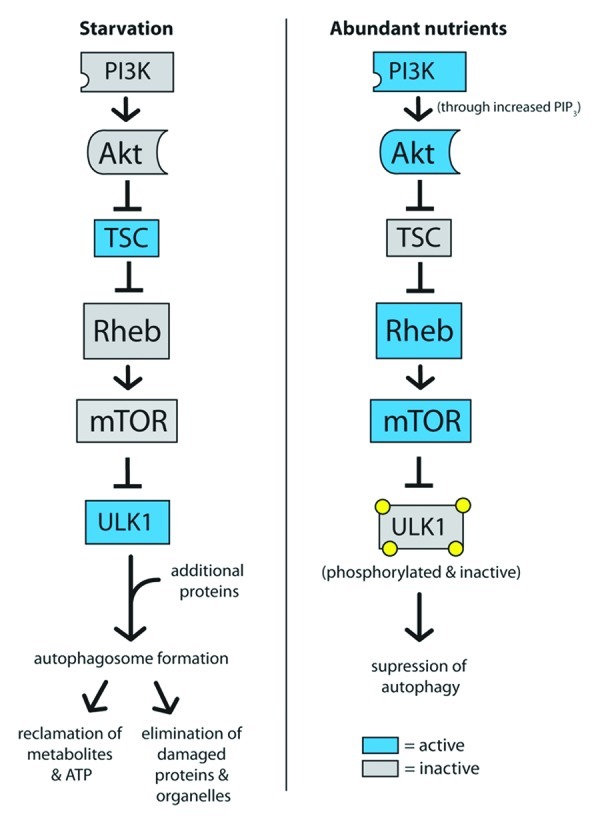
Figure 2. Autophagy is activated by low mTOR signaling and activation of ULK1. In starvation conditions, high TSC activity represses mTOR, which allows ULK1 to become active. After recruiting additional proteins to form a complex, ULK1 promotes autophagosome formation and autophagy. In contrast, high mTOR activity in high-nutrient conditions phorphorylates ULK1 and suppresses the induction of autophagy.
The TOR complex can act as an intermediary between the presence of glucose, insulin and amino acids and the catabolic process of autophagy. Amino acid depletion, for instance, results in reduced TOR activity68-70 and an induction of autophagy, which releases free amino acids from lysosomes for the rebuilding of proteins. mTOR actively represses autophagy, and thus, when cells are in a nutrient-rich, energy-replete state, only basal autophagy is activated. In mammals, TOR controls autophagy levels in part by phosphorylating and inhibiting the autophagy-specific kinase ULK1.71-73 When TOR is inactivated, ULK1 is released from inhibitory phosphorylation events. ULK1 in conjunction with other coordinating proteins can then form complexes that initiate the formation of autophagosomes.74 Thus, under conditions of starvation signaled by low insulin, glucose or amino acids, autophagy can provide nutrients to an energetically depleted or starved cell.
During starvation, autophagy can provide a nutrient source and thereby promote survival.67,75,76 Autophagy is required immediately after oocyte fertilization to feed the developing embryo before it can access maternal nutrients.77 Autophagy is required again during the period of neonatal starvation after separation from their mother.78-80 Autophagy-deficient mice contain lower amino acid levels in their tissues and plasma during this period. Autophagy invoked during the extensive remodeling that occurs during insect metamorphosis may provide amino acids to be used for the synthesis of proteins needed for the insect’s new form.81 From this perspective, autophagy is not just a mechanism for degradation of proteins and other macromolecules, but also an opportunity for renewal: the cell can erase its memory of its previous path and commit to a new cellular or even organismic lifestyle.82
Quiescence in E. coli
Starved bacteria can enter “stationary phase,” a state in which there is no increase in cell number.83 Starvation triggers higher levels of the alternative sigma factor RpoS, which controls expression of up to 10% of Escherichia coli (E. coli) genes.84,85 RpoS is responsive to low levels of carbon, nitrogen, phosphorus or amino acids.86 RpoS prepares cells for survival by activating genes that protect against starvation, osmotic stress87 and temperature stress.88 During stationary phase, successive rounds of mutants with improved fitness appear within the population and come to dominate the culture.83,89 At the same time, less fit cells die and provide nutrients to the survivors. The result is an equilibrium that leads to a stable, viable population.
Starved bacteria can be considered to enter a hypometabolism state, in that they slow their growth rate dramatically.90 Stationary phase E. coli reduce protein synthesis by about 20%. Levels of rRNA and tRNA decline compared with cells in exponential growth. In stationary-phase bacteria, ribosomes become dimerized, which could represent a way to store them.83,91 Upon readdition of nutrients, the ribosomes are released from their dimerized state within two minutes.91 Thus, decreased translation is associated with stationary phase in bacteria.
In stationary-phase bacteria, the activity of transport systems and the metabolism of carbohydrates, amino acids and phospholipids also decreases.92 In bacteria, metabolism shifts during stationary phase, and the nondividing state is characterized by an increase in glycolysis enzymes and lower production of TCA enzymes.93 Bacteria with mutations in ArcA, which is an important regulator of the shift to glycolytic enzymes, do not survive during starvation,94 indicating that the shift toward glycolysis away from the TCA cycle is important for the survival of stationary-phase bacteria. The shift away from TCA cycle use may be necessary to protect the bacteria from reactive oxygen species produced as a byproduct of oxidative phosphorylation. Overproduction of superoxide can rescue the survival of starved ArcA-deficient E. coli.94 E. coli strains lacking TCA cycle-related genes, specifically a subunit of succinate dehydrogenase, exhibited longer stationary-phase survival characterized by a reduced production of superoxide.
Protein catabolism is also critical for stationary phase, nutrient-deprived bacteria. Stationary-phase bacteria activate dwarfing, a form of self-digestion that results from degradation of endogenous cellular material, especially the cytoplasmic and outer mebranes.93 In bacteria, protein turnover increases 5-fold in starved E. coli, as many of the proteins synthesized in the early stages of starvation are proteases and peptidases.95 Mutations that reduce peptidase activity drastically reduce survival in stationary phase.96 Cells that lack specific proteases exhibit an accelerated rate of death during extended stationary phase, which further supports the importance of protein degradation and amino acid reclamation, for survival in reduced nutrient conditions.97
Quiescence in S. cerevisiae
S. cerevisiae can also achieve a quiescent state when they are grown to stationary phase, which is typically accomplished by allowing the cultures to grow in rich medium until they have exhausted the glucose present, usually for 5 to 7 d.1 During this period, the yeast undergo a change in metabolism termed diauxic shift: they transition from fermenting plentiful glucose via glycolysis into ethanol to metabolizing the accumulated ethanol through the citric acid cycle and respiration. As the glucose is depleted, the cells undergo one or two slow doublings and then cease proliferation and enter stationary phase.1S. cerevisiae can also enter stationary phase in response to limitation for a specific nutrient (e.g., nitrogen, sulfur or phosphate).98 Yeast that enter stationary phase through diauxic shift form two distinct populations, the heavier of which exhibits more of the characteristics of quiescent cells.1 The heavier, quiescent population is unbudded, which indicates cell cycle arrest, and these heavier cells synchronously reenter the cell cycle when provided with nutrients.99 The heavier cells also exhibit higher long-term viability and reproductive capacity, have greater thermotolerance, and exhibit decreased aging and oxidative stress.99
Stationary-phase cultures of yeast enter a state of decreased metabolism and biosynthesis, in which quiescent cells do not increase in mass or volume.1 The overall transcription rate in stationary phase cultures is three to five times lower than in logarithmic-phase cultures.100 Genes encoding ribosomal proteins are expressed at lower levels,6 and the translation rate is reduced to approximately 0.3% of the rate in logarithmically growing cultures.7 A hallmark of stationary phase in yeast, as in bacteria, is the ability to survive for prolonged periods without added nutrients.1 This may reflect not only the slower metabolic rate of the quiescent yeast, but also the fact that the non-quiescent cells provide nutrients for the quiescent population as they die.99
Another possible mechanism for ensuring the long-term survival of stationary phase yeast without added nutrients is the accumulation and use of storage carbohydrates.101-103 During diauxic growth and upon starvation for nitrogen, sulfur or phosphorus,101 yeast accumulate glycogen, a glucose polymer, and trehalose, a disaccharide of two glucose molecules. The fraction of dry weight represented by glycogen can be as high as 8%, while the fraction represented by trehalose can be as high as 20%.101,104 Glycogen is visible by electron microscopy in the denser, quiescent cells within a stationary phase population, and the accumulation of storage carbohydrates is likely responsible for the characteristic increased density of the quiescent cells in stationary phase batch cultures.99,105 During long-term stationary phase, glycogen and then trehalose stores are depleted from cultures.101,105 However, the importance of these two storage carbohydrates to survival during stationary phase is not resolved, as the absolute amounts of the storage carbohydrates do not directly correlate with viability.106 On the other hand, cells grown in a medium that does not allow them to accumulate trehalose or glycogen exhibit reduced survivability and lifespan.105 When stationary phase yeast are provided with fresh, rich medium, trehalose stores are depleted rapidly, and activity of the trehalase enzyme increases.105 Cells lacking trehalose exit quiescence more slowly, suggesting that trehalose may be the carbohydrate of choice upon cell cycle reentry from quiescence in S. cerevisiae. Since trehalose is a disaccharide of two glucose molecules, cleavage of one glycosidic trehalose bond rapidly provides two glucose molecules, whereas cleavage of a single glycosidic bond in a glycogen molecule provides only one glucose molecule. Trehalose may be a carbohydrate of choice for cell cycle reentry, because it can supply glucose rapidly.
Trehalose levels accumulate not only upon entry into stationary phase, but also in response to stresses such as heat shock, cold shock,107 and especially, desiccation.108 Mutant yeast unable to synthesize trehalose die more rapidly than wild-type yeast upon freezing.109 Trehalose may also facilitate desiccation and protect cells during freezing, because it is less likely to form crystals and can, instead, take-on a gel-like consistency.108,110 Trehalose may also stabilize lipid membranes upon desiccation, possibly by replacing water and hydrogen bonding with polar groups on membrane lipids and proteins.108,111 Finally, trehalose has been reported to function as a chemical chaperone and thereby facilitate protein folding.112 Thus, the accumulation of storage carbohydrates may represent an important mechanism for S. cerevisiae to survive during quiescence and reentry by providing carbohydrates to be metabolized for energy and by protecting yeast from stress during quiescence.
The TOR pathway is also a key component of the low metabolic rate in stationary-phase yeast.64 Treatment with rapamycin, a TOR inhibitor, induces yeast to enter a quiescence-like, G1-arrested, unbudded state similar to that achieved after diauxic shift.64,113,114 Quiescent yeast contain reduced levels of transcripts for G1 cyclins, including the sensor cyclin CLN3.64 Overexpression of CLN3 in rapamycin-treated cells results in an inability to properly enter quiescence and a loss of rapamycin-induced G1 arrest.64 Rapamycin treatment also results in reduced expression of ribosomal protein genes115 and reduced rates of protein synthesis.64 Rapamycin-treated yeast accumulate storage carbohydrates1,64 and activate autophagy.116 TOR also regulates multiple genes known to change upon entry into quiescence.64 Thus, TOR inhibition results in a state with similarities to stationary phase: catabolic processes such as autophagy are induced, while anabolic processes such as transcription, translation and ribosome biogenesis are reduced.117,118 For these reasons, TOR has been considered by some to be a master regulator of quiescence in yeast.20,119 However, there may be other contributory pathways to stationary phase as well, such as protein kinase A and C.1 TOR pathway inhibition by itself does not recapitulate the dramatic decrease in protein synthesis rates of stationary phase cells,7,64,120 and S. cerevisiae treated with rapamycin continue to accumulate mass and volume.1,64
TOR has wide-ranging cellular effects in yeast (reviewed in ref. 117). As described above, in mammals, two important targets of TOR are 4E-BP1 and p70 S6K. In S. cerevisiae, like in mammalian cells,121 TOR may prevent a protein, in this case, EAP1, from inhibiting eIF-4E, thus resulting in eIF-4E activation and increased cap-dependent translation.122 TOR activation in yeast also stimulates protein synthesis by increasing the abundance of ribosomes.123,124 TOR target Sch9 (reviewed in ref. 125) fulfills a role similar to S6 kinase in mammals.117 Carbon starvation or rapamycin treatment results in dephosphorylation and inactivation of Sch9 (reviewed in ref. 126), whereas activation of Sch9 leads to increased transcription of ribosomal biogenesis and ribosomal protein genes through phosphorylation-sensitive transcriptional repressors.125,127-129 Also, TOR itself can shuttle back and forth between the cytoplasm and the nucleus.130 TOR enters the nucleus in a nutrient- and rapamycin-sensitive way, binds promoters of rRNA genes and promotes their expression. Decreased TOR activity upon entry into quiescence in yeast likely contributes to the reduced translation rate, although, as described above, it may not be the only contributing factor.7
In S. cerevisiae, TOR also regulates cell cycle activity, in part through its regulation of two phosphatases, protein phosphatase type 2A (PP2A) and Sit4, a type 2A-related protein phosphatase.131,132 PP2A is involved in the activation of Cdc28, which promotes cell cycle entry.133 Sit4 is important for the initiation of the cell cycle at START, bud formation, the initiation of DNA synthesis and spindle pole body duplication.134,135 Strains with a temperature-sensitive allele of SIT4 arrest in the G1 phase of the cell cycle and resemble the phenotype of rapamycin-treated cells, indicating a possible mechanism by which TOR inactivation may contribute to the cell cycle arrest in stationary phase.133,135
TOR activation also results in exclusion of specific transcription factors from the nucleus,119 including the GLN3 transcription factor, which transcribes genes that allow the cell to use poor nitrogen sources.131,132,136-139 When TOR is active, Gln3 is phosphorylated and localized to the cytoplasm. If TOR is inhibited by rapamycin, Gln3 becomes dephosphorylated, accumulates in the nucleus and activates the transcription of permeases that facilitate import of nitrogen metabolites and genes that allow yeast to metabolize poorer nitrogen sources. Decreased TOR activity results in the relocalization of high-affinity amino acid permeases to vacuoles.136,137 TOR can also regulate the activity of the Gcn4 transcription factor, which activates genes that regulate the biosynthesis of amino acids.140 Rapamycin treatment of S. cerevisiae also induces the expression of genes involved in autophagy.115
Stationary-phase yeast reduce their glycolytic rate, but they continue to rely on mitochondrial respiration. They are, therefore, expected to produce ROS, which can damage cellular macromolecules. Active TOR prevents nuclear localization of the stress response transcription factors MSN2/4 (reviewed in ref. 136). These transcriptional regulators accumulate in starved cells, and their targets, such as superoxide dismutase 1 and superoxide dismutase 2 (SOD1 and SOD2),141,142 aid in managing the stress induced by nutrient deprivation. SOD1 or SOD2 deletion results in more rapid loss of viability compared with wild-type cells when stationary cells are aerated,143 while SOD1/SOD2 double mutant cells die even more quickly. In the absence of respiration, the SOD mutant yeast retained viability. The results indicate that respiration contributes to the oxidative burden of yeast, and that SODs are important for protecting stationary phase yeast from the reactive species formed. Thus, in S. cerevisiae, TOR activity is a major regulator of gene expression; it regulates the expression of ribosomal biogenesis proteins and ribosomal proteins, genes that regulate the biosynthesis of amino acids, genes that facilitate amino acid utilization, genes that allow for use of poor nitrogen sources, genes that defend against oxidative damage and genes that regulate autophagy.
Activation of autophagy is important for the survival of yeast in nutrient-deficient environments, as the amino acids reclaimed by autophagy are recycled and utilized for the translation of proteins needed to adapt to starvation.82 Autophagy-deficient yeast die rapidly upon starvation for glucose or nitrogen.144,145 In these yeast, the total intracellular amino acid pool is diminished, and, as a consequence, bulk protein synthesis is substantially reduced.145 Proteins that continue to be produced in wild-type starved yeast, such as vacuolar/lysosomal enzymes, respiratory chain proteins, antioxidant enzymes and proteins in pathways of amino acid biosynthesis, are not synthesized.145 Lacking the proteins needed for the respiratory chain, autophagy-deficient yeast lose respiratory function and accumulate higher levels of ROS when starved.146 Autophagy deficiency also affects carbohydrate metabolism, as autophagy-deficient yeast are able to synthesize glycogen when approaching stationary phase, but are unable to maintain their glycogen stores. Modulation of autophagy in stationary phase is achieved in part through TOR, which negatively regulates autophagy through the activity of yeast autophagy regulatory proteins.147,148
Quiescence in Lymphocytes
In contrast to bacteria and yeast, mammalian cells rarely encounter nutrient depletion in physiological conditions, because they are bathed in glucose, amino acids and other nutrients provided by nearby capillaries. In mammalian cells, the presence or absence of growth factors and situational cues are commonly used as triggers for quiescence. Lymphocytes, a central component of the adaptive immune response, coordinate the body’s reaction to antigens. Activation of T lymphocytes requires co-stimulation through the T-cell receptor (TCR) and a co-stimulatory receptor CD28. Upon ligation of the T-cell receptor, the cytoplasmic tail of CD28 is phosphorylated, and it then serves as an adaptor for the recruitment and activation of PI3K.149-151 Lymphocytes can also be activated by mitogenic lectins and some lymphocytes, including the hematopoietic cell line FL5.12, are dependent upon the cytokine interleukin-3. Upon activation, a quiescent lymphocyte grows to approximately double its resting size, rapidly proliferates and secretes large amounts of cytokines.152 This transition is associated with a major shift in the cell’s metabolic profile.153-156
T-cell activation triggers a dramatic increase in glucose transport and metabolism through glycolysis. Quiescent lymphocytes derive most of their ATP from oxidative phosphorylation.152,157,158 In contrast, activated lymphocytes depend heavily on glucose to serve as a carbon source and to provide ATP needed for biosynthesis and secretion. For rat T lymphocytes stimulated with lectins and interleukins, activation results in a 53-fold increase in glucose metabolism.159-163 The activity of individual glycolytic enzymes increased 12- to 30-fold upon stimulation. Increasing the dose of IL-3 administered to FL5.12 cells results in an 8-fold increase in glycolytic flux.164
Activated T cells are so committed to glycolysis, in fact, that they continue the process anaerobically even when oxygen is available; that is, they continue to convert glucose to pyruvate and secrete it as lactate rather than use oxidative phosphorylation for energy despite the presence of oxygen that could be used as an electron acceptor.159 In activated thymocytes, 90% of the glucose was converted into lactate, whereas resting cells metabolized only 56% to lactate.159 Anaerobic glycolysis is also performed by cancer cells, a process called the Warburg effect.165,166 In fact, the lymphocytes increase glycolysis over and above what they need to maintain their ATP/ADP levels, which has been interpreted as an accumulation of ATP in anticipation of future metabolic demands.164 Glutamine utilization also increases in activated rat T lymphocytes and was 8-fold higher in proliferating than quiescent thymocytes.159
Increased glycolytic flux in activated T lymphocytes is achieved by increasing the amount of glucose transporters on the cell surface. In adipose tissue, and cells of the muscle and liver, the glucose transporter Glut4 is rapidly translocated from intracellular storage vesicles to the cell surface in response to insulin.167-169 Lymphocytes do not express Glut4, but rather rely on the ubiquitously expressed Glut1 as their primary source of intracellular glucose.154 In quiescent lymphocytes, Glut1 mRNA and protein levels decline, and the levels of Glut1 transporters on the cell surface decline as cells endocytose and degrade the transporters responsible for glucose uptake153,154,170,171 as well as transporters for amino acids, low-density lipoprotein and other nutrients.172 TCR-CD28 costimulation or IL3 addition promotes glucose uptake in part by promoting localization and retention of Glut1 on the cell surface.171,173-175 IL3 receptor engagement attenuates Glut1 internalization to promote maximal surface levels.172,173 PI3K and Akt affect endocytosis, recycling and trafficking of the Glut1 (and Glut4) transporters to maximize cell surface expression. Glut1 overexpression in T cells results in increased cell size, increased glucose uptake in peripheral T cells and enhanced expression of activation markers. Akt is important for the regulation of surface transporters not only for glucose, but also for amino acids, low-density lipoprotein and iron.153 Constitutively active Akt results in the maintenance of these transporters on the cell surface in the absence of growth factors and increased cell size.153 Rapamycin treatment of Akt-expressing cells diminishes their size, indicating that Akt signaling is mediated through mTOR. Thus, T-cell activation through TCR engagement or growth factors controls cellular growth and survival in part by regulating access to extracellular nutrients through the Akt and mTOR pathways.
When lymphocytes are deprived of growth factors, glucose uptake is limited, and the cells activate an alternative pathway in which glucose uptake and metabolism are reduced. This pathway leads to cell death, which makes it difficult to define the quiescent state of lymphocytes.154,164 To address this problem, cells deficient for both of the key initiator apoptotic proteins Bax and Bak were created.176,177 Cells from Bax-/-Bak-/- animals do not undergo apoptosis in response to serum deprivation or growth factor withdrawal, and thus, the metabolic changes that occur in quiescent cells can be investigated over a longer time frame.177,178 Following growth factor withdrawal, Bax-/-Bak-/- cells undergo progressive atrophy, shrink in size approximately 50% over three months of self-cannibalization and ultimately die. In the absence of growth factors, these cells do not express glucose transporters on their cell surface, and therefore, they fail to take up nutrients from their environment. To compensate for the lack of externally-provided nutrients, they activate autophagy to maintain their ATP levels. If autophagy is inhibited, there is rapid cell death. Thus, while the cells slowly die of nutrient deprivation in the absence of growth factors, they die much more rapidly when autophagy is inhibited, indicating that autophagy is important for protecting them from starvation. If the cells are provided with a cell-permeable form of pyruvate, thus providing a substrate for the TCA cycle, cell death is suppressed. When growth factors are added back to growth factor-deprived cells, their ability to take up and metabolize glucose is restored, and the cells recover their original size and proliferative potential. Therefore, growth factors promote cell survival by maintaining the ability of cells to take up sufficient nutrients to maintain ATP production and to support synthesis of needed macromolecules.
In accord with the prediction that autophagy plays a protective role for quiescent lymphocytes in vivo, primary, quiescent mouse and human T lymphocytes contain autophagosomes.179-181 To investigate further, the immune system of adult mice was reconstituted with autophagy-deficient hematopoietic precursors from mice lacking Atg5.179 Autophagy-deficient mice were unable to reconstitute the lymphoid compartment. Atg5-/- CD8+ T lymphocytes exhibited increased apoptotic cell death compared with wild-type controls, thus the ability to induce autophagy is important for the survival of CD8+ T cells. Atg5-/- CD4+ and CD8+ T cells also failed to undergo efficient proliferation after TCR stimulation, indicating that autophagy is important for the survival and proliferation of T lymphocytes.
Quiescence in Hematopoietic Stem Cells
Hematopoietic stem cells (HSCs) are the source of all of the short-lived cells within the blood that are needed over the course of our lifetimes.182 To repopulate all of the necessary lineages of cells within the blood, millions of mature cells must be generated daily from progenitors that proliferate extensively. The HSCs are operationally defined as the cells capable of recreating the entire blood system of a recipient. HSCs are found in a specific niche or microenvironment within the bone marrow183-185 and are in a mostly quiescent state.186,187 In response to intrinsic or extrinsic cues about the need for mature blood cells, HSCs can be stimulated to regenerate another HSC or, in an asymmetric cell division, to generate a progenitor cell that can then repopulate differentiated hematopoietic cell lineages.182
If HSCs inappropriately commit to proliferation and differentiation rather than maintain quiescence, there can be a depletion of the HSC pool, which will ultimately result in an organism that lacks the HSCs needed for blood cell replenishment.186 In support of this model, the proliferative rate of HSCs among mouse strains is strongly anti-correlated with the strain’s maximum lifespan, suggesting a link between HSC depletion and aging.188,189 In animals with homozygous deletion of the cyclin-dependent kinase inhibitor p21Cip1, there is increased proliferation of stem cells, followed by a loss of stem cells and increased susceptibility to stress-induced exhaustion of the stem cell pool.190
In addition to cyclin-dependent kinase inhibitors, the PI3K-mTOR pathway is also an important regulator of quiescence in HSCs as evidenced by the results when regulatory subunits of PI3K—PTEN, Akt and TSC—were modulated.191-195 HSCs from PI3K-deficient embryos are less able to respond to growth factors and less able to repopulate hematopoietic lineages compared with wild-type controls,191 demonstrating the importance of PI3K signaling for cell cycle entry. Conversely, conditional deletion of PTEN, a phosphatase that counters PI3K phosphorylation events, results in short-term HSC expansion and long-term decline. PTEN loss resulted in excessive HSC proliferation, leading to leukemias, followed by stem cell depletion. PTEN-deficient HSCs could not repopulate the blood system of irradiated mice. HSC function could be restored by treatment with rapamycin, indicating that TOR likely mediated the effects of PTEN deletion.192,193 Similar to the phenotype of PTEN-deleted HSCs, constitutive activation of Akt using myristoylated Akt resulted in a hyperproliferative state and subsequent HSC depletion.194 Finally, deletion of TSC also resulted in increased TOR activity, HSC cycling and depletion, defective repopulating potential and defects in hematopoietic lineage development.195-197 The effects of TSC deletion on repopulating potential and hematopoietic lineage development were mediated through TOR signaling.195 Thus, multiple different types of modulation of the PI3K signaling pathway from PI3K to TOR suggest that the PI3K-TOR axis is central for the control of the commitment of HSCs to proliferation from quiescence.
One possible explanation for the deleterious effects of increased TOR activity on stem cell survival is that the transition from quiescence to proliferation, and the associated increase in TOR activity, results in a higher metabolic state and an increase in ROS. HSCs are usually present in an anaerobic niche within the low-oxygen portion of the bone marrow, far from circulating blood and the oxygen it carries.198,199 Low oxygen tension in the stem cell niche may be important for maintaining HSCs in an undifferentiated state.200 Metabolic activation of HSCs may occur when they migrate to a more oxygen-rich portion of their microenvironment, as the increase in oxygen levels may promote their differentiation.201 Indeed, HSCs maintain tight regulation of mitochondrial homeostasis, and this control is important for their integrity.202-205 Normal HSCs have few mitochondria, and increased mitochondrial biogenesis results in defective HSC maintenance.197,206 HSCs can be identified based on their low levels of staining with the vital dye Rhodamine-123, an indicator of their low mitochondrial activity.206,207 HSCs with low Rhodamine-123 are enriched for cells in the G0/G1 phase of the cell cycle,208 indicating that quiescence in HSCs is closely associated with decreased mitochondrial activity. In another study using a dye for intracellular ROS, HSCs were separated into ROSlow and ROShigh fractions.201 The ROSlow cells were enriched for cells in G0, expressed higher levels of cyclin-dependent kinase inhibitors and better retained their long-term self-renewal ability.
A role for TOR in maintaining ROS levels is supported by the observation that an antioxidant or rapamycin could restore the self-renewal ability of the ROShigh HSCs. Mice with overactive TOR as a result of Tsc1 inactivation also contained higher ROS, as well as increased mitochondrial mass and mitochondrial DNA copy number.196,197,209 Antioxidant treatment also significantly rescued the ability of the Tsc1-/- HSCs to reconstitute blood. Rapamycin treatment and siRNAs against mTOR binding partners causes decreased mitochondrial polarization, oxygen consumption and ATP production.210 In aged HSCs, TOR inhibition increases HSC lifespan and restored the self-renewal capacity of the stem cells.196 TOR may thus play a role in regulating the balance between mitochondrial and non-mitochondrial sources of ATP.
The importance of low ROS levels in HSCs is further supported by experiments with the FoxO family of transcription factors. In quiescent murine HSCs, Akt is not activated, and members of the FoxO family of transcription factors, which are important for suppressing ROS levels,211 are localized to the nucleus. Upon cytokine stimulation of HSCs, Akt becomes activated, and FoxO proteins are exported from the nucleus to the cytoplasm.212 HSCs with conditional deletion of FoxO proteins exhibit lineage expansion, lymphoid developmental abnormalities and a decrease in the HSC population.213 Bone marrow from FoxO-deficient mice is deficient in repopulating the blood system of mice. In vivo antioxidant treatment reversed the FoxO-deficient phenotype.
Lkb1, a kinase that senses ATP depletion as described above, was recently shown to play an important role in addition to and distinct from the role played by TOR in the regulation of HSC quiescence.202-204 Conditional deletion of Lkb1 resulted in an increase in the number of HSCs followed by depletion of these cells.202-204 In mice in which Lkb1 was conditionally deleted, HSCs escaped from quiescence and proliferated.202,204 Lkb1-deficient HSCs were unable to generate sufficient progeny to repopulate blood cells in irradiated mice and did not form colonies in culture.202,203 While rapamycin can rescue the phenotypes of Tsc1-knockout mice, rapamycin did not rescue Lkb1 deletion defects202-204 and, consequently, mTOR activation is not a major mediator of HSC depletion after Lkb1 deletion.204 Treatment with metformin, an AMPK activator, also did not rescue the transient expansion and subsequent depletion of HSCs in Lkb1 mice,204 indicating that Lkb1 alters metabolism through AMPK-independent mechanisms in HSCs. In addition, Lkb1-deficient bone marrow cells exhibited alterations in lipid and nucleotide metabolism and depletion of cellular ATP.203 These findings indicate a broad role for Lkb1 in energy metabolism in HSCs and that Lkb1 may serve as another rheostat, in addition to TOR, that also sets the appropriate balance between anabolic and catabolic activities in HSCs.202-204
More recently, it has also become clear that autophagy is critical for HSC maintenance. HSCs in which there was conditional deletion of an essential autophagy protein exhibited a loss of normal function, and the mice died within weeks.214 Autophagy-deficient HSCs could not reconstitute the hematopoietic system of irradiated mice. Autophagy-deficient HSCs also accumulated aberrant mitochondria and contained increased levels of mitochondrial superoxide and DNA damage, indicating a role for autophagy in regulating mitochondrial quantity and quality in HSCs. Mice with autophagy-deficient HSCs exhibited myeloid proliferation, indicating that autophagy may protect against leukemogenesis. Thus, quiescent HSCs rely on autophagy for maintenance of viability, quiescence and mitochondrial quality.
Quiescence in Fibroblasts
Fibroblasts are the cells that carry most of the responsibility for secreting extracellular matrix proteins, such as collagen fibers, that create the basement membrane and provide structural support for connective tissue. Dermal fibroblasts are usually quiescent and are stimulated to proliferate in response to wounds. When skin is wounded, the fibroblasts proliferate and coordinate the wound-healing response, including secreting collagen and other extracellular matrix proteins,215 recruiting endothelial cells to promote angiogenesis in the area216,217 and secreting other molecules that facilitate the wound-healing response.217 If fibroblasts fail to quiesce at the end of a wound-healing event, the result can be excessive scarring or fibrotic disease.218,219
Cultured primary human fibroblasts can be induced into quiescence by multiple methods, including contact inhibition and serum starvation. Fibroblasts induced into quiescence by either of these methods accumulate in G0/G1 cell cycle phases with about 80% efficiency. Quiescent fibroblasts express higher levels of the cyclin-dependent kinase inhibitor p27Kip1 (CDKN1B).220-222 Microarray analysis of cultured human fibroblasts has shown that the quiescent state of the fibroblasts is associated with widespread changes in gene expression.16,217,223
An analysis of the metabolic profiles of primary human fibroblasts induced into quiescence by contact inhibition revealed that, surprisingly and in contrast to most other quiescence model systems, contact-inhibited fibroblasts maintain comparable metabolic rates to proliferating fibroblasts despite not actively proliferating.220 Glucose uptake and lactate secretion rates were only 2-fold lower in contact-inhibited compared with proliferating fibroblasts. An analysis of flux through metabolic pathways revealed comparable flux through glycolysis in proliferating compared with contact-inhibited fibroblasts. Thus, cells can be quiescent, in that they are not actively dividing to make two cells, without entering a state of hypometabolism characterized by low glucose uptake.
Quiescent fibroblasts did differ from proliferating fibroblasts with regard to the mechanism through which the products of glycolysis entered the TCA cycle.220 Metabolic intermediates can enter the TCA cycle from pyruvate via the pyruvate dehydrogenase-catalyzed transfer of an acetyl group from acetyl-CoA to oxaloacetate. Alternatively, pyruvate can be converted to oxaloacetate by pyruvate carboxylase, which allows for anaplerosis or the replenishment of TCA cycle intermediates extracted for catabolism. Quiescent fibroblasts, especially fibroblasts made quiescent by a combination of contact inhibition and serum starvation, exhibited a decline in pyruvate dehydrogenase-catalyzed TCA cycle entry. There was an increase in pyruvate carboxylase-catalyzed TCA cycle entry with quiescence, indicating increased anaplerotic filling of TCA intermediates.
TCA cycle metabolism also shifted with contact inhibition-induced quiescence. When contact-inhibited fibroblasts were fed isotopically labeled glucose, the glucose was readily incorporated throughout the TCA cycle. In proliferating fibroblasts, there was a substantial decrease in the transmission of labeled carbons from citrate to α-ketoglutarate.220 Instead, the citrate was transported to the cytoplasm, from which it could be used for fatty acid synthesis or to modify histones. Proliferating fibroblasts, rather than rely on glucose for TCA cycle anaplerosis, shifted to a dependence upon the amino acid glutamine, which can enter the TCA cycle at α-ketoglutarate. The reliance of proliferating cells on exogenous glutamine for TCA cycle anaplerosis is consistent with the increased requirement of proliferating cultured cells for exogenous glutamine to support their growth in culture.224-226
These experiments would suggest that primary dermal fibroblasts induced into quiescence by contact inhibition differ from most other cell types in that they maintain a comparable metabolic rate during quiescence compared with proliferating cells. In most cells, biosynthetic activity is downregulated upon quiescence because non-proliferating cells do not need to synthesize the components required to create new cells. One possible explanation for the maintenance of higher metabolic rates during quiescence in contact-inhibited dermal fibroblasts is that they do have an important biosynthetic function during quiescence, which is the secretion of extracellular matrix proteins. Indeed, contact-inhibited dermal fibroblasts increased the secretion of multiple extracellular matrix proteins as compared with proliferating fibroblasts.220 A redirection of metabolic potential away from biosynthesis of intracellular components and toward synthesis of extracellular matrix proteins represents one possible explanation for the observation that quiescent, contact-inhibited fibroblasts do not enter a hypometabolic state.
Other studies have investigated the importance of TOR in fibroblasts induced into quiescence by serum withdrawal. When fibroblasts from the lung fibroblast cell line WI-38 are serum-starved, TOR activity decreases.227 In contrast, TOR levels remained high in fibroblasts treated with doxorubucin to induce senescence, irreversible arrest that results from the end of a cell’s replicative lifespan or stress.227 Treatment with rapamycin reduced doxorubicin-induced senescence, suggesting that a reduction in mTOR activity can protect WI-38 fibroblasts from senescence. Thus, the TOR pathway may be an important determinant of whether a cell responds to anti-proliferative signals by entering a reversible quiescent state or an irreversible senescent state. To further these findings, the authors also used a model system of quiescence or senescence induced by activation of the tumor suppressor p53.228-230 p53-mediated cell cycle arrest by treatment with nutlin-3a, a small molecule that activates p53 (reviewed in refs. 231 and 232), resulted in quiescence if TOR was inhibited and senescence if it was not.233,234 In WI-38 lung fibroblasts, nutlin-3a suppressed senescence and inhibited mTOR. In mouse embryo fibroblasts, which are much more prone to senescence than human fibroblasts, p53 activation with nutlin did not reduce mTOR activity and led to senescence. Rapamycin rescued the cells from senescence and allowed them to enter a state more similar to quiescence. Thus, the status of the mTOR pathway may be an important contributor to the decision between senescence and quiescence in fibroblasts: cell cycle arrested coupled with inappropriately high mTOR activity was found to be associated with senescence.
In fibroblasts, like yeast, TOR regulation can also affect the transition between proliferation and quiescence. Fibroblasts in which TOR is overexpressed as a result of antisense inhibition of the TSC protein do not undergo G0 arrest upon serum withdrawal.235 Inhibition of TSC also activated quiescent fibroblasts to reenter the cell cycle through upregulation of cyclin D1 expression and increased activity of G1 CDKs,235 and possibly destabilization and relocalization of p27Kip1 (reviewed in ref. 236). Further, loss of TSC2 induced soft agar growth of the fibroblasts, a phenotype reminiscent of tumor growth.
Mouse embryo fibroblasts (MEFs) and immortalized mouse fibroblasts, NIH3T3 cells, have also been used to monitor the relationship between autophagy and quiescence. MEFs made quiescent by contact inhibition or serum withdrawal activated autophagy.8 However, depletion of an essential autophagy protein in MEFs had no measurable effect on the ability of the cells to enter quiescence. Thus, in contrast to cells like lymphocytes that die rapidly upon autophagy inhibition when they are not stimulated with growth factors,178 fibroblasts can achieve a quiescent state without functioning autophagy.8 Thus, consistent with some of the experiments on metabolism in quiescent fibroblasts,220 quiescent fibroblasts may not rely as heavily on nutrients or ATP equivalents reclaimed via autophagy in the quiescent state as other types of quiescent cells, although longer timepoints would be needed to make further conclusions.
Quiescence in Dormant Cancer Cells
There may also be cells within a tumor that enter a quiescent state characterized by hypometabolism and increased survivability. One argument for the existence of such cells is that tumors can recur many years after removal of the primary tumor. Breast cancers often recur years after a mastectomy was performed, even if there was no evidence of clinical disease at the time of surgery.237 During this time between tumors, there may be minimal residual disease that results from solitary disseminated tumor cells.238,239 The presence of these cells is associated with higher risk of recurrence.237,240-244 The long intervals between primary tumors and their recurrences suggest that tumor cells may have developed mechanisms that allow for their long-term survival in a dormant state. Indeed, disseminated cancer cells may face nutrient starvation and may readjust their metabolic programs to allow them to use alternative energy sources during their dormant period. Some recent studies have explored the role of metabolic pathways in model systems designed to understand the properties of quiescent cells within tumors.
One model system for studying tumor dormancy is based on a highly tumorigenic and metastatic human squamous carcinoma cell line (T-Hep3) that, when passaged in culture for > 40 generations, reprograms to a reversibly dormant phenotype. The dormant cells undergo a G0/G1 arrest in culture and fail to form tumors in vivo.245-247 Aguirre-Ghiso and colleagues discovered that there is an important role for the Rheb-mTOR pathway in the dormant cells in this model.248 The Rheb-mTOR pathway is regulated by the ATF6 survival factor. In response to endoplasmic reticulum stress, the cytosolic domain of ATF6 translocates to the nucleus and activates transcription of unfolded protein response genes. ATF6 levels were higher in the dormant compared with the tumorigenic matched cell lines. ATF6 was found to regulate Rheb and thereby activate mTOR signaling in the dormant cells, and the dormant cells were much more resistant to rapamycin treatment than their tumorigenic counterparts. Knockdown of Rheb decreased the survival of the dormant cells in vivo, suggesting that TOR signaling serves a role as a survival factor in the dormant tumor cells. Thus, in this model system of tumor dormancy, in contrast to the other quiescent states discussed, TOR activity is upregulated in quiescence.
Another approach to studying the signaling of dormant tumor cells was taken by Ramaswamy and colleagues.249 They observed significant heterogeneity in cell cycle progression in the MCF7 cell line, a highly proliferative, aneuploid, ER+/HER2- human breast cancer cell line. Some cells remained in interphase for much longer than other cells before dividing. Based on previous studies indicating that slowly cycling hematopoietic, neural and breast adult stem cells and cancer stem cells produce low levels of ROS, they isolated the ROSlow subpopulation of the MCF7 cells. ROSlow MCF7 cells were predominantly in the G0/G1 phase of the cell cycle compared with actively cycling ROShigh cells. These G0-like cells were characterized by low levels of proteins associated with proliferation, low levels of certain histone modifications and high levels of Hes1, which had been identified as a molecule important for the ability of quiescent fibroblasts to resist senescence and differentiation.250 ROSlow cells were found not only in MCF7 cells but also cancer cell lines MDA-MB-231 and HCT116.
Further investigation showed that there were asymmetric cancer cell divisions that resulted in one proliferative and one G0-like cell. The proliferative cells contained higher levels of Akt signaling and nuclear FOXO1 compared with the daughters. Treatment with a small molecule Akt inhibitor resulted in an increase in the G0-like cells, which suggested that low Akt signaling may be an important regulator of the commitment to the G0-like state. While G0-like cancer cells were rare in pretreatment biopsies from five individuals, they were enriched in the biopsies from the same patients after neoadjuvant chemotherapy. The authors concluded that cancer cells flux between symmetric and asymmetric division depending on the state of Akt.
Other approaches to define a cell type that contributes to tumor dormancy have focused on the reported subset of cancer cells called “cancer stem cells,” which are defined by their ability to survive and maintain their undifferentiated state.251 Autophagy might be important for the survival of the disseminated cancer stem cell-like cells in nutrient and oxygen-deprived environments. Inhibiting autophagy with shRNAs that target autophagy genes in the stem cell-like compartment of a breast epithelial cancer cell line reduced the fraction of cells with the undifferentiated cancer stem cell-like phenotype.252 The results suggest that autophagy is important for the maintenance of a cancer stem cell compartment.
From another perspective, all of the cells within a tumor would be expected to experience signals similar to those that trigger quiescence. Detachment from the substratum, low levels of nutrients, and hypoxia would all be expected to be characteristics of the tumor microenvironment. Thus, the PI3K/TOR pathway might be anticipated to be an important pathway in cancer, as mutations that activate the PI3K/TOR pathway could promote cancer cell survival in the absence of nutrients.253 Breast cancers, for instance, often contain activating mutations in PI3K, inactivating mutations in PTEN or activating mutations in Akt. These mutations confer growth-factor and anchorage-independent growth.253 Preventing tumor cells from activating the PI3K/TOR pathway could disable them and over 20 drugs that target the PI3K/TOR pathway are in clinical development.253,254
Similarly, autophagy is critical for the tumorigenic process for the bulk tumor as well.67,255 Autophagy within a tumor is enhanced in regions furthest from blood vessels.255 Suppressing autophagy reduces the growth of tumors with ras mutations,256,257 myc-induced lymphomas and polyoma middle T-induced mammary tumors.258,259 Autophagy may also be induced as an adaptive response to chemotherapy.260,261 Indeed, autophagy could be a pharmacological target for anti-cancer agents.261,262 Autophagy inhibition can be used in combination with other drugs, for instance, to enhance the effectiveness of growth factor inhibitors used to treat cancer.263 An advantage of targeting autophagy in tumors is that autophagy inhibitors that affect lysosomal pH have already been shown to be safe and effective in people based on their use as antimalarials and as treatment for autoimmune disease.264
Summary: Comparing and Contrasting Quiescent States
Cells in many different species exhibit a common response to extracellular and intracellular signals that indicate that conditions are not suitable for proliferation. As described above, yeast and mammalian cells arrest their cell cycles prior to DNA synthesis. In the nematode, C. elegans, nutrient limitation and crowding results in the activation of an alternative developmental program called dauer.265 During dauer, C. elegans remain immature and stockpile reserve lipids for survival during times of limitation.266 Other examples of cells in quiescent states include neuroblasts in Drosophila and reproductive cells, such as oocytes, seeds and bacterial spores. Changes in central carbon metabolism vary in the different species. In bacteria, entry into stationary phase is associated with decreased TCA use.94 Yeast, in contrast, can enter stationary phase from glucose deprivation and consequently shift from a reliance on glucose for energy to metabolizing the ethanol through respiration.1 On the other hand, S. cerevisiae that can switch from TCA cycle/respiration to glycolysis during stationary phase exhibit lifespan extension.267 Thus, decreased TCA cycle use may be advantageous during stationary phase for yeast as well as bacteria. Lymphocytes consume less glucose in a quiescent state compared with actively proliferating lymphocytes, which reflects a decrease in the expression of glucose transporters and in their localization to the plasma membrane.268 In lymphocytes, the quiescent state is associated with more oxidative phosphorylation and the activated state is associated with a shift toward increased glycolysis. HSCs are very sensitive to ROS levels.200 They perform very little mitochondrially localized oxidative phosphorylation in the quiescent state compared with their activated progenitors.206 Primitive oocytes share this property with HSCs, as they also have low levels of mitochondria or mitochondrial activity.269,270 Contact-inhibited fibroblasts display yet another pattern with comparable glycolytic and TCA rates in both the proliferating and quiescent state.220 The most deeply quiescent fibroblasts investigated, those that were quiescent from contact inhibition and serum starvation, did decrease flux from glycolysis to the TCA cycle through pyruvate dehydrogenase, and thus fibroblasts may share some properties with the cells that minimize TCA usage when they are in deeper quiescent states.
In yeast, storage carbohydrates may be used as an energy storage system during quiescence, while trehalose in particular is used as a nutrient source upon cell cycle reentry in response to nutrient readdition. Trehalose is likely important for stationary phase in species other than yeast as well, possibly for its role in protecting against desiccation,108 as it is present in stationary phase E. coli,271 and many species of plants, insects and fungi, including plant seeds and fungal spores,272 but not mammals. In humans, buffering against starvation occurs at an organism level. The hepatocytes of the liver, muscles and red blood cells store glycogen and deploy it when glucose levels are low, while adipocytes store large lipid droplets that can also be mobilized in times of starvation. Lymphocytes, for instance, do not have large internal glycogen or lipid stores, and are highly dependent on glucose import to meet their metabolic needs.273
The TOR signaling pathway is frequently regulated with quiescence and can allow the cell to respond to extracellular nutritional conditions by modulating the rate of protein synthesis and growth.19 In yeast, lymphocytes and HSCs, downregulation of the TOR pathway occurs with quiescence. In yeast, inhibiting TOR is sufficient to recapitulate a quiescence-like phenotype.64,113,114 In HSCs, inappropriate activation of the TOR pathway results in excessive cell cycle commitment and ultimately stem cell exhaustion.196,197,209 TOR signaling in HSCs results in elevated ROS levels that are damaging to HSCs in the quiescent state.196,197,209 In fibroblasts, TOR activation during quiescence is associated with a commitment to a senescent rather than quiescent state.227 In contrast to the other quiescent states considered, in dormant tumor cells, TOR was activated in the dormant state and contributed to cancer cell survival.248
Autophagy and protein turnover are also critically important aspects of the quiescent state for many quiescence model systems. As described above, yeast, lymphocytes, HSCs and cancer cells all rely on autophagy for survival in their quiescent states. Inactivation of autophagy proteins in C. elegans disrupts normal dauer formation.266 Fruit flies and spores also require autophagy to adapt to organismal nutrient starvation.144,274,275 Thus, in many instances of nutrient deprivation, cells rely on autophagy for survival.
A better understanding of the mechanisms used by quiescent cells to maintain their viability during quiescence and in low nutrient environments may result in tools that allow us to manipulate the quiescent state. This could potentially have ramifications for a wide range of fields. Many of the earth’s environments are low in nutrients and cannot sustain the growth of microbes.83 An understanding of these natural environments and the stationary phase state of the microorganisms in them could suggest improved antifungals or antibiotics.276,277 Anticancer therapies that target dormant cancer cells could represent a potent and new approach to preventing tumor recurrence. A mechanism to manipulate the quiescent state of lymphocytes could suggest new approaches for immunization strategies and new immunosuppressants. Finally, the phenotypes of aging may reflect the transition of quiescent cells to senescence or irreversible cell cycle arrest.278 Aging may also result from inappropriate activation and secondary depletion of stem cells. The ability to prevent this process could suggest strategies to slow the aging process. The ability to enter a hypometabolic state provides cells with a powerful mechanism for surviving during times when proliferation isn’t favored and nutrients are limiting. This capacity makes species resilient and makes it possible for life to flourish in a much wider array of conditions, locations and times than if cells did not have this remarkable capacity.
Footnotes
Previously published online: www.landesbioscience.com/journals/cc/article/19879
References
- 1.Gray JV, Petsko GA, Johnston GC, Ringe D, Singer RA, Werner-Washburne M. “Sleeping beauty”: quiescence in Saccharomyces cerevisiae. Microbiol Mol Biol Rev. 2004;68:187–206. doi: 10.1128/MMBR.68.2.187-206.2004. [DOI] [PMC free article] [PubMed] [Google Scholar]
- 2.Werner-Washburne M, Braun E, Johnston GC, Singer RA. Stationary phase in the yeast Saccharomyces cerevisiae. Microbiol Rev. 1993;57:383–401. doi: 10.1128/mr.57.2.383-401.1993. [DOI] [PMC free article] [PubMed] [Google Scholar]
- 3.Pringle JR, Hartwell LH. The Saccharomyces cerevisiae cell cycle. In: Broach JR, Strathern J, Jones H, eds. Molecular biology of the yeast Saccharomyces cerevisiae: life cycle and inheritance. Cold Spring Harbor, N.Y.: Cold Spring Harbor Laboratory, 1981: 97-142. [Google Scholar]
- 4.Johnston GC, Pringle JR, Hartwell LH. Coordination of growth with cell division in the yeast Saccharomyces cerevisiae. Exp Cell Res. 1977;105:79–98. doi: 10.1016/0014-4827(77)90154-9. [DOI] [PubMed] [Google Scholar]
- 5.Piñon R. Folded chromosomes in non-cycling yeast cells: evidence for a characteristic g0 form. Chromosoma. 1978;67:263–74. doi: 10.1007/BF02569039. [DOI] [PubMed] [Google Scholar]
- 6.Werner-Washburne M, Braun EL, Crawford ME, Peck VM. Stationary phase in Saccharomyces cerevisiae. Mol Microbiol. 1996;19:1159–66. doi: 10.1111/j.1365-2958.1996.tb02461.x. [DOI] [PubMed] [Google Scholar]
- 7.Fuge EK, Braun EL, Werner-Washburne M. Protein synthesis in long-term stationary-phase cultures of Saccharomyces cerevisiae. J Bacteriol. 1994;176:5802–13. doi: 10.1128/jb.176.18.5802-5813.1994. [DOI] [PMC free article] [PubMed] [Google Scholar]
- 8.Valentin M, Yang E. Autophagy is activated, but is not required for the G0 function of BCL-2 or BCL-xL. Cell Cycle. 2008;7:2762–8. doi: 10.4161/cc.7.17.6595. [DOI] [PubMed] [Google Scholar]
- 9.Reed SI. The role of p34 kinases in the G1 to S-phase transition. Annu Rev Cell Biol. 1992;8:529–61. doi: 10.1146/annurev.cb.08.110192.002525. [DOI] [PubMed] [Google Scholar]
- 10.Nasmyth K. Control of the yeast cell cycle by the Cdc28 protein kinase. Curr Opin Cell Biol. 1993;5:166–79. doi: 10.1016/0955-0674(93)90099-C. [DOI] [PubMed] [Google Scholar]
- 11.Costanzo M, Nishikawa JL, Tang X, Millman JS, Schub O, Breitkreuz K, et al. CDK activity antagonizes Whi5, an inhibitor of G1/S transcription in yeast. Cell. 2004;117:899–913. doi: 10.1016/j.cell.2004.05.024. [DOI] [PubMed] [Google Scholar]
- 12.Cipriano SC, Chen YQ. Insensitivity to growth inhibition by TGF-beta1 correlates with a lack of inhibition of the CDK2 activity in prostate carcinoma cells. Oncogene. 1998;17:1549–56. doi: 10.1038/sj.onc.1202069. [DOI] [PubMed] [Google Scholar]
- 13.Agus DB, Cordon-Cardo C, Fox W, Drobnjak M, Koff A, Golde DW, et al. Prostate cancer cell cycle regulators: response to androgen withdrawal and development of androgen independence. J Natl Cancer Inst. 1999;91:1869–76. doi: 10.1093/jnci/91.21.1869. [DOI] [PubMed] [Google Scholar]
- 14.Frith-Terhune A, Koh KN, Jin WJ, Chung KB, Park SK, Koh GY. Programmed changes of cell cycle regulators by serum deprivation regardless of skeletal myocyte differentiation. Mol Cells. 1998;8:637–46. [PubMed] [Google Scholar]
- 15.Resnitzky D, Hengst L, Reed SI. Cyclin A-associated kinase activity is rate limiting for entrance into S phase and is negatively regulated in G1 by p27Kip1. Mol Cell Biol. 1995;15:4347–52. doi: 10.1128/mcb.15.8.4347. [DOI] [PMC free article] [PubMed] [Google Scholar]
- 16.Coller HA, Sang L, Roberts JM. A new description of cellular quiescence. PLoS Biol. 2006;4:e83. doi: 10.1371/journal.pbio.0040083. [DOI] [PMC free article] [PubMed] [Google Scholar]
- 17.Walkley CR, Fero ML, Chien WM, Purton LE, McArthur GA. Negative cell-cycle regulators cooperatively control self-renewal and differentiation of haematopoietic stem cells. Nat Cell Biol. 2005;7:172–8. doi: 10.1038/ncb1214. [DOI] [PubMed] [Google Scholar]
- 18.Steinman R, Yaroslavskiy B, Goff JP, Alber SM, Watkins SC. Cdk-inhibitors and exit from quiescence in primitive haematopoietic cell subsets. Br J Haematol. 2004;124:358–65. doi: 10.1046/j.1365-2141.2003.04780.x. [DOI] [PubMed] [Google Scholar]
- 19.Russell RC, Fang C, Guan KL. An emerging role for TOR signaling in mammalian tissue and stem cell physiology. Development. 2011;138:3343–56. doi: 10.1242/dev.058230. [DOI] [PMC free article] [PubMed] [Google Scholar]
- 20.Rohde JR, Cardenas ME. Nutrient signaling through TOR kinases controls gene expression and cellular differentiation in fungi. Curr Top Microbiol Immunol. 2004;279:53–72. doi: 10.1007/978-3-642-18930-2_4. [DOI] [PubMed] [Google Scholar]
- 21.Hsu PP, Kang SA, Rameseder J, Zhang Y, Ottina KA, Lim D, et al. The mTOR-regulated phosphoproteome reveals a mechanism of mTORC1-mediated inhibition of growth factor signaling. Science. 2011;332:1317–22. doi: 10.1126/science.1199498. [DOI] [PMC free article] [PubMed] [Google Scholar]
- 22.Loewith R, Jacinto E, Wullschleger S, Lorberg A, Crespo JL, Bonenfant D, et al. Two TOR complexes, only one of which is rapamycin sensitive, have distinct roles in cell growth control. Mol Cell. 2002;10:457–68. doi: 10.1016/S1097-2765(02)00636-6. [DOI] [PubMed] [Google Scholar]
- 23.Ma XM, Blenis J. Molecular mechanisms of mTOR-mediated translational control. Nat Rev Mol Cell Biol. 2009;10:307–18. doi: 10.1038/nrm2672. [DOI] [PubMed] [Google Scholar]
- 24.Beretta L, Gingras AC, Svitkin YV, Hall MN, Sonenberg N. Rapamycin blocks the phosphorylation of 4E-BP1 and inhibits cap-dependent initiation of translation. EMBO J. 1996;15:658–64. [PMC free article] [PubMed] [Google Scholar]
- 25.Fingar DC, Salama S, Tsou C, Harlow E, Blenis J. Mammalian cell size is controlled by mTOR and its downstream targets S6K1 and 4EBP1/eIF4E. Genes Dev. 2002;16:1472–87. doi: 10.1101/gad.995802. [DOI] [PMC free article] [PubMed] [Google Scholar]
- 26.Duncan R, Milburn SC, Hershey JW. Regulated phosphorylation and low abundance of HeLa cell initiation factor eIF-4F suggest a role in translational control. Heat shock effects on eIF-4F. J Biol Chem. 1987;262:380–8. [PubMed] [Google Scholar]
- 27.Chou MM, Blenis J. The 70 kDa S6 kinase: regulation of a kinase with multiple roles in mitogenic signalling. Curr Opin Cell Biol. 1995;7:806–14. doi: 10.1016/0955-0674(95)80064-6. [DOI] [PubMed] [Google Scholar]
- 28.Ruvinsky I, Meyuhas O. Ribosomal protein S6 phosphorylation: from protein synthesis to cell size. Trends Biochem Sci. 2006;31:342–8. doi: 10.1016/j.tibs.2006.04.003. [DOI] [PubMed] [Google Scholar]
- 29.Wang X, Li W, Williams M, Terada N, Alessi DR, Proud CG. Regulation of elongation factor 2 kinase by p90(RSK1) and p70 S6 kinase. EMBO J. 2001;20:4370–9. doi: 10.1093/emboj/20.16.4370. [DOI] [PMC free article] [PubMed] [Google Scholar]
- 30.Shiota C, Woo JT, Lindner J, Shelton KD, Magnuson MA. Multiallelic disruption of the rictor gene in mice reveals that mTOR complex 2 is essential for fetal growth and viability. Dev Cell. 2006;11:583–9. doi: 10.1016/j.devcel.2006.08.013. [DOI] [PubMed] [Google Scholar]
- 31.Sarbassov DD, Guertin DA, Ali SM, Sabatini DM. Phosphorylation and regulation of Akt/PKB by the rictor-mTOR complex. Science. 2005;307:1098–101. doi: 10.1126/science.1106148. [DOI] [PubMed] [Google Scholar]
- 32.Hresko RC, Mueckler M. mTOR.RICTOR is the Ser473 kinase for Akt/protein kinase B in 3T3-L1 adipocytes. J Biol Chem. 2005;280:40406–16. doi: 10.1074/jbc.M508361200. [DOI] [PubMed] [Google Scholar]
- 33.Jacinto E, Loewith R, Schmidt A, Lin S, Rüegg MA, Hall A, et al. Mammalian TOR complex 2 controls the actin cytoskeleton and is rapamycin insensitive. Nat Cell Biol. 2004;6:1122–8. doi: 10.1038/ncb1183. [DOI] [PubMed] [Google Scholar]
- 34.Oldham S, Montagne J, Radimerski T, Thomas G, Hafen E. Genetic and biochemical characterization of dTOR, the Drosophila homolog of the target of rapamycin. Genes Dev. 2000;14:2689–94. doi: 10.1101/gad.845700. [DOI] [PMC free article] [PubMed] [Google Scholar]
- 35.Zhang H, Stallock JP, Ng JC, Reinhard C, Neufeld TP. Regulation of cellular growth by the Drosophila target of rapamycin dTOR. Genes Dev. 2000;14:2712–24. doi: 10.1101/gad.835000. [DOI] [PMC free article] [PubMed] [Google Scholar]
- 36.Sarbassov DD, Ali SM, Kim DH, Guertin DA, Latek RR, Erdjument-Bromage H, et al. Rictor, a novel binding partner of mTOR, defines a rapamycin-insensitive and raptor-independent pathway that regulates the cytoskeleton. Curr Biol. 2004;14:1296–302. doi: 10.1016/j.cub.2004.06.054. [DOI] [PubMed] [Google Scholar]
- 37.Patti ME, Kahn CR. The insulin receptor--a critical link in glucose homeostasis and insulin action. J Basic Clin Physiol Pharmacol. 1998;9:89–109. doi: 10.1515/JBCPP.1998.9.2-4.89. [DOI] [PubMed] [Google Scholar]
- 38.Wullschleger S, Loewith R, Hall MN. TOR signaling in growth and metabolism. Cell. 2006;124:471–84. doi: 10.1016/j.cell.2006.01.016. [DOI] [PubMed] [Google Scholar]
- 39.Vivanco I, Sawyers CL. The phosphatidylinositol 3-Kinase AKT pathway in human cancer. Nat Rev Cancer. 2002;2:489–501. doi: 10.1038/nrc839. [DOI] [PubMed] [Google Scholar]
- 40.Inoki K, Li Y, Zhu T, Wu J, Guan KL. TSC2 is phosphorylated and inhibited by Akt and suppresses mTOR signalling. Nat Cell Biol. 2002;4:648–57. doi: 10.1038/ncb839. [DOI] [PubMed] [Google Scholar]
- 41.Potter CJ, Pedraza LG, Xu T. Akt regulates growth by directly phosphorylating Tsc2. Nat Cell Biol. 2002;4:658–65. doi: 10.1038/ncb840. [DOI] [PubMed] [Google Scholar]
- 42.Miron M, Lasko P, Sonenberg N. Signaling from Akt to FRAP/TOR targets both 4E-BP and S6K in Drosophila melanogaster. Mol Cell Biol. 2003;23:9117–26. doi: 10.1128/MCB.23.24.9117-9126.2003. [DOI] [PMC free article] [PubMed] [Google Scholar]
- 43.Garami A, Zwartkruis FJ, Nobukuni T, Joaquin M, Roccio M, Stocker H, et al. Insulin activation of Rheb, a mediator of mTOR/S6K/4E-BP signaling, is inhibited by TSC1 and 2. Mol Cell. 2003;11:1457–66. doi: 10.1016/S1097-2765(03)00220-X. [DOI] [PubMed] [Google Scholar]
- 44.Inoki K, Li Y, Xu T, Guan KL. Rheb GTPase is a direct target of TSC2 GAP activity and regulates mTOR signaling. Genes Dev. 2003;17:1829–34. doi: 10.1101/gad.1110003. [DOI] [PMC free article] [PubMed] [Google Scholar]
- 45.Tee AR, Manning BD, Roux PP, Cantley LC, Blenis J. Tuberous sclerosis complex gene products, Tuberin and Hamartin, control mTOR signaling by acting as a GTPase-activating protein complex toward Rheb. Curr Biol. 2003;13:1259–68. doi: 10.1016/S0960-9822(03)00506-2. [DOI] [PubMed] [Google Scholar]
- 46.Inoki K, Zhu T, Guan KL. TSC2 mediates cellular energy response to control cell growth and survival. Cell. 2003;115:577–90. doi: 10.1016/S0092-8674(03)00929-2. [DOI] [PubMed] [Google Scholar]
- 47.Tee AR, Anjum R, Blenis J. Inactivation of the tuberous sclerosis complex-1 and -2 gene products occurs by phosphoinositide 3-kinase/Akt-dependent and -independent phosphorylation of tuberin. J Biol Chem. 2003;278:37288–96. doi: 10.1074/jbc.M303257200. [DOI] [PubMed] [Google Scholar]
- 48.Castro AF, Rebhun JF, Clark GJ, Quilliam LA. Rheb binds tuberous sclerosis complex 2 (TSC2) and promotes S6 kinase activation in a rapamycin- and farnesylation-dependent manner. J Biol Chem. 2003;278:32493–6. doi: 10.1074/jbc.C300226200. [DOI] [PubMed] [Google Scholar]
- 49.Manning BD, Cantley LC. Rheb fills a GAP between TSC and TOR. Trends Biochem Sci. 2003;28:573–6. doi: 10.1016/j.tibs.2003.09.003. [DOI] [PubMed] [Google Scholar]
- 50.Rameh LE, Cantley LC. The role of phosphoinositide 3-kinase lipid products in cell function. J Biol Chem. 1999;274:8347–50. doi: 10.1074/jbc.274.13.8347. [DOI] [PubMed] [Google Scholar]
- 51.Chan TO, Rittenhouse SE, Tsichlis PN. AKT/PKB and other D3 phosphoinositide-regulated kinases: kinase activation by phosphoinositide-dependent phosphorylation. Annu Rev Biochem. 1999;68:965–1014. doi: 10.1146/annurev.biochem.68.1.965. [DOI] [PubMed] [Google Scholar]
- 52.Jaeschke A, Hartkamp J, Saitoh M, Roworth W, Nobukuni T, Hodges A, et al. Tuberous sclerosis complex tumor suppressor-mediated S6 kinase inhibition by phosphatidylinositide-3-OH kinase is mTOR independent. J Cell Biol. 2002;159:217–24. doi: 10.1083/jcb.jcb.200206108. [DOI] [PMC free article] [PubMed] [Google Scholar]
- 53.Gao X, Zhang Y, Arrazola P, Hino O, Kobayashi T, Yeung RS, et al. Tsc tumour suppressor proteins antagonize amino-acid-TOR signalling. Nat Cell Biol. 2002;4:699–704. doi: 10.1038/ncb847. [DOI] [PubMed] [Google Scholar]
- 54.Tee AR, Fingar DC, Manning BD, Kwiatkowski DJ, Cantley LC, Blenis J. Tuberous sclerosis complex-1 and -2 gene products function together to inhibit mammalian target of rapamycin (mTOR)-mediated downstream signaling. Proc Natl Acad Sci U S A. 2002;99:13571–6. doi: 10.1073/pnas.202476899. [DOI] [PMC free article] [PubMed] [Google Scholar]
- 55.Manning BD, Tee AR, Logsdon MN, Blenis J, Cantley LC. Identification of the tuberous sclerosis complex-2 tumor suppressor gene product tuberin as a target of the phosphoinositide 3-kinase/akt pathway. Mol Cell. 2002;10:151–62. doi: 10.1016/S1097-2765(02)00568-3. [DOI] [PubMed] [Google Scholar]
- 56.Franz DN. Everolimus: an mTOR inhibitor for the treatment of tuberous sclerosis. Expert Rev Anticancer Ther. 2011;11:1181–92. doi: 10.1586/era.11.93. [DOI] [PubMed] [Google Scholar]
- 57.Shaw RJ, Kosmatka M, Bardeesy N, Hurley RL, Witters LA, DePinho RA, et al. The tumor suppressor LKB1 kinase directly activates AMP-activated kinase and regulates apoptosis in response to energy stress. Proc Natl Acad Sci U S A. 2004;101:3329–35. doi: 10.1073/pnas.0308061100. [DOI] [PMC free article] [PubMed] [Google Scholar]
- 58.Lizcano JM, Göransson O, Toth R, Deak M, Morrice NA, Boudeau J, et al. LKB1 is a master kinase that activates 13 kinases of the AMPK subfamily, including MARK/PAR-1. EMBO J. 2004;23:833–43. doi: 10.1038/sj.emboj.7600110. [DOI] [PMC free article] [PubMed] [Google Scholar]
- 59.Woods A, Johnstone SR, Dickerson K, Leiper FC, Fryer LG, Neumann D, et al. LKB1 is the upstream kinase in the AMP-activated protein kinase cascade. Curr Biol. 2003;13:2004–8. doi: 10.1016/j.cub.2003.10.031. [DOI] [PubMed] [Google Scholar]
- 60.Hawley SA, Boudeau J, Reid JL, Mustard KJ, Udd L, Mäkelä TP, et al. Complexes between the LKB1 tumor suppressor, STRAD alpha/beta and MO25 alpha/beta are upstream kinases in the AMP-activated protein kinase cascade. J Biol. 2003;2:28. doi: 10.1186/1475-4924-2-28. [DOI] [PMC free article] [PubMed] [Google Scholar]
- 61.Hardie DG. AMP-activated/SNF1 protein kinases: conserved guardians of cellular energy. Nat Rev Mol Cell Biol. 2007;8:774–85. doi: 10.1038/nrm2249. [DOI] [PubMed] [Google Scholar]
- 62.Gwinn DM, Shackelford DB, Egan DF, Mihaylova MM, Mery A, Vasquez DS, et al. AMPK phosphorylation of raptor mediates a metabolic checkpoint. Mol Cell. 2008;30:214–26. doi: 10.1016/j.molcel.2008.03.003. [DOI] [PMC free article] [PubMed] [Google Scholar]
- 63.Shaw RJ, Bardeesy N, Manning BD, Lopez L, Kosmatka M, DePinho RA, et al. The LKB1 tumor suppressor negatively regulates mTOR signaling. Cancer Cell. 2004;6:91–9. doi: 10.1016/j.ccr.2004.06.007. [DOI] [PubMed] [Google Scholar]
- 64.Barbet NC, Schneider U, Helliwell SB, Stansfield I, Tuite MF, Hall MN. TOR controls translation initiation and early G1 progression in yeast. Mol Biol Cell. 1996;7:25–42. doi: 10.1091/mbc.7.1.25. [DOI] [PMC free article] [PubMed] [Google Scholar]
- 65.Sousa-Nunes R, Yee LL, Gould AP. Fat cells reactivate quiescent neuroblasts via TOR and glial insulin relays in Drosophila. Nature. 2011;471:508–12. doi: 10.1038/nature09867. [DOI] [PMC free article] [PubMed] [Google Scholar]
- 66.Yang Z, Klionsky DJ. Eaten alive: a history of macroautophagy. Nat Cell Biol. 2010;12:814–22. doi: 10.1038/ncb0910-814. [DOI] [PMC free article] [PubMed] [Google Scholar]
- 67.Rabinowitz JD, White E. Autophagy and metabolism. Science. 2010;330:1344–8. doi: 10.1126/science.1193497. [DOI] [PMC free article] [PubMed] [Google Scholar]
- 68.Kim E, Goraksha-Hicks P, Li L, Neufeld TP, Guan KL. Regulation of TORC1 by Rag GTPases in nutrient response. Nat Cell Biol. 2008;10:935–45. doi: 10.1038/ncb1753. [DOI] [PMC free article] [PubMed] [Google Scholar]
- 69.Sancak Y, Bar-Peled L, Zoncu R, Markhard AL, Nada S, Sabatini DM. Ragulator-Rag complex targets mTORC1 to the lysosomal surface and is necessary for its activation by amino acids. Cell. 2010;141:290–303. doi: 10.1016/j.cell.2010.02.024. [DOI] [PMC free article] [PubMed] [Google Scholar]
- 70.Sancak Y, Peterson TR, Shaul YD, Lindquist RA, Thoreen CC, Bar-Peled L, et al. The Rag GTPases bind raptor and mediate amino acid signaling to mTORC1. Science. 2008;320:1496–501. doi: 10.1126/science.1157535. [DOI] [PMC free article] [PubMed] [Google Scholar]
- 71.Chang YY, Neufeld TP. An Atg1/Atg13 complex with multiple roles in TOR-mediated autophagy regulation. Mol Biol Cell. 2009;20:2004–14. doi: 10.1091/mbc.E08-12-1250. [DOI] [PMC free article] [PubMed] [Google Scholar]
- 72.Jung CH, Jun CB, Ro SH, Kim YM, Otto NM, Cao J, et al. ULK-Atg13-FIP200 complexes mediate mTOR signaling to the autophagy machinery. Mol Biol Cell. 2009;20:1992–2003. doi: 10.1091/mbc.E08-12-1249. [DOI] [PMC free article] [PubMed] [Google Scholar]
- 73.Kamada Y, Yoshino K, Kondo C, Kawamata T, Oshiro N, Yonezawa K, et al. Tor directly controls the Atg1 kinase complex to regulate autophagy. Mol Cell Biol. 2010;30:1049–58. doi: 10.1128/MCB.01344-09. [DOI] [PMC free article] [PubMed] [Google Scholar]
- 74.Hosokawa N, Hara T, Kaizuka T, Kishi C, Takamura A, Miura Y, et al. Nutrient-dependent mTORC1 association with the ULK1-Atg13-FIP200 complex required for autophagy. Mol Biol Cell. 2009;20:1981–91. doi: 10.1091/mbc.E08-12-1248. [DOI] [PMC free article] [PubMed] [Google Scholar]
- 75.Dunn WA., Jr. Autophagy and related mechanisms of lysosome-mediated protein degradation. Trends Cell Biol. 1994;4:139–43. doi: 10.1016/0962-8924(94)90069-8. [DOI] [PubMed] [Google Scholar]
- 76.Klionsky DJ, Emr SD. Autophagy as a regulated pathway of cellular degradation. Science. 2000;290:1717–21. doi: 10.1126/science.290.5497.1717. [DOI] [PMC free article] [PubMed] [Google Scholar]
- 77.Tsukamoto S, Kuma A, Murakami M, Kishi C, Yamamoto A, Mizushima N. Autophagy is essential for preimplantation development of mouse embryos. Science. 2008;321:117–20. doi: 10.1126/science.1154822. [DOI] [PubMed] [Google Scholar]
- 78.Komatsu M, Waguri S, Ueno T, Iwata J, Murata S, Tanida I, et al. Impairment of starvation-induced and constitutive autophagy in Atg7-deficient mice. J Cell Biol. 2005;169:425–34. doi: 10.1083/jcb.200412022. [DOI] [PMC free article] [PubMed] [Google Scholar]
- 79.Kuma A, Hatano M, Matsui M, Yamamoto A, Nakaya H, Yoshimori T, et al. The role of autophagy during the early neonatal starvation period. Nature. 2004;432:1032–6. doi: 10.1038/nature03029. [DOI] [PubMed] [Google Scholar]
- 80.Sou YS, Waguri S, Iwata J, Ueno T, Fujimura T, Hara T, et al. The Atg8 conjugation system is indispensable for proper development of autophagic isolation membranes in mice. Mol Biol Cell. 2008;19:4762–75. doi: 10.1091/mbc.E08-03-0309. [DOI] [PMC free article] [PubMed] [Google Scholar]
- 81.Berry DL, Baehrecke EH. Growth arrest and autophagy are required for salivary gland cell degradation in Drosophila. Cell. 2007;131:1137–48. doi: 10.1016/j.cell.2007.10.048. [DOI] [PMC free article] [PubMed] [Google Scholar]
- 82.Mizushima N, Komatsu M. Autophagy: renovation of cells and tissues. Cell. 2011;147:728–41. doi: 10.1016/j.cell.2011.10.026. [DOI] [PubMed] [Google Scholar]
- 83.Navarro Llorens JM, Tormo A, Martínez-García E. Stationary phase in gram-negative bacteria. FEMS Microbiol Rev. 2010;34:476–95. doi: 10.1111/j.1574-6976.2010.00213.x. [DOI] [PubMed] [Google Scholar]
- 84.Lacour S, Landini P. SigmaS-dependent gene expression at the onset of stationary phase in Escherichia coli: function of sigmaS-dependent genes and identification of their promoter sequences. J Bacteriol. 2004;186:7186–95. doi: 10.1128/JB.186.21.7186-7195.2004. [DOI] [PMC free article] [PubMed] [Google Scholar]
- 85.Weber H, Polen T, Heuveling J, Wendisch VF, Hengge R. Genome-wide analysis of the general stress response network in Escherichia coli: sigmaS-dependent genes, promoters, and sigma factor selectivity. J Bacteriol. 2005;187:1591–603. doi: 10.1128/JB.187.5.1591-1603.2005. [DOI] [PMC free article] [PubMed] [Google Scholar]
- 86.Hengge-Aronis R. Signal transduction and regulatory mechanisms involved in control of the sigma(S) (RpoS) subunit of RNA polymerase. Microbiol Mol Biol Rev. 2002;66:373–95. doi: 10.1128/MMBR.66.3.373-395.2002. [table of contents.] [DOI] [PMC free article] [PubMed] [Google Scholar]
- 87.Jenkins DE, Chaisson SA, Matin A. Starvation-induced cross protection against osmotic challenge in Escherichia coli. J Bacteriol. 1990;172:2779–81. doi: 10.1128/jb.172.5.2779-2781.1990. [DOI] [PMC free article] [PubMed] [Google Scholar]
- 88.Givskov M, Eberl L, Møller S, Poulsen LK, Molin S. Responses to nutrient starvation in Pseudomonas putida KT2442: analysis of general cross-protection, cell shape, and macromolecular content. J Bacteriol. 1994;176:7–14. doi: 10.1128/jb.176.1.7-14.1994. [DOI] [PMC free article] [PubMed] [Google Scholar]
- 89.Zambrano MM, Siegele DA, Almirón M, Tormo A, Kolter R. Microbial competition: Escherichia coli mutants that take over stationary phase cultures. Science. 1993;259:1757–60. doi: 10.1126/science.7681219. [DOI] [PubMed] [Google Scholar]
- 90.Reeve CA, Amy PS, Matin A. Role of protein synthesis in the survival of carbon-starved Escherichia coli K-12. J Bacteriol. 1984;160:1041–6. doi: 10.1128/jb.160.3.1041-1046.1984. [DOI] [PMC free article] [PubMed] [Google Scholar]
- 91.Yoshida H, Maki Y, Kato H, Fujisawa H, Izutsu K, Wada C, et al. The ribosome modulation factor (RMF) binding site on the 100S ribosome of Escherichia coli. J Biochem. 2002;132:983–9. doi: 10.1093/oxfordjournals.jbchem.a003313. [DOI] [PubMed] [Google Scholar]
- 92.Brown L, Gentry D, Elliott T, Cashel M. DksA affects ppGpp induction of RpoS at a translational level. J Bacteriol. 2002;184:4455–65. doi: 10.1128/JB.184.16.4455-4465.2002. [DOI] [PMC free article] [PubMed] [Google Scholar]
- 93.Nyström T. Stationary-phase physiology. Annu Rev Microbiol. 2004;58:161–81. doi: 10.1146/annurev.micro.58.030603.123818. [DOI] [PubMed] [Google Scholar]
- 94.Nyström T, Larsson C, Gustafsson L. Bacterial defense against aging: role of the Escherichia coli ArcA regulator in gene expression, readjusted energy flux and survival during stasis. EMBO J. 1996;15:3219–28. [PMC free article] [PubMed] [Google Scholar]
- 95.Groat RG, Schultz JE, Zychlinsky E, Bockman A, Matin A. Starvation proteins in Escherichia coli: kinetics of synthesis and role in starvation survival. J Bacteriol. 1986;168:486–93. doi: 10.1128/jb.168.2.486-493.1986. [DOI] [PMC free article] [PubMed] [Google Scholar]
- 96.Reeve CA, Bockman AT, Matin A. Role of protein degradation in the survival of carbon-starved Escherichia coli and Salmonella typhimurium. J Bacteriol. 1984;157:758–63. doi: 10.1128/jb.157.3.758-763.1984. [DOI] [PMC free article] [PubMed] [Google Scholar]
- 97.Weichart D, Querfurth N, Dreger M, Hengge-Aronis R. Global role for ClpP-containing proteases in stationary-phase adaptation of Escherichia coli. J Bacteriol. 2003;185:115–25. doi: 10.1128/JB.185.1.115-125.2003. [DOI] [PMC free article] [PubMed] [Google Scholar]
- 98.Thevelein JM, Cauwenberg L, Colombo S, Donation M, Dumortier F, Kraakman L, et al. De Winde JH. Van Dijck P Nutrient-induced signal transduction through the protein kinase A pathway and its role in the control of metabolism, stress resistance, and growth in yeast. Enzyme Microb Technol. 2000;26:819–25. doi: 10.1016/S0141-0229(00)00177-0. [DOI] [PubMed] [Google Scholar]
- 99.Allen C, Büttner S, Aragon AD, Thomas JA, Meirelles O, Jaetao JE, et al. Isolation of quiescent and nonquiescent cells from yeast stationary-phase cultures. J Cell Biol. 2006;174:89–100. doi: 10.1083/jcb.200604072. [DOI] [PMC free article] [PubMed] [Google Scholar]
- 100.Choder M. A general topoisomerase I-dependent transcriptional repression in the stationary phase in yeast. Genes Dev. 1991;5(12A):2315–26. doi: 10.1101/gad.5.12a.2315. [DOI] [PubMed] [Google Scholar]
- 101.Lillie SH, Pringle JR. Reserve carbohydrate metabolism in Saccharomyces cerevisiae: responses to nutrient limitation. J Bacteriol. 1980;143:1384–94. doi: 10.1128/jb.143.3.1384-1394.1980. [DOI] [PMC free article] [PubMed] [Google Scholar]
- 102.Silljé HH, ter Schure EG, Rommens AJ, Huls PG, Woldringh CL, Verkleij AJ, et al. Effects of different carbon fluxes on G1 phase duration, cyclin expression, and reserve carbohydrate metabolism in Saccharomyces cerevisiae. J Bacteriol. 1997;179:6560–5. doi: 10.1128/jb.179.21.6560-6565.1997. [DOI] [PMC free article] [PubMed] [Google Scholar]
- 103.Silljé HH, Paalman JW, ter Schure EG, Olsthoorn SQ, Verkleij AJ, Boonstra J, et al. Function of trehalose and glycogen in cell cycle progression and cell viability in Saccharomyces cerevisiae. J Bacteriol. 1999;181:396–400. doi: 10.1128/jb.181.2.396-400.1999. [DOI] [PMC free article] [PubMed] [Google Scholar]
- 104.François J, Parrou JL. Reserve carbohydrates metabolism in the yeast Saccharomyces cerevisiae. FEMS Microbiol Rev. 2001;25:125–45. doi: 10.1016/S0168-6445(00)00059-0. [DOI] [PubMed] [Google Scholar]
- 105.Shi L, Sutter BM, Ye X, Tu BP. Trehalose is a key determinant of the quiescent metabolic state that fuels cell cycle progression upon return to growth. Mol Biol Cell. 2010;21:1982–90. doi: 10.1091/mbc.E10-01-0056. [DOI] [PMC free article] [PubMed] [Google Scholar]
- 106.Slaughter JC, Nomura T. Intracellular glycogen and trehalose contents as predictors of yeast viability. Enzyme Microb Technol. 1992;14:64–7. doi: 10.1016/0141-0229(92)90028-M. [DOI] [Google Scholar]
- 107.Singer MA, Lindquist S. Multiple effects of trehalose on protein folding in vitro and in vivo. Mol Cell. 1998;1:639–48. doi: 10.1016/S1097-2765(00)80064-7. [DOI] [PubMed] [Google Scholar]
- 108.Luyckx J, Baudouin C. Trehalose: an intriguing disaccharide with potential for medical application in ophthalmology. Clin Ophthalmol. 2011;5:577–81. doi: 10.2147/OPTH.S18827. [DOI] [PMC free article] [PubMed] [Google Scholar]
- 109.Kandror O, Bretschneider N, Kreydin E, Cavalieri D, Goldberg AL. Yeast adapt to near-freezing temperatures by STRE/Msn2,4-dependent induction of trehalose synthesis and certain molecular chaperones. Mol Cell. 2004;13:771–81. doi: 10.1016/S1097-2765(04)00148-0. [DOI] [PubMed] [Google Scholar]
- 110.Teramoto N, Sachinvala ND, Shibata M. Trehalose and trehalose-based polymers for environmentally benign, biocompatible and bioactive materials. Molecules. 2008;13:1773–816. doi: 10.3390/molecules13081773. [DOI] [PMC free article] [PubMed] [Google Scholar]
- 111.Leidy C, Gousset K, Ricker J, Wolkers WF, Tsvetkova NM, Tablin F, et al. Lipid phase behavior and stabilization of domains in membranes of platelets. Cell Biochem Biophys. 2004;40:123–48. doi: 10.1385/CBB:40:2:123. [DOI] [PubMed] [Google Scholar]
- 112.Singer MA, Lindquist S. Thermotolerance in Saccharomyces cerevisiae: the Yin and Yang of trehalose. Trends Biotechnol. 1998;16:460–8. doi: 10.1016/S0167-7799(98)01251-7. [DOI] [PubMed] [Google Scholar]
- 113.Heitman J, Movva NR, Hall MN. Targets for cell cycle arrest by the immunosuppressant rapamycin in yeast. Science. 1991;253:905–9. doi: 10.1126/science.1715094. [DOI] [PubMed] [Google Scholar]
- 114.Kunz J, Henriquez R, Schneider U, Deuter-Reinhard M, Movva NR, Hall MN. Target of rapamycin in yeast, TOR2, is an essential phosphatidylinositol kinase homolog required for G1 progression. Cell. 1993;73:585–96. doi: 10.1016/0092-8674(93)90144-F. [DOI] [PubMed] [Google Scholar]
- 115.Hardwick JS, Kuruvilla FG, Tong JK, Shamji AF, Schreiber SL. Rapamycin-modulated transcription defines the subset of nutrient-sensitive signaling pathways directly controlled by the Tor proteins. Proc Natl Acad Sci U S A. 1999;96:14866–70. doi: 10.1073/pnas.96.26.14866. [DOI] [PMC free article] [PubMed] [Google Scholar]
- 116.Noda T, Ohsumi Y. Tor, a phosphatidylinositol kinase homologue, controls autophagy in yeast. J Biol Chem. 1998;273:3963–6. doi: 10.1074/jbc.273.7.3963. [DOI] [PubMed] [Google Scholar]
- 117.Rohde JR, Bastidas R, Puria R, Cardenas ME. Nutritional control via Tor signaling in Saccharomyces cerevisiae. Curr Opin Microbiol. 2008;11:153–60. doi: 10.1016/j.mib.2008.02.013. [DOI] [PMC free article] [PubMed] [Google Scholar]
- 118.De Virgilio C, Loewith R. Cell growth control: little eukaryotes make big contributions. Oncogene. 2006;25:6392–415. doi: 10.1038/sj.onc.1209884. [DOI] [PubMed] [Google Scholar]
- 119.Crespo JL, Hall MN. Elucidating TOR signaling and rapamycin action: lessons from Saccharomyces cerevisiae. Microbiol Mol Biol Rev. 2002;66:579–91. doi: 10.1128/MMBR.66.4.579-591.2002. [table of contents.] [DOI] [PMC free article] [PubMed] [Google Scholar]
- 120.Kuruvilla FG, Shamji AF, Schreiber SL. Carbon- and nitrogen-quality signaling to translation are mediated by distinct GATA-type transcription factors. Proc Natl Acad Sci U S A. 2001;98:7283–8. doi: 10.1073/pnas.121186898. [DOI] [PMC free article] [PubMed] [Google Scholar]
- 121.Gingras AC, Raught B, Sonenberg N. Regulation of translation initiation by FRAP/mTOR. Genes Dev. 2001;15:807–26. doi: 10.1101/gad.887201. [DOI] [PubMed] [Google Scholar]
- 122.Cosentino GP, Schmelzle T, Haghighat A, Helliwell SB, Hall MN, Sonenberg N. Eap1p, a novel eukaryotic translation initiation factor 4E-associated protein in Saccharomyces cerevisiae. Mol Cell Biol. 2000;20:4604–13. doi: 10.1128/MCB.20.13.4604-4613.2000. [DOI] [PMC free article] [PubMed] [Google Scholar]
- 123.Berset C, Trachsel H, Altmann M. The TOR (target of rapamycin) signal transduction pathway regulates the stability of translation initiation factor eIF4G in the yeast Saccharomyces cerevisiae. Proc Natl Acad Sci U S A. 1998;95:4264–9. doi: 10.1073/pnas.95.8.4264. [DOI] [PMC free article] [PubMed] [Google Scholar]
- 124.Powers T, Walter P. Regulation of ribosome biogenesis by the rapamycin-sensitive TOR-signaling pathway in Saccharomyces cerevisiae. Mol Biol Cell. 1999;10:987–1000. doi: 10.1091/mbc.10.4.987. [DOI] [PMC free article] [PubMed] [Google Scholar]
- 125.Urban J, Soulard A, Huber A, Lippman S, Mukhopadhyay D, Deloche O, et al. Sch9 is a major target of TORC1 in Saccharomyces cerevisiae. Mol Cell. 2007;26:663–74. doi: 10.1016/j.molcel.2007.04.020. [DOI] [PubMed] [Google Scholar]
- 126.Jorgensen P, Rupes I, Sharom JR, Schneper L, Broach JR, Tyers M. A dynamic transcriptional network communicates growth potential to ribosome synthesis and critical cell size. Genes Dev. 2004;18:2491–505. doi: 10.1101/gad.1228804. [DOI] [PMC free article] [PubMed] [Google Scholar]
- 127.Jorgensen P, Nishikawa JL, Breitkreutz BJ, Tyers M. Systematic identification of pathways that couple cell growth and division in yeast. Science. 2002;297:395–400. doi: 10.1126/science.1070850. [DOI] [PubMed] [Google Scholar]
- 128.Huber A, Bodenmiller B, Uotila A, Stahl M, Wanka S, Gerrits B, et al. Characterization of the rapamycin-sensitive phosphoproteome reveals that Sch9 is a central coordinator of protein synthesis. Genes Dev. 2009;23:1929–43. doi: 10.1101/gad.532109. [DOI] [PMC free article] [PubMed] [Google Scholar]
- 129.Huber A, French SL, Tekotte H, Yerlikaya S, Stahl M, Perepelkina MP, et al. Sch9 regulates ribosome biogenesis via Stb3, Dot6 and Tod6 and the histone deacetylase complex RPD3L. EMBO J. 2011;30:3052–64. doi: 10.1038/emboj.2011.221. [DOI] [PMC free article] [PubMed] [Google Scholar]
- 130.Kim JE, Chen J. Cytoplasmic-nuclear shuttling of FKBP12-rapamycin-associated protein is involved in rapamycin-sensitive signaling and translation initiation. Proc Natl Acad Sci U S A. 2000;97:14340–5. doi: 10.1073/pnas.011511898. [DOI] [PMC free article] [PubMed] [Google Scholar]
- 131.Di Como CJ, Arndt KT. Nutrients, via the Tor proteins, stimulate the association of Tap42 with type 2A phosphatases. Genes Dev. 1996;10:1904–16. doi: 10.1101/gad.10.15.1904. [DOI] [PubMed] [Google Scholar]
- 132.Jiang Y, Broach JR. Tor proteins and protein phosphatase 2A reciprocally regulate Tap42 in controlling cell growth in yeast. EMBO J. 1999;18:2782–92. doi: 10.1093/emboj/18.10.2782. [DOI] [PMC free article] [PubMed] [Google Scholar]
- 133.Düvel K, Broach JR. The role of phosphatases in TOR signaling in yeast. Curr Top Microbiol Immunol. 2004;279:19–38. doi: 10.1007/978-3-642-18930-2_2. [DOI] [PubMed] [Google Scholar]
- 134.Arndt KT, Styles CA, Fink GR. A suppressor of a HIS4 transcriptional defect encodes a protein with homology to the catalytic subunit of protein phosphatases. Cell. 1989;56:527–37. doi: 10.1016/0092-8674(89)90576-X. [DOI] [PubMed] [Google Scholar]
- 135.Sutton A, Immanuel D, Arndt KT. The SIT4 protein phosphatase functions in late G1 for progression into S phase. Mol Cell Biol. 1991;11:2133–48. doi: 10.1128/mcb.11.4.2133. [DOI] [PMC free article] [PubMed] [Google Scholar]
- 136.Beck T, Hall MN. The TOR signalling pathway controls nuclear localization of nutrient-regulated transcription factors. Nature. 1999;402:689–92. doi: 10.1038/45287. [DOI] [PubMed] [Google Scholar]
- 137.Schmidt A, Beck T, Koller A, Kunz J, Hall MN. The TOR nutrient signalling pathway phosphorylates NPR1 and inhibits turnover of the tryptophan permease. EMBO J. 1998;17:6924–31. doi: 10.1093/emboj/17.23.6924. [DOI] [PMC free article] [PubMed] [Google Scholar]
- 138.Jacinto E, Guo B, Arndt KT, Schmelzle T, Hall MN. TIP41 interacts with TAP42 and negatively regulates the TOR signaling pathway. Mol Cell. 2001;8:1017–26. doi: 10.1016/S1097-2765(01)00386-0. [DOI] [PubMed] [Google Scholar]
- 139.Roosen J, Engelen K, Marchal K, Mathys J, Griffioen G, Cameroni E, et al. PKA and Sch9 control a molecular switch important for the proper adaptation to nutrient availability. Mol Microbiol. 2005;55:862–80. doi: 10.1111/j.1365-2958.2004.04429.x. [DOI] [PubMed] [Google Scholar]
- 140.Cherkasova VA, Hinnebusch AG. Translational control by TOR and TAP42 through dephosphorylation of eIF2alpha kinase GCN2. Genes Dev. 2003;17:859–72. doi: 10.1101/gad.1069003. [DOI] [PMC free article] [PubMed] [Google Scholar]
- 141.Cameroni E, Hulo N, Roosen J, Winderickx J, De Virgilio C. The novel yeast PAS kinase Rim 15 orchestrates G0-associated antioxidant defense mechanisms. Cell Cycle. 2004;3:462–8. doi: 10.4161/cc.3.4.791. [DOI] [PubMed] [Google Scholar]
- 142.Fabrizio P, Pletcher SD, Minois N, Vaupel JW, Longo VD. Chronological aging-independent replicative life span regulation by Msn2/Msn4 and Sod2 in Saccharomyces cerevisiae. FEBS Lett. 2004;557:136–42. doi: 10.1016/S0014-5793(03)01462-5. [DOI] [PubMed] [Google Scholar]
- 143.Longo VD, Gralla EB, Valentine JS. Superoxide dismutase activity is essential for stationary phase survival in Saccharomyces cerevisiae. Mitochondrial production of toxic oxygen species in vivo. J Biol Chem. 1996;271:12275–80. doi: 10.1074/jbc.271.21.12275. [DOI] [PubMed] [Google Scholar]
- 144.Tsukada M, Ohsumi Y. Isolation and characterization of autophagy-defective mutants of Saccharomyces cerevisiae. FEBS Lett. 1993;333:169–74. doi: 10.1016/0014-5793(93)80398-E. [DOI] [PubMed] [Google Scholar]
- 145.Onodera J, Ohsumi Y. Autophagy is required for maintenance of amino acid levels and protein synthesis under nitrogen starvation. J Biol Chem. 2005;280:31582–6. doi: 10.1074/jbc.M506736200. [DOI] [PubMed] [Google Scholar]
- 146.Suzuki SW, Onodera J, Ohsumi Y. Starvation induced cell death in autophagy-defective yeast mutants is caused by mitochondria dysfunction. PLoS One. 2011;6:e17412. doi: 10.1371/journal.pone.0017412. [DOI] [PMC free article] [PubMed] [Google Scholar]
- 147.Kamada Y, Funakoshi T, Shintani T, Nagano K, Ohsumi M, Ohsumi Y. Tor-mediated induction of autophagy via an Apg1 protein kinase complex. J Cell Biol. 2000;150:1507–13. doi: 10.1083/jcb.150.6.1507. [DOI] [PMC free article] [PubMed] [Google Scholar]
- 148.Kamada Y, Sekito T, Ohsumi Y. Autophagy in yeast: a TOR-mediated response to nutrient starvation. Curr Top Microbiol Immunol. 2004;279:73–84. doi: 10.1007/978-3-642-18930-2_5. [DOI] [PubMed] [Google Scholar]
- 149.Prasad KV, Cai YC, Raab M, Duckworth B, Cantley L, Shoelson SE, et al. T-cell antigen CD28 interacts with the lipid kinase phosphatidylinositol 3-kinase by a cytoplasmic Tyr(P)-Met-Xaa-Met motif. Proc Natl Acad Sci U S A. 1994;91:2834–8. doi: 10.1073/pnas.91.7.2834. [DOI] [PMC free article] [PubMed] [Google Scholar]
- 150.Pagès F, Ragueneau M, Rottapel R, Truneh A, Nunes J, Imbert J, et al. Binding of phosphatidylinositol-3-OH kinase to CD28 is required for T-cell signalling. Nature. 1994;369:327–9. doi: 10.1038/369327a0. [DOI] [PubMed] [Google Scholar]
- 151.August A, Dupont B. CD28 of T lymphocytes associates with phosphatidylinositol 3-kinase. Int Immunol. 1994;6:769–74. doi: 10.1093/intimm/6.5.769. [DOI] [PubMed] [Google Scholar]
- 152.Krauss S, Brand MD, Buttgereit F. Signaling takes a breath--new quantitative perspectives on bioenergetics and signal transduction. Immunity. 2001;15:497–502. doi: 10.1016/S1074-7613(01)00205-9. [DOI] [PubMed] [Google Scholar]
- 153.Edinger AL, Thompson CB. Akt maintains cell size and survival by increasing mTOR-dependent nutrient uptake. Mol Biol Cell. 2002;13:2276–88. doi: 10.1091/mbc.01-12-0584. [DOI] [PMC free article] [PubMed] [Google Scholar]
- 154.Rathmell JC, Vander Heiden MG, Harris MH, Frauwirth KA, Thompson CB. In the absence of extrinsic signals, nutrient utilization by lymphocytes is insufficient to maintain either cell size or viability. Mol Cell. 2000;6:683–92. doi: 10.1016/S1097-2765(00)00066-6. [DOI] [PubMed] [Google Scholar]
- 155.Kan O, Baldwin SA, Whetton AD. Apoptosis is regulated by the rate of glucose transport in an interleukin 3 dependent cell line. J Exp Med. 1994;180:917–23. doi: 10.1084/jem.180.3.917. [DOI] [PMC free article] [PubMed] [Google Scholar]
- 156.Rathmell JC, Fox CJ, Plas DR, Hammerman PS, Cinalli RM, Thompson CB. Akt-directed glucose metabolism can prevent Bax conformation change and promote growth factor-independent survival. Mol Cell Biol. 2003;23:7315–28. doi: 10.1128/MCB.23.20.7315-7328.2003. [DOI] [PMC free article] [PubMed] [Google Scholar]
- 157.Fox CJ, Hammerman PS, Thompson CB. Fuel feeds function: energy metabolism and the T-cell response. Nat Rev Immunol. 2005;5:844–52. doi: 10.1038/nri1710. [DOI] [PubMed] [Google Scholar]
- 158.Bental M, Deutsch C. Metabolic changes in activated T cells: an NMR study of human peripheral blood lymphocytes. Magn Reson Med. 1993;29:317–26. doi: 10.1002/mrm.1910290307. [DOI] [PubMed] [Google Scholar]
- 159.Brand K. Glutamine and glucose metabolism during thymocyte proliferation. Pathways of glutamine and glutamate metabolism. Biochem J. 1985;228:353–61. doi: 10.1042/bj2280353. [DOI] [PMC free article] [PubMed] [Google Scholar]
- 160.Roos D, Loos JA. Changes in the carbohydrate metabolism of mitogenically stimulated human peripheral lymphocytes. I. Stimulation by phytohaemagglutinin. Biochim Biophys Acta. 1970;222:565–82. doi: 10.1016/0304-4165(70)90182-0. [DOI] [PubMed] [Google Scholar]
- 161.Hedeskov CJ. Early effects of phytohaemagglutinin on glucose metabolism of normal human lymphocytes. Biochem J. 1968;110:373–80. doi: 10.1042/bj1100373. [DOI] [PMC free article] [PubMed] [Google Scholar]
- 162.Culvenor JG, Weidemann MJ. Phytohaemagglutinin stimulation of rat thymus lymphocytes glycolysis. Biochim Biophys Acta. 1976;437:354–63. doi: 10.1016/0304-4165(76)90005-2. [DOI] [PubMed] [Google Scholar]
- 163.Jones RG, Thompson CB. Revving the engine: signal transduction fuels T cell activation. Immunity. 2007;27:173–8. doi: 10.1016/j.immuni.2007.07.008. [DOI] [PubMed] [Google Scholar]
- 164.Bauer DE, Harris MH, Plas DR, Lum JJ, Hammerman PS, Rathmell JC, et al. Cytokine stimulation of aerobic glycolysis in hematopoietic cells exceeds proliferative demand. FASEB J. 2004;18:1303–5. doi: 10.1096/fj.03-1001fje. [DOI] [PMC free article] [PubMed] [Google Scholar]
- 165.Kim JW, Dang CV. Cancer’s molecular sweet tooth and the Warburg effect. Cancer Res. 2006;66:8927–30. doi: 10.1158/0008-5472.CAN-06-1501. [DOI] [PubMed] [Google Scholar]
- 166.Shaw RJ. Glucose metabolism and cancer. Curr Opin Cell Biol. 2006;18:598–608. doi: 10.1016/j.ceb.2006.10.005. [DOI] [PubMed] [Google Scholar]
- 167.Watson RT, Kanzaki M, Pessin JE. Regulated membrane trafficking of the insulin-responsive glucose transporter 4 in adipocytes. Endocr Rev. 2004;25:177–204. doi: 10.1210/er.2003-0011. [DOI] [PubMed] [Google Scholar]
- 168.Dugani CB, Klip A. Glucose transporter 4: cycling, compartments and controversies. EMBO Rep. 2005;6:1137–42. doi: 10.1038/sj.embor.7400584. [DOI] [PMC free article] [PubMed] [Google Scholar]
- 169.Koistinen HA, Zierath JR. Regulation of glucose transport in human skeletal muscle. Ann Med. 2002;34:410–8. doi: 10.1080/078538902321012351. [DOI] [PubMed] [Google Scholar]
- 170.Bentley J, Itchayanan D, Barnes K, McIntosh E, Tang X, Downes CP, et al. Interleukin-3-mediated cell survival signals include phosphatidylinositol 3-kinase-dependent translocation of the glucose transporter GLUT1 to the cell surface. J Biol Chem. 2003;278:39337–48. doi: 10.1074/jbc.M305689200. [DOI] [PubMed] [Google Scholar]
- 171.Vander Heiden MG, Plas DR, Rathmell JC, Fox CJ, Harris MH, Thompson CB. Growth factors can influence cell growth and survival through effects on glucose metabolism. Mol Cell Biol. 2001;21:5899–912. doi: 10.1128/MCB.21.17.5899-5912.2001. [DOI] [PMC free article] [PubMed] [Google Scholar]
- 172.Edinger AL, Cinalli RM, Thompson CB. Rab7 prevents growth factor-independent survival by inhibiting cell-autonomous nutrient transporter expression. Dev Cell. 2003;5:571–82. doi: 10.1016/S1534-5807(03)00291-0. [DOI] [PubMed] [Google Scholar]
- 173.Wieman HL, Wofford JA, Rathmell JC. Cytokine stimulation promotes glucose uptake via phosphatidylinositol-3 kinase/Akt regulation of Glut1 activity and trafficking. Mol Biol Cell. 2007;18:1437–46. doi: 10.1091/mbc.E06-07-0593. [DOI] [PMC free article] [PubMed] [Google Scholar]
- 174.Frauwirth KA, Thompson CB. Regulation of T lymphocyte metabolism. J Immunol. 2004;172:4661–5. doi: 10.4049/jimmunol.172.8.4661. [DOI] [PubMed] [Google Scholar]
- 175.Rathmell JC, Farkash EA, Gao W, Thompson CB. IL-7 enhances the survival and maintains the size of naive T cells. J Immunol. 2001;167:6869–76. doi: 10.4049/jimmunol.167.12.6869. [DOI] [PubMed] [Google Scholar]
- 176.Cheng EH, Wei MC, Weiler S, Flavell RA, Mak TW, Lindsten T, et al. BCL-2, BCL-X(L) sequester BH3 domain-only molecules preventing BAX- and BAK-mediated mitochondrial apoptosis. Mol Cell. 2001;8:705–11. doi: 10.1016/S1097-2765(01)00320-3. [DOI] [PubMed] [Google Scholar]
- 177.Wei MC, Zong WX, Cheng EH, Lindsten T, Panoutsakopoulou V, Ross AJ, et al. Proapoptotic BAX and BAK: a requisite gateway to mitochondrial dysfunction and death. Science. 2001;292:727–30. doi: 10.1126/science.1059108. [DOI] [PMC free article] [PubMed] [Google Scholar]
- 178.Lum JJ, Bauer DE, Kong M, Harris MH, Li C, Lindsten T, et al. Growth factor regulation of autophagy and cell survival in the absence of apoptosis. Cell. 2005;120:237–48. doi: 10.1016/j.cell.2004.11.046. [DOI] [PubMed] [Google Scholar]
- 179.Pua HH, Dzhagalov I, Chuck M, Mizushima N, He YW. A critical role for the autophagy gene Atg5 in T cell survival and proliferation. J Exp Med. 2007;204:25–31. doi: 10.1084/jem.20061303. [DOI] [PMC free article] [PubMed] [Google Scholar]
- 180.Gerland LM, Genestier L, Peyrol S, Michallet MC, Hayette S, Urbanowicz I, et al. Autolysosomes accumulate during in vitro CD8+ T-lymphocyte aging and may participate in induced death sensitization of senescent cells. Exp Gerontol. 2004;39:789–800. doi: 10.1016/j.exger.2004.01.013. [DOI] [PubMed] [Google Scholar]
- 181.Espert L, Denizot M, Grimaldi M, Robert-Hebmann V, Gay B, Varbanov M, et al. Autophagy is involved in T cell death after binding of HIV-1 envelope proteins to CXCR4. J Clin Invest. 2006;116:2161–72. doi: 10.1172/JCI26185. [DOI] [PMC free article] [PubMed] [Google Scholar]
- 182.Orkin SH, Zon LI. Hematopoiesis: an evolving paradigm for stem cell biology. Cell. 2008;132:631–44. doi: 10.1016/j.cell.2008.01.025. [DOI] [PMC free article] [PubMed] [Google Scholar]
- 183.Zhang J, Niu C, Ye L, Huang H, He X, Tong WG, et al. Identification of the haematopoietic stem cell niche and control of the niche size. Nature. 2003;425:836–41. doi: 10.1038/nature02041. [DOI] [PubMed] [Google Scholar]
- 184.Calvi LM, Adams GB, Weibrecht KW, Weber JM, Olson DP, Knight MC, et al. Osteoblastic cells regulate the haematopoietic stem cell niche. Nature. 2003;425:841–6. doi: 10.1038/nature02040. [DOI] [PubMed] [Google Scholar]
- 185.Mahmud N, Devine SM, Weller KP, Parmar S, Sturgeon C, Nelson MC, et al. The relative quiescence of hematopoietic stem cells in nonhuman primates. Blood. 2001;97:3061–8. doi: 10.1182/blood.V97.10.3061. [DOI] [PubMed] [Google Scholar]
- 186.Orford KW, Scadden DT. Deconstructing stem cell self-renewal: genetic insights into cell-cycle regulation. Nat Rev Genet. 2008;9:115–28. doi: 10.1038/nrg2269. [DOI] [PubMed] [Google Scholar]
- 187.Cheshier SH, Morrison SJ, Liao X, Weissman IL. In vivo proliferation and cell cycle kinetics of long-term self-renewing hematopoietic stem cells. Proc Natl Acad Sci U S A. 1999;96:3120–5. doi: 10.1073/pnas.96.6.3120. [DOI] [PMC free article] [PubMed] [Google Scholar]
- 188.Phillips RL, Reinhart AJ, Van Zant G. Genetic control of murine hematopoietic stem cell pool sizes and cycling kinetics. Proc Natl Acad Sci U S A. 1992;89:11607–11. doi: 10.1073/pnas.89.23.11607. [DOI] [PMC free article] [PubMed] [Google Scholar]
- 189.de Haan G, Nijhof W, Van Zant G. Mouse strain-dependent changes in frequency and proliferation of hematopoietic stem cells during aging: correlation between lifespan and cycling activity. Blood. 1997;89:1543–50. [PubMed] [Google Scholar]
- 190.Cheng T, Rodrigues N, Shen H, Yang Y, Dombkowski D, Sykes M, et al. Hematopoietic stem cell quiescence maintained by p21cip1/waf1. Science. 2000;287:1804–8. doi: 10.1126/science.287.5459.1804. [DOI] [PubMed] [Google Scholar]
- 191.Haneline LS, White H, Yang FC, Chen S, Orschell C, Kapur R, et al. Genetic reduction of class IA PI-3 kinase activity alters fetal hematopoiesis and competitive repopulating ability of hematopoietic stem cells in vivo. Blood. 2006;107:1375–82. doi: 10.1182/blood-2005-05-1985. [DOI] [PMC free article] [PubMed] [Google Scholar]
- 192.Yilmaz OH, Valdez R, Theisen BK, Guo W, Ferguson DO, Wu H, et al. Pten dependence distinguishes haematopoietic stem cells from leukaemia-initiating cells. Nature. 2006;441:475–82. doi: 10.1038/nature04703. [DOI] [PubMed] [Google Scholar]
- 193.Zhang J, Grindley JC, Yin T, Jayasinghe S, He XC, Ross JT, et al. PTEN maintains haematopoietic stem cells and acts in lineage choice and leukaemia prevention. Nature. 2006;441:518–22. doi: 10.1038/nature04747. [DOI] [PubMed] [Google Scholar]
- 194.Kharas MG, Okabe R, Ganis JJ, Gozo M, Khandan T, Paktinat M, et al. Constitutively active AKT depletes hematopoietic stem cells and induces leukemia in mice. Blood. 2010;115:1406–15. doi: 10.1182/blood-2009-06-229443. [DOI] [PMC free article] [PubMed] [Google Scholar]
- 195.Gan B, Sahin E, Jiang S, Sanchez-Aguilera A, Scott KL, Chin L, et al. mTORC1-dependent and -independent regulation of stem cell renewal, differentiation, and mobilization. Proc Natl Acad Sci U S A. 2008;105:19384–9. doi: 10.1073/pnas.0810584105. [DOI] [PMC free article] [PubMed] [Google Scholar]
- 196.Chen C, Liu Y, Liu Y, Zheng P. mTOR regulation and therapeutic rejuvenation of aging hematopoietic stem cells. Sci Signal. 2009;2:ra75. doi: 10.1126/scisignal.2000559. [DOI] [PMC free article] [PubMed] [Google Scholar]
- 197.Chen C, Liu Y, Liu R, Ikenoue T, Guan KL, Liu Y, et al. TSC-mTOR maintains quiescence and function of hematopoietic stem cells by repressing mitochondrial biogenesis and reactive oxygen species. J Exp Med. 2008;205:2397–408. doi: 10.1084/jem.20081297. [DOI] [PMC free article] [PubMed] [Google Scholar]
- 198.Ceradini DJ, Kulkarni AR, Callaghan MJ, Tepper OM, Bastidas N, Kleinman ME, et al. Progenitor cell trafficking is regulated by hypoxic gradients through HIF-1 induction of SDF-1. Nat Med. 2004;10:858–64. doi: 10.1038/nm1075. [DOI] [PubMed] [Google Scholar]
- 199.Parmar K, Mauch P, Vergilio JA, Sackstein R, Down JD. Distribution of hematopoietic stem cells in the bone marrow according to regional hypoxia. Proc Natl Acad Sci U S A. 2007;104:5431–6. doi: 10.1073/pnas.0701152104. [DOI] [PMC free article] [PubMed] [Google Scholar]
- 200.Naka K, Hirao A. Maintenance of genomic integrity in hematopoietic stem cells. Int J Hematol. 2011;93:434–9. doi: 10.1007/s12185-011-0793-z. [DOI] [PubMed] [Google Scholar]
- 201.Jang YY, Sharkis SJ. A low level of reactive oxygen species selects for primitive hematopoietic stem cells that may reside in the low-oxygenic niche. Blood. 2007;110:3056–63. doi: 10.1182/blood-2007-05-087759. [DOI] [PMC free article] [PubMed] [Google Scholar]
- 202.Nakada D, Saunders TL, Morrison SJ. Lkb1 regulates cell cycle and energy metabolism in haematopoietic stem cells. Nature. 2010;468:653–8. doi: 10.1038/nature09571. [DOI] [PMC free article] [PubMed] [Google Scholar]
- 203.Gurumurthy S, Xie SZ, Alagesan B, Kim J, Yusuf RZ, Saez B, et al. The Lkb1 metabolic sensor maintains haematopoietic stem cell survival. Nature. 2010;468:659–63. doi: 10.1038/nature09572. [DOI] [PMC free article] [PubMed] [Google Scholar]
- 204.Gan B, Hu J, Jiang S, Liu Y, Sahin E, Zhuang L, et al. Lkb1 regulates quiescence and metabolic homeostasis of haematopoietic stem cells. Nature. 2010;468:701–4. doi: 10.1038/nature09595. [DOI] [PMC free article] [PubMed] [Google Scholar]
- 205.Takubo K, Goda N, Yamada W, Iriuchishima H, Ikeda E, Kubota Y, et al. Regulation of the HIF-1alpha level is essential for hematopoietic stem cells. Cell Stem Cell. 2010;7:391–402. doi: 10.1016/j.stem.2010.06.020. [DOI] [PubMed] [Google Scholar]
- 206.Kim M, Cooper DD, Hayes SF, Spangrude GJ. Rhodamine-123 staining in hematopoietic stem cells of young mice indicates mitochondrial activation rather than dye efflux. Blood. 1998;91:4106–17. [PubMed] [Google Scholar]
- 207.Siggins RW, Zhang P, Welsh D, Lecapitaine NJ, Nelson S. Stem cells, phenotypic inversion, and differentiation. Int J Clin Exp Med. 2008;1:2–21. [PMC free article] [PubMed] [Google Scholar]
- 208.Ivanova NB, Dimos JT, Schaniel C, Hackney JA, Moore KA, Lemischka IR. A stem cell molecular signature. Science. 2002;298:601–4. doi: 10.1126/science.1073823. [DOI] [PubMed] [Google Scholar]
- 209.Chen C, Liu Y, Liu Y, Zheng P. The axis of mTOR-mitochondria-ROS and stemness of the hematopoietic stem cells. Cell Cycle. 2009;8:1158–60. doi: 10.4161/cc.8.8.8139. [DOI] [PubMed] [Google Scholar]
- 210.Schieke SM, Phillips D, McCoy JP, Jr., Aponte AM, Shen RF, Balaban RS, et al. The mammalian target of rapamycin (mTOR) pathway regulates mitochondrial oxygen consumption and oxidative capacity. J Biol Chem. 2006;281:27643–52. doi: 10.1074/jbc.M603536200. [DOI] [PubMed] [Google Scholar]
- 211.Ferber EC, Peck B, Delpuech O, Bell GP, East P, Schulze A. FOXO3a regulates reactive oxygen metabolism by inhibiting mitochondrial gene expression. Cell Death Differ. 2011 doi: 10.1038/cdd.2011.179. In press. [DOI] [PMC free article] [PubMed] [Google Scholar]
- 212.Yamazaki S, Iwama A, Takayanagi S, Morita Y, Eto K, Ema H, et al. Cytokine signals modulated via lipid rafts mimic niche signals and induce hibernation in hematopoietic stem cells. EMBO J. 2006;25:3515–23. doi: 10.1038/sj.emboj.7601236. [DOI] [PMC free article] [PubMed] [Google Scholar]
- 213.Tothova Z, Kollipara R, Huntly BJ, Lee BH, Castrillon DH, Cullen DE, et al. FoxOs are critical mediators of hematopoietic stem cell resistance to physiologic oxidative stress. Cell. 2007;128:325–39. doi: 10.1016/j.cell.2007.01.003. [DOI] [PubMed] [Google Scholar]
- 214.Mortensen M, Soilleux EJ, Djordjevic G, Tripp R, Lutteropp M, Sadighi-Akha E, et al. The autophagy protein Atg7 is essential for hematopoietic stem cell maintenance. J Exp Med. 2011;208:455–67. doi: 10.1084/jem.20101145. [DOI] [PMC free article] [PubMed] [Google Scholar]
- 215.Martin P. Wound healing--aiming for perfect skin regeneration. Science. 1997;276:75–81. doi: 10.1126/science.276.5309.75. [DOI] [PubMed] [Google Scholar]
- 216.Pollina EA, Legesse-Miller A, Haley EM, Goodpaster T, Randolph-Habecker J, Coller HA. Regulating the angiogenic balance in tissues. Cell Cycle. 2008;7:2056–70. doi: 10.4161/cc.7.13.6240. [DOI] [PMC free article] [PubMed] [Google Scholar]
- 217.Iyer VR, Eisen MB, Ross DT, Schuler G, Moore T, Lee JC, et al. The transcriptional program in the response of human fibroblasts to serum. Science. 1999;283:83–7. doi: 10.1126/science.283.5398.83. [DOI] [PubMed] [Google Scholar]
- 218.Desmoulière A, Chaponnier C, Gabbiani G. Tissue repair, contraction, and the myofibroblast. Wound Repair Regen. 2005;13:7–12. doi: 10.1111/j.1067-1927.2005.130102.x. [DOI] [PubMed] [Google Scholar]
- 219.Köse O, Waseem A. Keloids and hypertrophic scars: are they two different sides of the same coin? Dermatol Surg. 2008;34:336–46. doi: 10.1111/j.1524-4725.2007.34067.x. [DOI] [PubMed] [Google Scholar]
- 220.Lemons JM, Feng XJ, Bennett BD, Legesse-Miller A, Johnson EL, Raitman I, et al. Quiescent fibroblasts exhibit high metabolic activity. PLoS Biol. 2010;8:e1000514. doi: 10.1371/journal.pbio.1000514. [DOI] [PMC free article] [PubMed] [Google Scholar]
- 221.Agrawal D, Hauser P, McPherson F, Dong F, Garcia A, Pledger WJ. Repression of p27kip1 synthesis by platelet-derived growth factor in BALB/c 3T3 cells. Mol Cell Biol. 1996;16:4327–36. doi: 10.1128/mcb.16.8.4327. [DOI] [PMC free article] [PubMed] [Google Scholar]
- 222.Rivard N, L’Allemain G, Bartek J, Pouysségur J. Abrogation of p27Kip1 by cDNA antisense suppresses quiescence (G0 state) in fibroblasts. J Biol Chem. 1996;271:18337–41. doi: 10.1074/jbc.271.31.18337. [DOI] [PubMed] [Google Scholar]
- 223.Liu H, Adler AS, Segal E, Chang HY. A transcriptional program mediating entry into cellular quiescence. PLoS Genet. 2007;3:e91. doi: 10.1371/journal.pgen.0030091. [DOI] [PMC free article] [PubMed] [Google Scholar]
- 224.Kovacevic Z, McGivan JD. Mitochondrial metabolism of glutamine and glutamate and its physiological significance. Physiol Rev. 1983;63:547–605. doi: 10.1152/physrev.1983.63.2.547. [DOI] [PubMed] [Google Scholar]
- 225.Zielke HR, Zielke CL, Ozand PT. Glutamine: a major energy source for cultured mammalian cells. Fed Proc. 1984;43:121–5. [PubMed] [Google Scholar]
- 226.Reitzer LJ, Wice BM, Kennell D. Evidence that glutamine, not sugar, is the major energy source for cultured HeLa cells. J Biol Chem. 1979;254:2669–76. [PubMed] [Google Scholar]
- 227.Demidenko ZN, Blagosklonny MV. Growth stimulation leads to cellular senescence when the cell cycle is blocked. Cell Cycle. 2008;7:3355–61. doi: 10.4161/cc.7.21.6919. [DOI] [PubMed] [Google Scholar]
- 228.Vousden KH. Outcomes of p53 activation--spoilt for choice. J Cell Sci. 2006;119:5015–20. doi: 10.1242/jcs.03293. [DOI] [PubMed] [Google Scholar]
- 229.Itahana K, Dimri G, Campisi J. Regulation of cellular senescence by p53. Eur J Biochem. 2001;268:2784–91. doi: 10.1046/j.1432-1327.2001.02228.x. [DOI] [PubMed] [Google Scholar]
- 230.Brown CJ, Lain S, Verma CS, Fersht AR, Lane DP. Awakening guardian angels: drugging the p53 pathway. Nat Rev Cancer. 2009;9:862–73. doi: 10.1038/nrc2763. [DOI] [PubMed] [Google Scholar]
- 231.Vassilev LT, Vu BT, Graves B, Carvajal D, Podlaski F, Filipovic Z, et al. In vivo activation of the p53 pathway by small-molecule antagonists of MDM2. Science. 2004;303:844–8. doi: 10.1126/science.1092472. [DOI] [PubMed] [Google Scholar]
- 232.Vassilev LT. Small-molecule antagonists of p53-MDM2 binding: research tools and potential therapeutics. Cell Cycle. 2004;3:419–21. doi: 10.4161/cc.3.4.801. [DOI] [PubMed] [Google Scholar]
- 233.Korotchkina LG, Leontieva OV, Bukreeva EI, Demidenko ZN, Gudkov AV, Blagosklonny MV. The choice between p53-induced senescence and quiescence is determined in part by the mTOR pathway. Aging (Albany NY) 2010;2:344–52. doi: 10.18632/aging.100160. [DOI] [PMC free article] [PubMed] [Google Scholar]
- 234.Korotchkina LG, Demidenko ZN, Gudkov AV, Blagosklonny MV. Cellular quiescence caused by the Mdm2 inhibitor nutlin-3A. Cell Cycle. 2009;8:3777–81. doi: 10.4161/cc.8.22.10121. [DOI] [PubMed] [Google Scholar]
- 235.Soucek T, Pusch O, Wienecke R, DeClue JE, Hengstschläger M. Role of the tuberous sclerosis gene-2 product in cell cycle control. Loss of the tuberous sclerosis gene-2 induces quiescent cells to enter S phase. J Biol Chem. 1997;272:29301–8. doi: 10.1074/jbc.272.46.29301. [DOI] [PubMed] [Google Scholar]
- 236.Soucek T, Yeung RS, Hengstschläger M. Inactivation of the cyclin-dependent kinase inhibitor p27 upon loss of the tuberous sclerosis complex gene-2. Proc Natl Acad Sci U S A. 1998;95:15653–8. doi: 10.1073/pnas.95.26.15653. [DOI] [PMC free article] [PubMed] [Google Scholar]
- 237.Meng S, Tripathy D, Frenkel EP, Shete S, Naftalis EZ, Huth JF, et al. Circulating tumor cells in patients with breast cancer dormancy. Clin Cancer Res. 2004;10:8152–62. doi: 10.1158/1078-0432.CCR-04-1110. [DOI] [PubMed] [Google Scholar]
- 238.Lindemann F, Schlimok G, Dirschedl P, Witte J, Riethmüller G. Prognostic significance of micrometastatic tumour cells in bone marrow of colorectal cancer patients. Lancet. 1992;340:685–9. doi: 10.1016/0140-6736(92)92230-D. [DOI] [PubMed] [Google Scholar]
- 239.Izbicki JR, Hosch SB, Pichlmeier U, Rehders A, Busch C, Niendorf A, et al. Prognostic value of immunohistochemically identifiable tumor cells in lymph nodes of patients with completely resected esophageal cancer. N Engl J Med. 1997;337:1188–94. doi: 10.1056/NEJM199710233371702. [DOI] [PubMed] [Google Scholar]
- 240.Aguirre-Ghiso JA. Models, mechanisms and clinical evidence for cancer dormancy. Nat Rev Cancer. 2007;7:834–46. doi: 10.1038/nrc2256. [DOI] [PMC free article] [PubMed] [Google Scholar]
- 241.Zippelius A, Pantel K. RT-PCR-based detection of occult disseminated tumor cells in peripheral blood and bone marrow of patients with solid tumors. An overview. Ann N Y Acad Sci. 2000;906:110–23. doi: 10.1111/j.1749-6632.2000.tb06600.x. [DOI] [PubMed] [Google Scholar]
- 242.Hüsemann Y, Geigl JB, Schubert F, Musiani P, Meyer M, Burghart E, et al. Systemic spread is an early step in breast cancer. Cancer Cell. 2008;13:58–68. doi: 10.1016/j.ccr.2007.12.003. [DOI] [PubMed] [Google Scholar]
- 243.Cutuli B, Cohen-Solal-Le Nir C, De Lafontan B, Mignotte H, Fichet V, Fay R, et al. Ductal carcinoma in situ of the breast results of conservative and radical treatments in 716 patients. Eur J Cancer. 2001;37:2365–72. doi: 10.1016/S0959-8049(01)00303-3. [DOI] [PubMed] [Google Scholar]
- 244.Schardt JA, Meyer M, Hartmann CH, Schubert F, Schmidt-Kittler O, Fuhrmann C, et al. Genomic analysis of single cytokeratin-positive cells from bone marrow reveals early mutational events in breast cancer. Cancer Cell. 2005;8:227–39. doi: 10.1016/j.ccr.2005.08.003. [DOI] [PubMed] [Google Scholar]
- 245.Aguirre-Ghiso JA, Liu D, Mignatti A, Kovalski K, Ossowski L. Urokinase receptor and fibronectin regulate the ERK(MAPK) to p38(MAPK) activity ratios that determine carcinoma cell proliferation or dormancy in vivo. Mol Biol Cell. 2001;12:863–79. doi: 10.1091/mbc.12.4.863. [DOI] [PMC free article] [PubMed] [Google Scholar]
- 246.Ossowski L, Reich E. Changes in malignant phenotype of a human carcinoma conditioned by growth environment. Cell. 1983;33:323–33. doi: 10.1016/0092-8674(83)90414-2. [DOI] [PubMed] [Google Scholar]
- 247.Aguirre-Ghiso JA, Ossowski L, Rosenbaum SK. Green fluorescent protein tagging of extracellular signal-regulated kinase and p38 pathways reveals novel dynamics of pathway activation during primary and metastatic growth. Cancer Res. 2004;64:7336–45. doi: 10.1158/0008-5472.CAN-04-0113. [DOI] [PubMed] [Google Scholar]
- 248.Schewe DM, Aguirre-Ghiso JA. ATF6alpha-Rheb-mTOR signaling promotes survival of dormant tumor cells in vivo. Proc Natl Acad Sci U S A. 2008;105:10519–24. doi: 10.1073/pnas.0800939105. [DOI] [PMC free article] [PubMed] [Google Scholar]
- 249.Dey-Guha I, Wolfer A, Yeh AC, G Albeck J, Darp R, Leon E, et al. Asymmetric cancer cell division regulated by AKT. Proc Natl Acad Sci U S A. 2011;108:12845–50. doi: 10.1073/pnas.1109632108. [DOI] [PMC free article] [PubMed] [Google Scholar]
- 250.Sang L, Coller HA, Roberts JM. Control of the reversibility of cellular quiescence by the transcriptional repressor HES1. Science. 2008;321:1095–100. doi: 10.1126/science.1155998. [DOI] [PMC free article] [PubMed] [Google Scholar]
- 251.Pantic I. Cancer stem cell hypotheses: impact on modern molecular physiology and pharmacology research. J Biosci. 2011;36:957–61. doi: 10.1007/s12038-011-9155-5. [DOI] [PubMed] [Google Scholar]
- 252.Cufí S, Vazquez-Martin A, Oliveras-Ferraros C, Martin-Castillo B, Vellon L, Menendez JA. Autophagy positively regulates the CD44(+) CD24(-/low) breast cancer stem-like phenotype. Cell Cycle. 2011;10:3871–85. doi: 10.4161/cc.10.22.17976. [DOI] [PubMed] [Google Scholar]
- 253.Miller TW, Rexer BN, Garrett JT, Arteaga CL. Mutations in the phosphatidylinositol 3-kinase pathway: role in tumor progression and therapeutic implications in breast cancer. Breast Cancer Res. 2011;13:224. doi: 10.1186/bcr3039. [DOI] [PMC free article] [PubMed] [Google Scholar]
- 254.Isakoff SJ, Engelman JA, Irie HY, Luo J, Brachmann SM, Pearline RV, et al. Breast cancer-associated PIK3CA mutations are oncogenic in mammary epithelial cells. Cancer Res. 2005;65:10992–1000. doi: 10.1158/0008-5472.CAN-05-2612. [DOI] [PubMed] [Google Scholar]
- 255.Degenhardt K, Mathew R, Beaudoin B, Bray K, Anderson D, Chen G, et al. Autophagy promotes tumor cell survival and restricts necrosis, inflammation, and tumorigenesis. Cancer Cell. 2006;10:51–64. doi: 10.1016/j.ccr.2006.06.001. [DOI] [PMC free article] [PubMed] [Google Scholar]
- 256.Yang S, Wang X, Contino G, Liesa M, Sahin E, Ying H, et al. Pancreatic cancers require autophagy for tumor growth. Genes Dev. 2011;25:717–29. doi: 10.1101/gad.2016111. [DOI] [PMC free article] [PubMed] [Google Scholar]
- 257.Guo JY, Chen HY, Mathew R, Fan J, Strohecker AM, Karsli-Uzunbas G, et al. Activated Ras requires autophagy to maintain oxidative metabolism and tumorigenesis. Genes Dev. 2011;25:460–70. doi: 10.1101/gad.2016311. [DOI] [PMC free article] [PubMed] [Google Scholar]
- 258.Maclean KH, Dorsey FC, Cleveland JL, Kastan MB. Targeting lysosomal degradation induces p53-dependent cell death and prevents cancer in mouse models of lymphomagenesis. J Clin Invest. 2008;118:79–88. doi: 10.1172/JCI33700. [DOI] [PMC free article] [PubMed] [Google Scholar]
- 259.Wei H, Wei S, Gan B, Peng X, Zou W, Guan JL. Suppression of autophagy by FIP200 deletion inhibits mammary tumorigenesis. Genes Dev. 2011;25:1510–27. doi: 10.1101/gad.2051011. [DOI] [PMC free article] [PubMed] [Google Scholar]
- 260.Janku F, McConkey DJ, Hong DS, Kurzrock R. Autophagy as a target for anticancer therapy. Nat Rev Clin Oncol. 2011;8:528–39. doi: 10.1038/nrclinonc.2011.71. [DOI] [PubMed] [Google Scholar]
- 261.Amaravadi RK, Lippincott-Schwartz J, Yin XM, Weiss WA, Takebe N, Timmer W, et al. Principles and current strategies for targeting autophagy for cancer treatment. Clin Cancer Res. 2011;17:654–66. doi: 10.1158/1078-0432.CCR-10-2634. [DOI] [PMC free article] [PubMed] [Google Scholar]
- 262.White E, DiPaola RS. The double-edged sword of autophagy modulation in cancer. Clin Cancer Res. 2009;15:5308–16. doi: 10.1158/1078-0432.CCR-07-5023. [DOI] [PMC free article] [PubMed] [Google Scholar]
- 263.Cheng Y, Li H, Ren X, Niu T, Hait WN, Yang J. Cytoprotective effect of the elongation factor-2 kinase-mediated autophagy in breast cancer cells subjected to growth factor inhibition. PLoS One. 2010;5:e9715. doi: 10.1371/journal.pone.0009715. [DOI] [PMC free article] [PubMed] [Google Scholar]
- 264.Abarientos C, Sperber K, Shapiro DL, Aronow WS, Chao CP, Ash JY. Hydroxychloroquine in systemic lupus erythematosus and rheumatoid arthritis and its safety in pregnancy. Expert Opin Drug Saf. 2011;10:705–14. doi: 10.1517/14740338.2011.566555. [DOI] [PubMed] [Google Scholar]
- 265.Ohsumi Y. Molecular mechanism of autophagy in yeast, Saccharomyces cerevisiae. Philos Trans R Soc Lond B Biol Sci. 1999;354:1577–80, discussion 1580-1. doi: 10.1098/rstb.1999.0501. [DOI] [PMC free article] [PubMed] [Google Scholar]
- 266.Kimura KD, Tissenbaum HA, Liu Y, Ruvkun G. daf-2, an insulin receptor-like gene that regulates longevity and diapause in Caenorhabditis elegans. Science. 1997;277:942–6. doi: 10.1126/science.277.5328.942. [DOI] [PubMed] [Google Scholar]
- 267.Wei M, Fabrizio P, Madia F, Hu J, Ge H, Li LM, et al. Tor1/Sch9-regulated carbon source substitution is as effective as calorie restriction in life span extension. PLoS Genet. 2009;5:e1000467. doi: 10.1371/journal.pgen.1000467. [DOI] [PMC free article] [PubMed] [Google Scholar]
- 268.Jacobs SR, Herman CE, Maciver NJ, Wofford JA, Wieman HL, Hammen JJ, et al. Glucose uptake is limiting in T cell activation and requires CD28-mediated Akt-dependent and independent pathways. J Immunol. 2008;180:4476–86. doi: 10.4049/jimmunol.180.7.4476. [DOI] [PMC free article] [PubMed] [Google Scholar]
- 269.Tarazona AM, Rodríguez JI, Restrepo LF, Olivera-Angel M. Mitochondrial activity, distribution and segregation in bovine oocytes and in embryos produced in vitro. Reprod Domest Anim. 2006;41:5–11. doi: 10.1111/j.1439-0531.2006.00615.x. [DOI] [PubMed] [Google Scholar]
- 270.Bavister BD, Squirrell JM. Mitochondrial distribution and function in oocytes and early embryos. Hum Reprod. 2000;15(Suppl 2):189–98. doi: 10.1093/humrep/15.suppl_2.189. [DOI] [PubMed] [Google Scholar]
- 271.Hengge-Aronis R, Klein W, Lange R, Rimmele M, Boos W. Trehalose synthesis genes are controlled by the putative sigma factor encoded by rpoS and are involved in stationary-phase thermotolerance in Escherichia coli. J Bacteriol. 1991;173:7918–24. doi: 10.1128/jb.173.24.7918-7924.1991. [DOI] [PMC free article] [PubMed] [Google Scholar]
- 272.Elbein AD, Pan YT, Pastuszak I, Carroll D. New insights on trehalose: a multifunctional molecule. Glycobiology. 2003;13:17R–27R. doi: 10.1093/glycob/cwg047. [DOI] [PubMed] [Google Scholar]
- 273.Frauwirth KA, Riley JL, Harris MH, Parry RV, Rathmell JC, Plas DR, et al. The CD28 signaling pathway regulates glucose metabolism. Immunity. 2002;16:769–77. doi: 10.1016/S1074-7613(02)00323-0. [DOI] [PubMed] [Google Scholar]
- 274.Rusten TE, Lindmo K, Juhász G, Sass M, Seglen PO, Brech A, et al. Programmed autophagy in the Drosophila fat body is induced by ecdysone through regulation of the PI3K pathway. Dev Cell. 2004;7:179–92. doi: 10.1016/j.devcel.2004.07.005. [DOI] [PubMed] [Google Scholar]
- 275.Scott RC, Schuldiner O, Neufeld TP. Role and regulation of starvation-induced autophagy in the Drosophila fat body. Dev Cell. 2004;7:167–78. doi: 10.1016/j.devcel.2004.07.009. [DOI] [PubMed] [Google Scholar]
- 276.Kurath G, Morita RY. Starvation-survival physiological studies of a marine Pseudomonas sp. Appl Environ Microbiol. 1983;45:1206–11. doi: 10.1128/aem.45.4.1206-1211.1983. [DOI] [PMC free article] [PubMed] [Google Scholar]
- 277.Kolter R, Siegele DA, Tormo A. The stationary phase of the bacterial life cycle. Annu Rev Microbiol. 1993;47:855–74. doi: 10.1146/annurev.mi.47.100193.004231. [DOI] [PubMed] [Google Scholar]
- 278.Baker DJ, Wijshake T, Tchkonia T, LeBrasseur NK, Childs BG, van de Sluis B, et al. Clearance of p16Ink4a-positive senescent cells delays ageing-associated disorders. Nature. 2011;479:232–6. doi: 10.1038/nature10600. [DOI] [PMC free article] [PubMed] [Google Scholar]