Abstract
Impairment of mitochondria function and cellular antioxidant systems are linked to aging and neurodegenerative diseases. In the eye, the retinal pigment epithelium (RPE) is exposed to a highly oxidative environment that contributes to age-related visual dysfunction. Here, we examined changes in mitochondrial function in human RPE cells and sensitivity to oxidative stress with increased chronological age. Primary RPE cells from young (9–20)-, mid-age (48–60)-, and >60 (62–76)-year-old donors were grown to confluency and examined by electron microscopy and flow cytometry using several mitochondrial functional assessment tools. Susceptibility of RPE cells to H2O2 toxicity was determined by lactate dehydrogenase and cytochrome c release, as well as propidium iodide staining. Reactive oxygen species, cytoplasmic Ca2+ [Ca2+]c, and mitochondrial Ca2+ [Ca2+]m levels were measured using 2′,7′-dichlorodihydrofluorescein diacetate, fluo-3/AM, and Rhod-2/AM, respectively, adenosine triphosphate (ATP) levels were measured by a luciferin/luciferase-based assay and mitochondrial membrane potential (ΔΨm) estimated using 5,5′,6,6′-tetrachloro 1,1′3,3′-tetraethylbenzimid azolocarbocyanine iodide. Expression of mitochondrial and antioxidant genes was determined by real-time polymerase chain reaction. RPE cells show greater sensitivity to oxidative stress, reduction in expression of mitochondrial heat shock protein 70, uncoupling protein 2, and superoxide dismutase 3, and greater expression of superoxide dismutase 2 levels with increased chronological age. Changes in mitochondrial number, size, shape, matrix density, cristae architecture, and membrane integrity were more prominent in samples obtained from >60 years old compared to mid-age and younger donors. These mitochondria abnormalities correlated with lower ATP levels, reduced ΔΨm, decreased [Ca2+]c, and increased sequestration of [Ca2+]m in cells with advanced aging. Our study provides evidence for mitochondrial decay, bioenergetic deficiency, weakened antioxidant defenses, and increased sensitivity of RPE cells to oxidative stress with advanced aging. Our findings suggest that with increased severity of mitochondrial decay and oxidative stress, RPE function may be altered in some individuals in a way that makes the retina more susceptible to age-related injury.
Keywords: RPE cells, Aging, Mitochondria, Oxidative Stress, Mitochondrial membrane potential, ATP, Ca2+
Introduction
It is often argued that the metabolic rate of an organism determines its life span [1–3] and that neurodegenerative diseases associated with advanced aging have a common root in mitochondrial dysfunction. This concept is intellectually appealing since mitochondria are key regulators of the cell’s metabolic rate. They produce most of the cells adenosine triphosphate (ATP), generate the bulk of reactive oxygen species (ROS) [4–6], and play an important role in the organism’s antioxidant defense systems [7–10]. They propagate in response to the cells energy requirements. When energy needs are high, they will grow and divide. When energy requirements are low, they are selected for mitophagy or become inactive. Mitochondria vary in number from cell to cell, are highly prone to oxidative damage, lack efficient mtDNA repair mechanisms, and can accrue mutations and go unnoticed [11–13]. Abnormal accumulation of defective mitochondria in cells can trigger activation of senescence or apoptosis [14–17].
There is compelling evidence that mitochondrial dysfunction is an early event in Alzheimer’s and Parkinson’s disease supporting claims that age-related mitochondrial dysfunction is an upstream event in many neurodegenerative disorders [18–21]. This is underscored in studies showing that amyloid precursor protein transgenic mice have decreased mitochondrial membrane potential, lowered ATP-levels and higher ROS levels, altered Bcl-xL/Bax ratio, reduced COX IV activity, and an overall decrease in mitochondrial respiratory function at a stage when there is no detectable level of amyloid-beta deposits in the brain [22]. In Parkinson’s disease, mitochondrial impairment is a prelude to dopaminergic cell death [23–25].
Mitochondrial decay is evident during normal aging of tissues as well and causes the cell’s anti-stress pathways to operate with less efficiency [26–28]. Specifically, alterations in cytoplasmic Cu/Zn- superoxide dismutase (SOD), lipid peroxidation, mitochondrial Mn-SOD, and oxidative stress markers have been observed [27, 28]. Knockdown of the mitochondrial heat shock protein 70 promotes progeria-like phenotypes in Caenorhabditis elegans implying a direct link between mitochondrial function and aging [29]. These observations reinforce the concept that deficiencies in the cell’s bioenergetic machinery are intricately intertwined with the process of aging, a “progressive, generalized impairment of function, resulting in an increased vulnerability to environmental challenge and a growing risk of disease and death” [30].
It is therefore conceivable that mitochondrial dysfunction is a major underlying cause in the progression of age-related retinal diseases such as age-related macular degeneration (AMD), a multifactorial disorder with etiology stemming, in part, from cumulative oxidative damage to the retinal pigment epithelium (RPE) [31–37]. Histological changes in mitochondrial morphology are evident in the RPE at the earliest stages of AMD and precede vision loss, even though the disease has been primarily associated with photoreceptor damage [38–42].
The RPE, which comprises a highly metabolically active monolayer of cuboidal cells, is crucial to the health and function of the retina. Juxtaposed between the photoreceptors apically and the choroiocapillaris basally, this epithelium is continuously bombarded by high levels of oxidants [43, 44]. Among its numerous function, it constitutes the blood retinal barrier, facilitates selective transport between the choroidal vasculature and the outer retina, phagocytoses and degrades shed photoreceptor outer segments, regenerates photopigments, secretes neurotrophic, adhesion, and vascular regulatory factors, and contributes to the functional integrity of Bruch’s membrane and the choriocapillaris. Disruption in any of these high-energy requiring processes is detrimental to the health of the RPE and retina.
The evidence points to a clear association between RPE health and compromised mitochondrial function. Abnormal regulation of several mitochondrial proteins is noted in AMD retinas including ATP synthase, cytochome C oxidase, and mitochondrial heat shock protein 70 (mtHsp70) [45]. What is more, experimental findings support a link between mitochondrial impairment and RPE degeneration. Case in point, abnormal mitochondrial features are observed in RPE cells treated with Dl-buthionine-(S,R)-sulfoximine, an agent that promotes degeneration of the cells by reducing cellular glutathione levels [46]. When given rod outer segments, preferential damage in seen in mtDNA but not nuclear DNA of RPE [47, 48] and aging promotes mtDNA damage and faulty DNA repair in both epithelium and choroid of rats [49]. In addition, A2E, the major lipofuscin component and byproduct of the visual cycle, can disrupt mitochondrial function and induce degeneration of cultured RPE cells at concentrations found in the aging human eye [50]. Lipofuscin accumulation is believed to be a major risk factor for AMD.
Given the daily challenges, the RPE faces and its exposure to an onslaught of oxidants in the retina, we asked when in human chronological aging are RPE cells most susceptible to oxidative stress and how does mitochondrial health alter the cells coping mechanisms in a high-stressed environment. We provide ultrastructure, biochemical, and gene expression evidence for mitochondrial decay, attenuation of antioxidant systems, and increased sensitivity of RPE cells to increased oxidative stress as early as age 60 in human aging.
Materials and methods
Materials
Tissue culture reagents were obtained from Gibco BRL (Gaithersburg, MD, USA). Mouse monoclonal anti-RPE65 was purchased from Novus Biologicals (Littleton, CO, USA). 2′,7′-Dichlorodihydrofluorescein diacetate (H2-DCF-DA), 5,5′,6,6′-tetrachloro 1,1′3,3′-tetraethylbenzimidazolylcarbocyanine iodide (JC-1), and Mito Tracker Red from Molecular Probes (Eugene, OR, USA), and mouse anti-human cytochrome c from Promega (Madison, WI, USA). The luciferin/luciferase-based ATP, lactate dehydrogenase (LDH), and mitochondria isolation kit assay kits were obtained from Sigma (St. Louis, MO, USA), Roche Pharmaceuticals (Nutley, NJ, USA), and Pierce Chemical Co (Rockford, IL, USA), respectively.
Culture and characterization of primary human RPE cells
Cell culture
All human tissues used in this study was procured and managed in accordance with the Tenets of the Declaration of Helsinki and with approval from the Institution Review Board from the Sun Yat-sen University at Guangzhou. We obtained informed written consent from all participants involved in our study. Informed written consent was also received from the parents/guardians of all minor-aged donors used in this research. Human RPE cells were isolated essentially as described by Dr. Janice M Burke [51] from donor samples obtained from either Dr. Burke’s lab at the University of Wisconsin or the Zhongshan Ophthalmic Center Eye Bank (Guanzhou) from consenting donors with no known history of ocular diseases. The samples were grouped into three categories: young (age 9–20; n = 7), mid-age (age 48–60; n = 7), and >60 (age 62–76; n = 7) years old. RPE cells were dissected from the central and peripheral regions of the eyes, harvested between 8 and 12 h of death and primary cultures established using identical conditions for each sample using Dulbecco’s modified Eagle’s medium (DMEM) supplemented with 10% fetal bovine serum (FBS). All experiments described below were carried out in triplicates for each donor sample at three passages—third to fifth—using the same number of RPE cells from 90% confluent monolayer cultures. Histograms generated represent average values of all samples at the three passages within a given group.
Characterization of RPE cultures
Purity of the cultures was determined using an RPE specific marker, RPE 65, a protein involved in the conversion of all-trans retinol to 11-cis retinal during phototransduction in the retina. Cells were grown on polylysine (10 μg/ml)-coated glass coverslips at a density of 1 × 10⁵ cells/well in 24-well plates for 48 h. Cell were fixed with 4% paraformaldehyde for 15 min, incubated with 5% bovine serum albumin containing 0.1% Triton X-100 for 30 min, immunolabeled with mouse monoclonal anti-RPE65 (1:250) at 4°C overnight, then goat anti-mouse Alexa Fluor 488-conjugated antibody (1:1,000) for 45 min. Normal mouse serum (1:1,000) was used instead of the RPE65 antibody in some experiments to serve as an antibody control. RPE-65 immunoreactivity was visualized by confocal microscopy.
Age-related sensitivity of RPE to oxidative stress
The age-related sensitivity of RPE cells to oxidative stress was assessed in all samples of the three age groups. Cells were exposed to various concentrations of hydrogen peroxide and LDH levels estimated in the conditioned medium. Suspensions of RPE cells was dispensed at 1 × 10⁵ cells/well in 100 μl serum-free DMEM (SFM) for 24 h. Cultures were then exposed to 0, 160, or 320 μM H2O2 for 2 h. This treatment was replaced by SF medium for an additional 24 h. Sensitivity of the RPE cells to H2O2 toxicity among the groups was then estimated using cell death and gene expression assays as described below. Cell death was estimated using LDH assay, propidium iodide (PI) staining, and cytochrome c release, and expression of oxidative stress and apoptotic genes estimated quantitatively by real-time polymerase chain reaction (PCR).
LDH assay
Fifty microliters of culture supernatant from the H2O2-treated samples and controls were incubated with an equal volume of LDH reaction mixture for 30 min. The reaction was terminated and the absorbance measured at 490 nm using a Benchmark Microplate Reader. Cell death, proportional to the LDH activity, was calculated as a percentage of the no-treatment controls. Triplicate measurements were taken for each donor sample at passages 3, 4, and 5; and the histograms generated represent the average values of all samples at the three passages within a given group.
PI staining
After H2O2 exposure, coverslips were washed with SFM, live cells stained with 4 μg/ml PI (diluted in PBS), and nuclear labeling of dead cells estimated by epifluorescence microscopy.
Cytochrome c release
Release of cytochrome c, a putative event of the mitochondria apoptotic pathway following loss of Δψm, was measured as described [52, 53]. After H2O2 treatment, the cells were washed in PBS, resuspended in 1 ml of mitochondrial medium containing 250 mM sucrose, 10 mM KCl, 20 mM HEPES-KOH, pH 7.5, 1 mM EGTA, 1 mM EDTA, 1.5 mM MgCl2, and 1% protease inhibitors mixture. The cells were permeabilized for 30 s by mild vortexing with 0.001% digitonin, followed by centrifugation for 3 min at 1,000×g. Pellets were resuspended in 4% paraformaldehyde for 20 min, washed, then incubated for 15 min in labeling medium containing 2% FBS, 0.2% sodium azide, and 0.5% Triton X-100 in PBS. The suspension was centrifuged at 3,000×g for 5 min, incubated for 1 h with 1 μg/ml mouse monoclonal anti-cytochrome c diluted in 200 μl of labeling medium followed by incubation for an additional hour in 5 μg/ml goat anti-mouse AlexaFluor 488-conjugated cytochrome c antibody diluted in 200 μl of labeling medium. Labeled cells were washed, resuspended in 200 μl PBS, and 10,000 cells/sample analyzed by flow cytometry. Analyses for individual RPE samples were carried out as described above and data expressed as the mean of the anti-cytochrome c fluorescence in RPE samples within a given age group. Fluorescent images of the labeled cells were also collected using confocal microscopy.
Expression of oxidative stress and apoptotic genes
Total mRNAs from confluent RPE cultures were isolated and real time-PCR performed at an annealing temperature of 58°C and 35 cycles for the following genes: mtHsp70, UCP2, ATPase-α, β, γ, superoxide dismutase 1 (SOD1), superoxide dismutase 2 (SOD2), superoxide dismutase 3 (SOD3), Bax, Bcl-2, COX1, and COX2. Primer sequences are listed in Table 1 and were synthesized by Invitrogen (Carlsbad, CA, USA). GAPDH was used as an internal RNA loading control and no reverse transcriptase reactions as negative controls to confirm that amplification was RNA dependent. For real-time PCR, the two-step amplifying protocol was used with iQ SYBR green supermix solution (BioRad). Both the melting curve and gel electrophoretic analyses were used to determine amplicon homogeneity and quality of the reaction.
Table 1.
The table lists the PCR primers, Genbank accession numbers, sequence, and amplicon sizes for various oxidative stress and apoptotic genes
| Gene name | Accession # | Forward | Reverse | Ampliconsize (b.p.) |
|---|---|---|---|---|
| mtHsp70 | NM_005345 | GCTGACCAAGATGAAGGAGA | CAGCCTGTTGTCAAAGTCCT | 343 |
| UCP2 | NM_003355 | CTACAAGACCATTGCACGAGAGG | AGCTGCTCATAGGTGACAAACAT | 373 |
| ATPase-α | NM_001001937 | GCTGTTGCTTACCGTCAGAT | GGTACCTGCTACCTGCTTCA | 345 |
| ATPase-β | NM_001686 | CTCTGTGTTTGCTGGTGTTG | CCCAATAATGCAGACACCTC | 279 |
| ATPase-γ | NM_001001973 | ACAGATGAAAAGCGAGGTTG | CGTCAGCATCAATATCGTCA | 338 |
| SOD1 | NM_000454 | CAATTTCGAGCAGAAGGAAA | TTCTTCATTTCCACCTTTGC | 346 |
| SOD2 | NM_000636 | TGGCTTGCAAAAAGTAAACC | ATCCCTACAAGTCCCCAAAG | 329 |
| SOD3 | NM_003102 | TCCATTTGTACCGAAACACC | GATGCGAAACAGCTGAAGAC | 287 |
| COX1 | NC_001807 | CTTCGTCTGATCCGTCCTAA | ATGGGAGATTATTCCGAAGC | 220 |
| COX2 | NC_001807 | AGTCCTGTATGCCCTTTTCC | TGAAGATTAGTCCGCCGTAG | 245 |
| Bcl-2 | NM_000633 | CAGGAAAGGCTCGAAATACA | CTGATCCAAACTTGGGAATG | 296 |
| Bax | NM_004324 | CGGAACTGATCAGAACCATC | GAGGTCAGCAGGGTAGATGA | 301 |
Morphological changes in RPE mitochondria with increased aging
Electron microscopy
RPE cells from all donor samples within the three age groups were processed identically for electron microscopy (EM) analysis. Cells were seeded onto fibronectin-coated Thermanox cover slips, cultured for 48 h in DMEM containing 2% FBS, and fixed in a solution containing 0.5% glutaraldehyde, 4% paraformaldehyde, and 85 mM cacodylate buffer. Specimens were post-fixed overnight in buffered osmium tetroxide (1%) and potassium ferrocyanide (1.5%), dehydrated in a graded series of ethanol, then infiltrated and embedded following standard EM procedures. Ultra thin sections (~800 Å) were mounted onto square 200 mesh copper grids, stained with uranyl acetate and lead citrate, and examined using a Philips 400 transmission electron microscope.
Mitochondrial morphology and morphometrics
Twenty individual RPE cell EM micrographs were randomly taken along different planes of cells from each donor sample. The images were captured on 8.3 × 10.2 cm films at an original magnification of 1,650. After each group of 20 micrographs, a carbon-grating replica was photographically recorded to accurately calibrate the magnification of the cells. Micrographs were enlarged to 16,200× to count the mitochondria in three perinuclear areas of 49 μm2 each in the cells. The counting template consisted of area 1, closest to the nucleus in the mitochondrial dense region. Areas 2 and 3 were located at a 45° angle to area 1 and at 10.5 μm from the nucleus. The mitochondria morphology was examined at 35,000×. Morphometric analysis was performed using the NIH Image J program by two observers. When discrepancies resulted, a third observer was used. Data is presented at the mean for each individual area/20 cells and the mean of all three areas/20 cells.
RPE cell morphology among the various age groups was also examined using phase-contrast and confocal microscopy and cell size estimated by flow cytometry. Cells from confluent RPE cultures were harvested and number of mitochondrial estimated after labeling with 50 nM of the mitochondrial markers, MitoTracker Red and Mitotracker Green for 30 min at 37°C. Flow cytometric using BD FACS (AriaTM, Becton Dickinson, Franklin Lakes, NJ, USA) analysis were carried out using 10,000 cells/sample and an excitation wavelength of 488 nm and emission of 590 nm. Results are expressed in arbitrary units as the mean fluorescence intensity of all samples within a group. Cells labeled similarly in culture were also analyzed by confocal microscopy to validate flow cytometry findings.
Age-related changes in mitochondrial function
ROS production
Cellular oxidative stress was determined by the amount of ROS in the RPE cytoplasm [54, 55] essentially as we have described [57]. Cells from confluent cultures were harvested by centrifugation and 2 × 10⁶ cells/ml from each age incubated at 37°C for 30 min with 0.4 μM of the ROS indicator, H2-DCF-DA, diluted in SFM. H2-DCF-DA penetrates cells and emits green fluorescence upon oxidation through reactions with H2O2. Excess H2-DCF-DA was removed from the samples and cells analyzed by flow cytometry using 488 nm excitation and 530 nm emission wavelengths. For each sample 10,000 cells were analyzed and data processed using the FCS Express software.
ATP levels
ATP levels were determined using a luciferin/luciferase-based assay as described [56]. Cells from confluent RPE cultures were harvested and 1 × 10⁵ cells from each sample in an age group seeded into wells of a 96-well plate in SFM for 24 h. Culture medium was then removed, cell membranes permeabilized using 50 μl of somatic cell ATP-releasing reagent, and samples incubated with 50 μl ATP Assay Mix Reagent containing luciferin and luciferase. Luminescence was measured immediately using a luminometer (Orion II Luminometer, Berthold Detection Systems, Oak Ridge, TN, USA). Cellular ATP levels are expressed in arbitrary units as the mean luminescence intensity of all samples within a group.
Mitochondrial membrane potential
Mitochondrial membrane potential (Δψm) measurements were carried out as we have described [56] using the indicator JC-1, a lipophilic, and cationic dye which fluoresces red when it aggregates in the matrix of healthy, high-potential mitochondria, and green in cells with low ΔΨm. Cells from confluent RPE cultures were harvested and JC-1 (1 μg/ml) added to 2 × 10⁶ cells/ml in suspension. Samples were incubated for 20 min at 37°C, washed, and analyzed by flow cytometry at an excitation wavelength of 488 nm. Data were collected at an emission wavelength of 530 nm for green fluorescence and 590 nm for red fluorescence. Ten thousand cells were analyzed and results expressed in arbitrary units as the mean fluorescence intensity for all samples within a group.
([Ca2+]c) and ([Ca2+]m) levels
Cytoplasmic calcium [Ca2+]c was measured using the fluorescent probe fluo-3/AM and mitochondrial calcium [Ca2+]m with Rhod-2/AM (Kd ~ 570 nM) as described [57–59]. Cells from confluent RPE cultures were seeded into 6-well plates at a density of 1 × 10⁵ cells/well in SFM for 24 h, then loaded with either 1 μM fluo-3/AM for 30 min or 1 μM rhod-2/AM for 1 h. Cells were harvested, washed, resuspended in 200 μl PBS, then analyzed by flow cytometry at excitation and emission wavelengths of 488 and 525 nm, respectively, for fluo-3/AM, and 549 and 581 nm, respectively, for Rhod-2/AM. Ten thousand cells were analyzed and results expressed in arbitrary units as mean fluorescence intensity for all samples within a group.
Statistical analysis
RPE cells of all age groups were cultured under identical conditions and values for each experiment determined using confluent monolayers. Experiments for each donor sample were carried out in triplicates at passages 3, 4, and 5 and the data for each sample calculated as an average of the nine values. Histograms generated represents the average values of the total number of donor samples within a given group (n = 7 per group) and the data expressed as the mean ± standard error (SE). One-way analysis of variance test was performed and statistical significance was set at p < 0.05.
Results
In this study, we measured age-related changes in mitochondrial function of human primary RPE cells from three age groups, young, mid-age, and >60 years old using seven donors per group and estimated how these cells respond to oxidative stress.
All RPE cultures were obtained from relatively healthy donors with no known ocular pathology. All eyes were harvested by 8–12 h post-mortem, RPE cells isolated, and cultures of all three groups maintained in identical growth conditions. Triplicate assays were carried out for the experiments described at passages 3, 4, and 5 for each of the seven samples within the group and the data presented as an average of all the samples within that age group.
Morphological changes in RPE cells
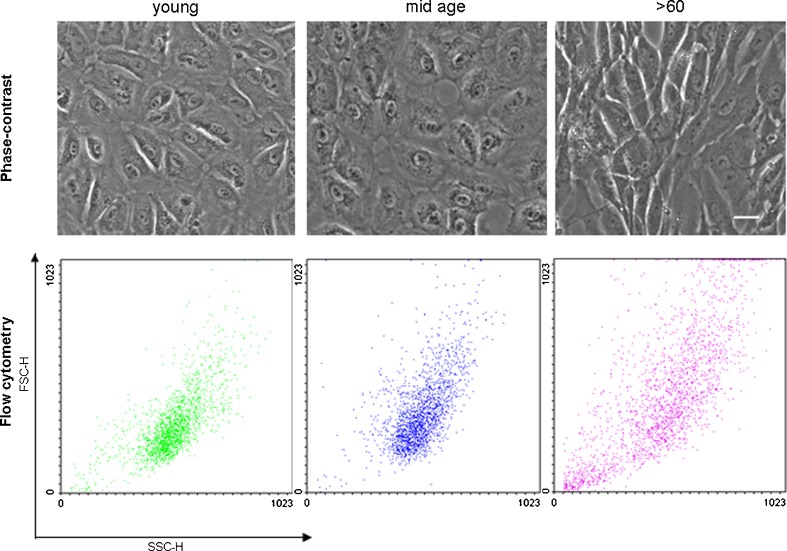
Phase-contrast microscopic observation indicated a size shift in RPE cells with increasing age (Fig. 1), which was confirmed by flow cytometry (Fig. 1) and electron microscopy (Fig. 7). All seven donors in the >60 group were larger and more elongated in appearance compared to all 14 cultures obtained from the <60-year-old samples as shown in the representative micrographs for each group (Fig. 1).
Fig. 1.
Phase-contrast micrographs showing examples of primary cultures of RPE cells from the young, mid-age, and >60 age groups (top panel). Cells appear larger and more elongated in the oldest age group. Scale bar 30 μm. Dot plots from flow cytometry analyses indicating increase in cell size (forward scatter) and cytoplasmic complexity (side scatter) with increased chronological age
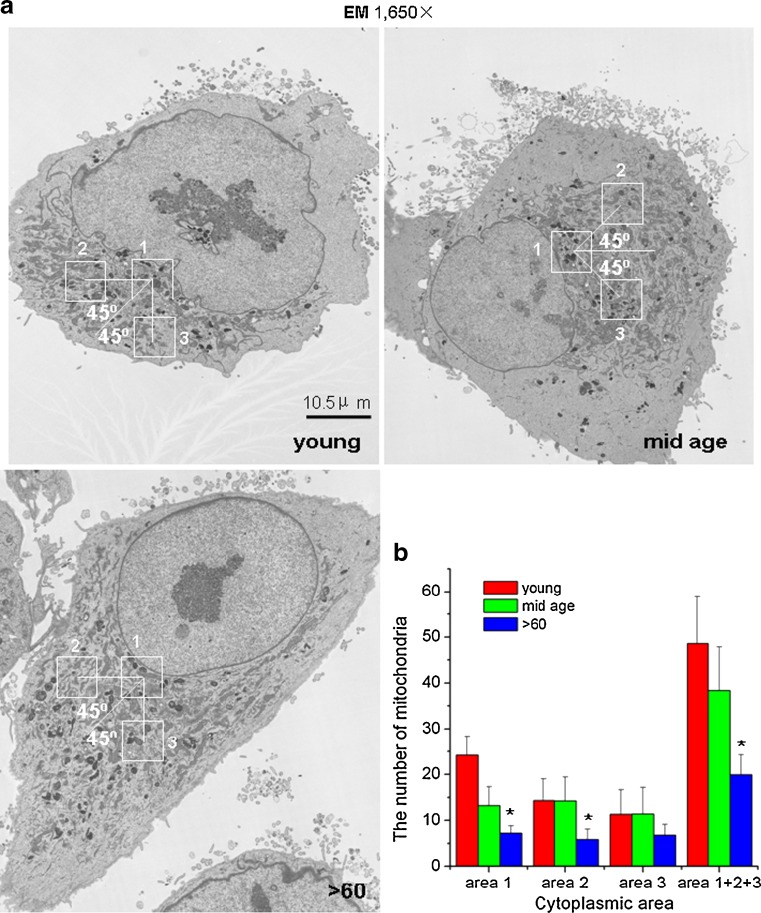
Fig. 7.
a The mitochondria in young and mid-age samples are in discrete perinuclear regions of the cells and appear more tightly packed compared to those in the >60-year-old samples. Scale bar 10.5 μm. b The histogram confirms visual observation of decreased numbers of individual mitochondria with increased aging. The data represent the mean of the average counts in all three areas of 20 cells per sample within the group
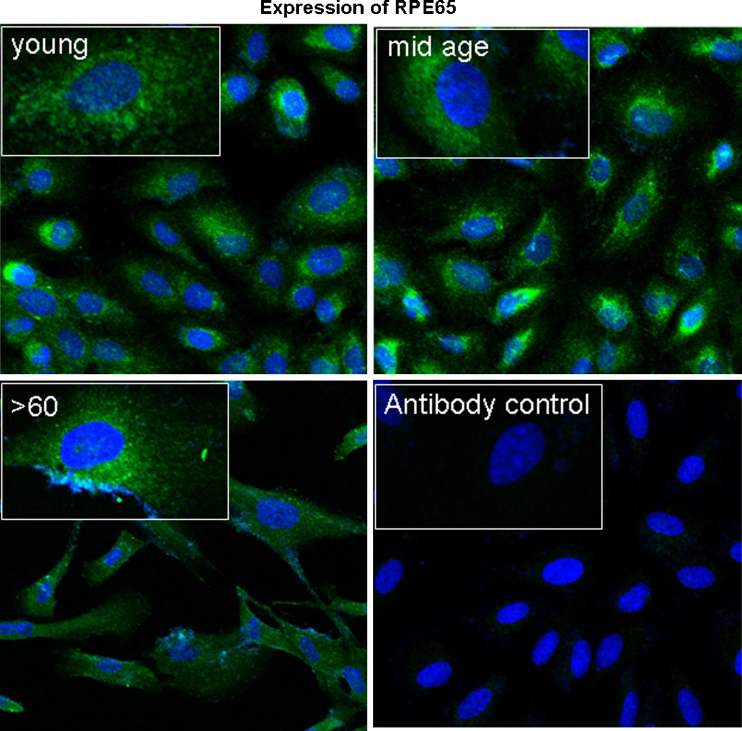
Cell size resolution by flow cytometry clearly shows size differences with increasing age (Fig. 1). Although we confirmed that cultures were enriched for RPE cells with >99% of cells expressing RPE65, an RPE specific marker (Fig. 2), there was considerable heterogeneity and complexity in cultures obtained from individuals >60 years old. This is indicated by the shift in side and forward scatter in the dot plot for these samples compared to those for the young and mid-age ranges. Dot plots for all ages below 60 years old show overlapping forward and side scatter profiles suggesting that these cells were similar in size complexity.
Fig. 2.
Greater than 99% of cells in all primary RPE cultures express the RPE specific marker, RPE-65 (green fluorescence). Scale bar 30 μm
Age-related sensitivity of RPE cells to oxidative stress
Here, we were interested in understanding how RPE cells coped with oxidative stress and how the aging process affected their coping mechanisms.
Cell death
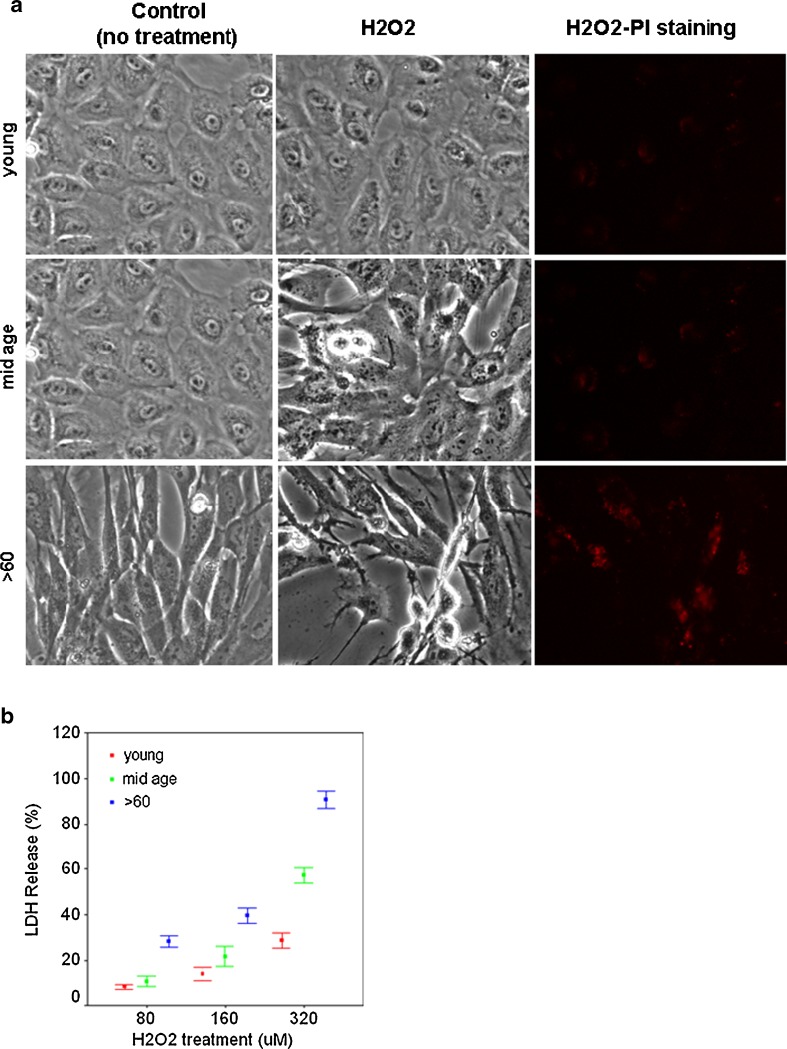
Susceptibility of confluent cultures from the various groups to oxidative stress was examined using measures that detected cell death and gene expression changes. In Fig. 3, we show that H2O2 had a significant effect on the viability of RPE cells in the oldest age group. Morphologically, these cells maintained an unhealthy, degenerative appearance after treatment. Fewer cells were visible on coverslips in part because of cell death and in part because of cell detachment although cells from all age groups were plated at the same seeding density. Both PI staining of the cells and LDH release into the culture medium indicated an increase in cell death with advanced aging (Fig. 3a, b).
Fig. 3.
a Phase-contrast light micrographs and PI staining (red labeling) show that cultures from the oldest age groups are more sensitive to H2O2 toxicity. PI staining was carried out on unfixed cells after H2O2 treatment. Scale bar 30 μm. b Age-related increase in LDH release at all concentrations of H2O2. Data are expressed as percentage of cell death as the mean ± SE of all samples within an age group (n = 7; p < 0.05)
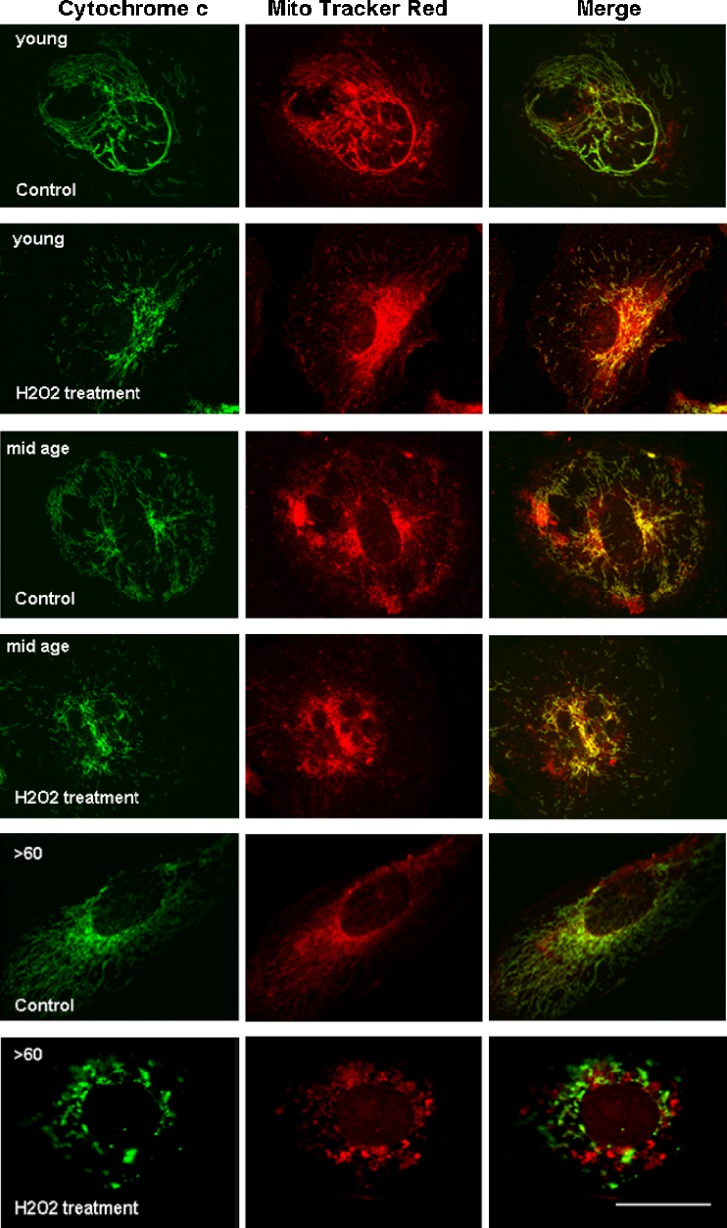
In addition, there was an increase in the release of cytochrome c in the >60-year-old cultures exposed to oxidative stress compared to younger counterparts. Cytochrome c is a component of the electron transport chain of the mitochondria. In response to apoptotic stimuli, cytochrome c is released into the cell cytoplasm by the mitochondria [60, 61]. In RPE cultures from all ages, we show colocalization of cytochrome c (green fluorescence) with mitotracker red (the mitochondrial marker) in control, nonstressed growth conditions (Fig. 4). However, when the cultures were challenged with oxidative stress, there was an almost complete lack of colocalization of the two fluorescent markers in the >60-year-old group while colocalization will still seen in the young and mid-age cultures.
Fig. 4.
In the control groups grown in standard growth medium, cytochrome c (green) colocalizes with mitochondrial staining (Mitotracker red) in RPE cells of all age groups (merged images) indicating that the cells in all control groups were healthy. With H2O2 treatment, however, colocalization of cytochrome c was only evident in the young and mid-age cells (merged images). The discrete green and red labeling in cells of the >60-year-old group suggest that cytochrome c was released from the mitochondrial into the cytoplasm of these cells. Scale bar 30 μm
Gene expression changes
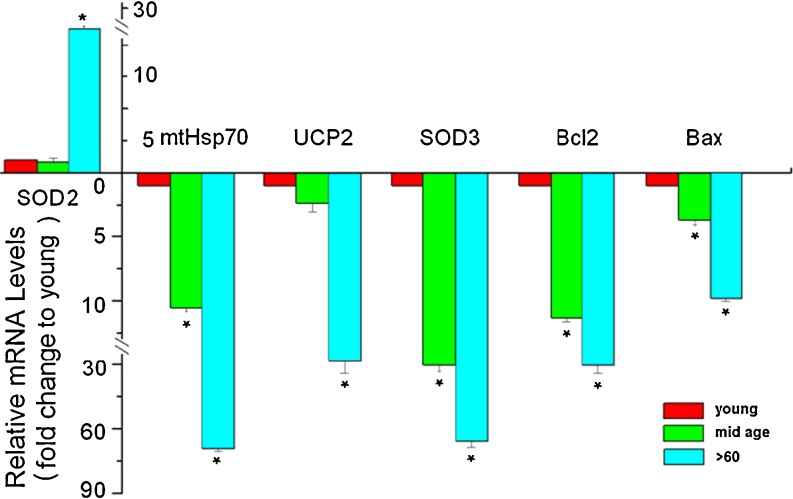
Given the structural, biochemical, and functional changes in RPE cells with increased aging, we examined expression of several genes important to mitochondrial health and function to assess mechanistic link with increased vulnerability of the cells to oxidative stress. The genes examined included the mtHsp70, mitochondria uncoupling protein 2 (UCP2), SOD2, and SOD3, part of the cells antioxidant defense repertoire, and the apoptosis regulators Bcl-2 (antiapoptotic) and Bax (proapoptotic). The data presented in Fig. 5 provide evidence for a consistent decrease in transcriptional levels of mtHsp70, UCP2, SOD3, Bcl-2, and Bax with an approximate 69-, 27-, 65-, 30-, and 11-fold changes, respectively, and an increase in SOD2 expression by ~21-fold between the youngest and oldest samples, supporting the hypothesis that aging RPE cells have a lower antioxidant defense threshold. Taken together, our data suggest that RPE cells have reduced oxidative stress coping mechanisms with increased aging and that severe stress can induce mitochondrial collapse and death in these cells.
Fig. 5.
Expression of antioxidant and apoptotic genes in RPE cells with increasing chronological age. Real-time PCR shows that there is a significant increase in transcripts for SOD 2 and decrease for mtHsp70, UCP2, SOD3, Bcl-2, and Bax genes with increasing age. The histogram represents mRNA fold changes to the mean of the “young” group. Results are expressed as the mean ± SE. *Significantly different from young group (p < 0.05)
Decreased levels of the anti- and pro-apoptotic genes with increased aging in cultures not exposed to oxidative stress are not surprising since the expression of these gene are usually triggered by an apoptotic challenge. This result is supported by the lack of cytochrome c release we observed in nonstressed cultures indicating that the cells were not undergoing apoptosis (Fig. 4). There were no significant changes in the expression of other genes involved in mitochondrial function including ATPase-α, b, γ, SOD1, COX1, and COX2 among cells of the various donor ages (data not shown).
Structural changes in the mitochondria
EM
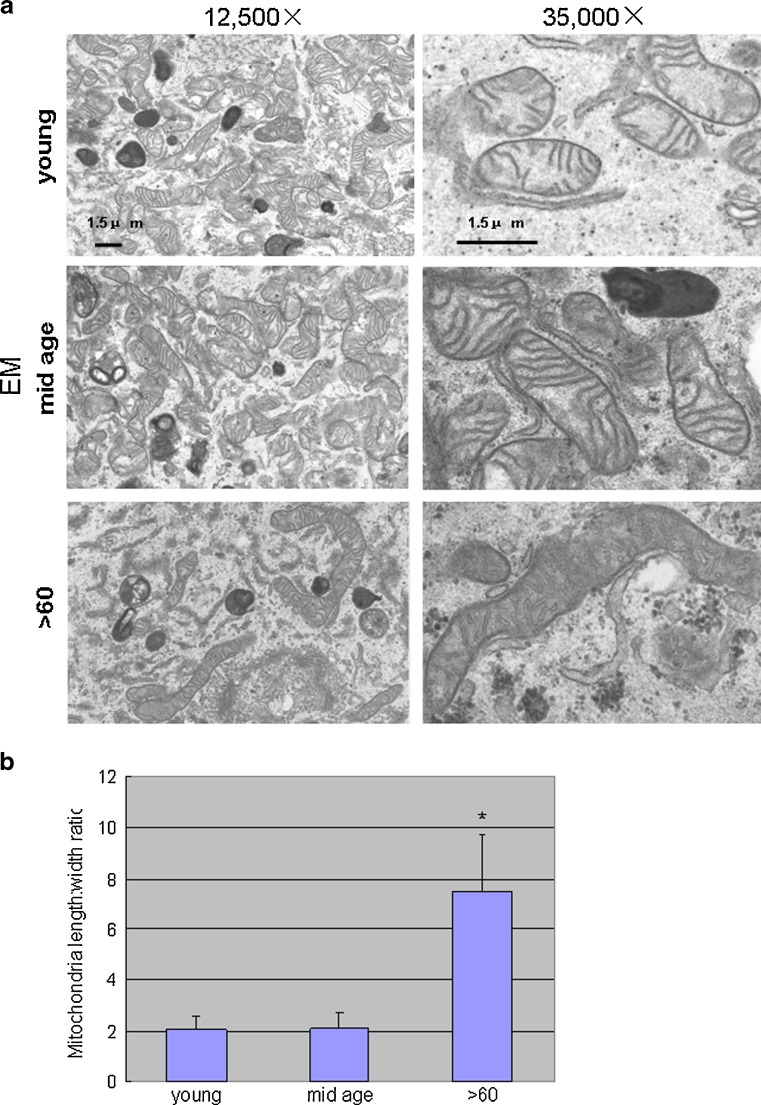
The EM comparisons indicated marked differences in the structural features of the mitochondria with aging. Those of the two younger groups were numerous, regular in size, and maintained a round or oval shape. Cristae were distinctly visible and the outer membranes appeared intact. Cells from the >60 age group contained mitochondria that were sparsely distributed in the cytoplasm, irregular in size, tubular in shape, larger, and had electron-dense matrices, less distinct cristae, and disrupted outer membranes (Fig. 6a). Length of the mitochondria in this group (width ratio) was almost sevenfold greater compared to the other ages (Fig. 6b).
Fig. 6.
a Electron micrographs of primary RPE cultures. The mitochondria in the two youngest age groups are regular in shape and size and contain intact membranes with visibly distinct inner and outer membranes and cristae. Those from the >60-year-old samples are fewer, larger, irregular in size, tubular in shape, have highly electron dense matrices and show architectural disruption in the membranes and cristae. Scale bar 1.5 μm. b Length/width ratio of these organelles is almost sevenfold different compared to young and mid-age samples (using NIH image J software)
Given the above findings of weakened antioxidant defenses with increased aging, we examined whether there were age-related structural and functional differences in the mitochondrial populations of RPE cells that may contribute to the cells increased susceptibility to oxidative stress. Using electron microscopy and rigorous cell counting with a standardized template, we identified a perinuclear “mitochondrial polarized” region in cells of all ages (Fig. 7a). There were fewer mitochondria per unit area in this region with increased donor age with greater than twofold difference between cells from the youngest and oldest groups (p < 0.05; Fig. 7b). The average number of mitochondria in all three template areas/cell (mitochondria/147 μM2/cell) was 48.63 ± 10.16, 38.36 ± 9.51, and 19.9 ± 4.13 for the young, mid-age, >60-year-old RPE, respectively.
Mitotracker labeling
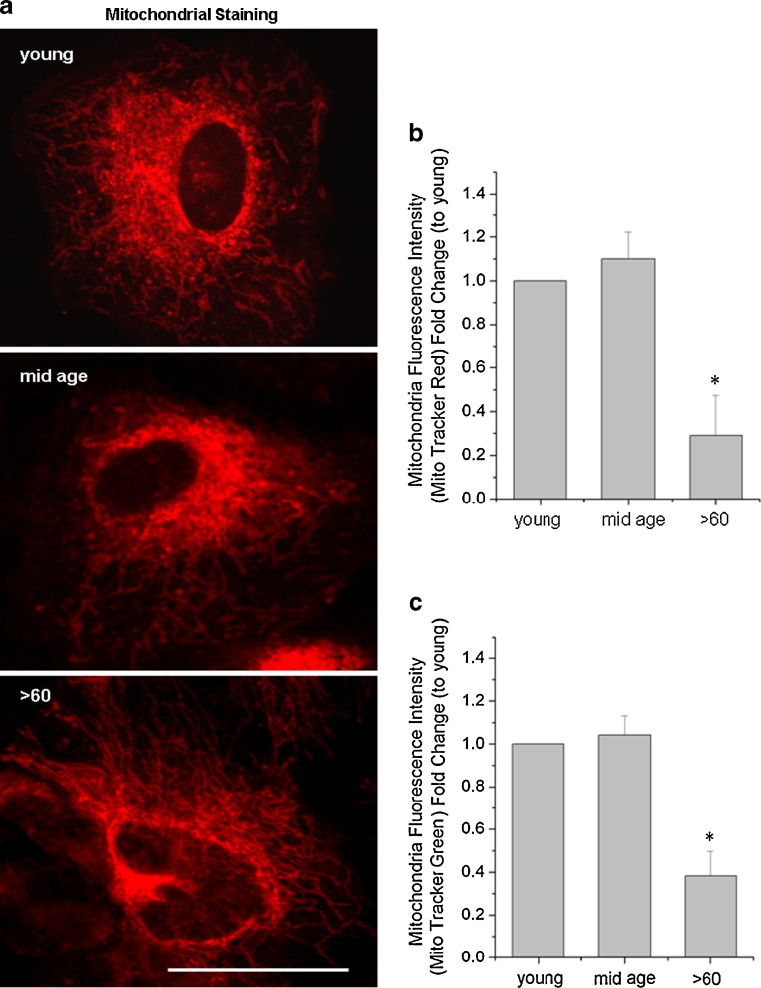
We extended the EM studies to confirm our findings of fewer mitochondria in the older cell population by labeling these organelles with two mitochondrial specific fluorescent dyes [16]and examining the distribution and intensity of the label by microscopic and flow cytometric analyses (Fig. 8a–c). The confocal images in Fig. 8a show that the Mito Tracker Red labeling intensity was decreased in the oldest population especially in the perinuclear region. Highly branching networks of labeled structures were also seen in this group compared to the discrete punctate perinuclear labeling in the youngest and mid-age groups. Fluorescent intensity of the two different mitochondrial labels measured by flow cytometry, indicated a 0.37 (±0.15) (Mito tracker green)- and 0.28 (±0.17) (Mito tracker red)-fold difference in the >60 years old compared to younger aged groups (Fig. 8b, c; p < 0.05). These results support the EM evidence for numerical, size, and distribution differences of the mitochondria among the three groups. Our results suggest that the response of the older cells to stress correlates with morphological and numerical changes in the mitochondrial population of these cells.
Fig. 8.
a Fluorescence intensity of the mitochondria indicator, Mito Tracker Red, is decreased is decreased with increasing age. The confocal images confirm discrete mitochondrial labeling in the perinuclear region in young and mid-age samples and branching labeled structures throughout cells of the >60-year-old samples. Scale bar 30 μm. b, c The histograms generated from flow cytometry (10,000 cells) show decrease fluorescence intensity with both Mitotracker red and green. Data are expressed as a fold change in fluorescence levels to the young group and as the mean ± SE of all samples in the group (n = 7). *Significantly different from young group (p < 0.05)
Abnormalities in mitochondrial function
ROS levels
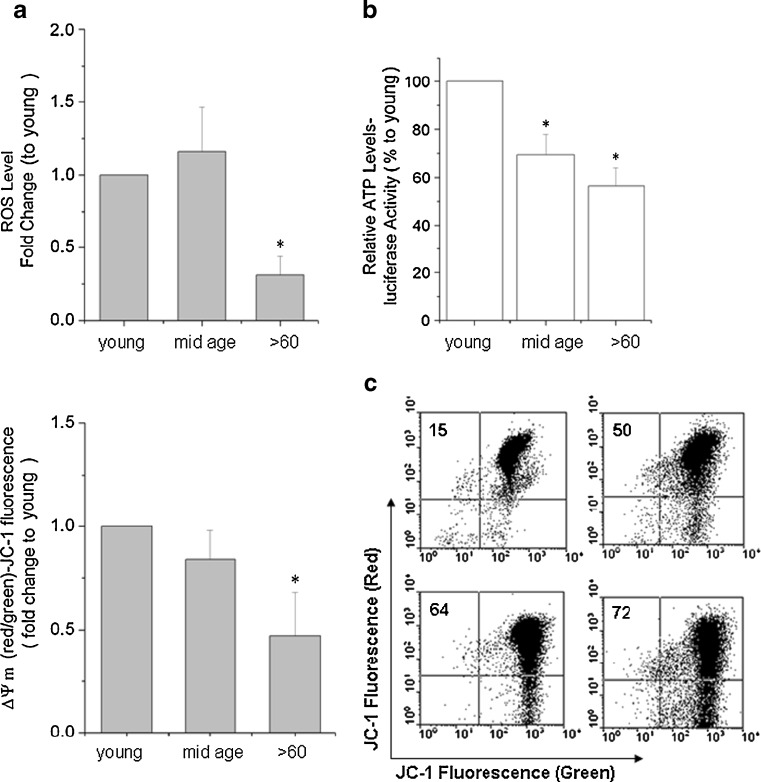
The free radical theory that the higher the metabolic rate, the greater the production of ROS, and the shorter the life span of the organism [1–6] may not hold true for all cells and species. Changes in the structure and distribution of the mitochondria in aging RPE cell populations led us to examine the function of the organelles in these samples. To our surprise, endogenous ROS production, measured by H2-DCF-DA oxidation and flow cytometric acquisition/analyses, was lower in the older samples. Levels decreased by 0.30-fold (±0.13) when compared to cells from the youngest donors (Fig. 9a; p < 0.05). One possibility that may account for this is that the older population of cells reduced metabolic activity and hence ROS production in a strategic maneuver to maintain function and prevent premature degeneration.
Fig. 9.
a Relative amount of total H2-DCF-DA fluorescence. There is a 0.30-fold (±0.13) decrease in ROS levels in the >60-year-old RPE group compared to young group. Data are expressed as a fold change in fluorescence levels to the young group and as the mean ± SE all samples within the group (n = 7). *Significantly different from young group (p < 0.05). b Similar comparisons are shown for ATP levels when the mean for the young samples were arbitrarily set at 100%. Results are expressed as a mean percentage of the ATP levels ± SE. *Significantly different from young samples (n = 7; p < 0.05). c Comparative ΔΨm measurements using the fluorescence indicator JC-1 and flow cytometry. The ΔΨm is 0.85-fold (±0.15) and 0.48-fold (±0.17) lower in mid-age, and >60 RPE cells, respectively, compared to the young samples. Results are expressed as the mean fold decrease in fluorescence levels to the young group, arbitrarily set at 100% ± SE. *Significantly different from young group (n = 7; p < 0.05)
ATP production
There was also an early and consistent decline in ATP levels by 30% and 44% in the mid-age and >60-year-old RPE cells, respectively, compared to younger aged cells (p < 0.05; Fig. 9b). The utilization of energy in the various aged RPE may, in part, explain the differences in vulnerability of the cells to oxidative stress and in their levels of ROS production.
Δψm
The bioenergetic profiles of the three age groups correlated well with the Δψm as would be expected. A 0.85-fold (±0.15) and 0.48-fold (±0.17) decrease in Δψm was seen in the mid-age and >60-year-old RPE cells, respectively, compared to their younger counterparts (Fig. 9c). The decrease in the Δψm is a key indicator of cell viability and would account for the increase in cytochrome c released into the cytoplasm of the cells followed by the apoptotic events noted in the aging cultures.
[Ca2+]c and [Ca2+]m levels
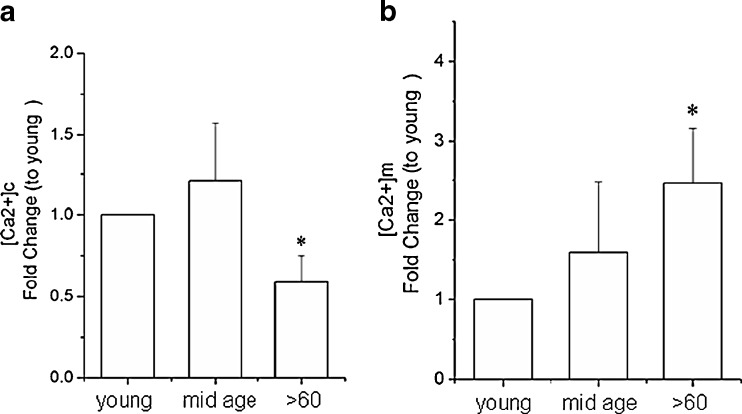
There is abundant evidence for altered calcium dynamics in the mitochondrial and cytoplasmic compartments of cells with aging in ways that render cells more vulnerable to degenerative events. When the resting levels of calcium in the cytoplasm [Ca2+]c and in the mitochondria [Ca2+]m of RPE cells were measured using the fluorescence Ca2+ indicators fluo-3/AM and Rhod-2/AM, respectively, we noted a significant decrease in [Ca2+]c and increase in mitochondrial sequestration of Ca2+ in RPE cells from older individuals compared to those in the younger age groups (Fig. 10). The relative amounts of total fluo-3 AM and Rhod-2 fluorescence intensity was decreased by 0.60-fold (±0.23) in [Ca2+]c and increased by 2.51-fold (± 0.70) in [Ca2+]m levels in the >60-year-old cultures, respectively, compared to the young cultures (Fig. 10a, b; p < 0.05). The disruption in calcium homeostatic mechanisms and the lower energy levels in the aging RPE cells are certain to impose limits in their response to environmental stress.
Fig. 10.
a Relative amounts of total fluo-3 AM fluorescence ([Ca2+]c). b Relative amount of total Rhod-2 fluorescence ([Ca2+]m) using flow cytometry. Data are expressed as a fold changes in fluorescence levels to the young samples and as the mean ± SE of all samples within the group. *Significantly different from young group (n = 7; p < 0.05)
We present several lines of evidence for structural, functional, and gene expression changes in the mitochondria of RPE cells with increased chronological age that may impose constraints on the cells that render them vulnerable to oxidative stress. Our findings imply that this process is progressive and detectable as early as age 60 at a time when a number of visual abnormalities become evident in the eye. We propose that decrease in synthesis of antioxidant enzymes and bioenergetic deficits in progressively aging RPE cells are likely to increase their sensitivity to oxidative stress. Such events may contribute to the development and/or progression of age related visual dysfunction.
Discussion
The retinal pigment epithelium is exposed to an oxygen-rich environment primarily due to elevated oxygen partial pressure from the choriocapillaries. RPE cells phagocytose and digest photoreceptor outer segments, which provide an additional oxidative burden to the cells since outer segments are extremely rich in polyunsaturated fatty acids (PUFA) [62]. Thus, ROS can be generated in RPE cells by oxidation of PUFAs [63, 64], the process of phagocytosis [48, 65], and RPE photosensitizers exposed to intense visible light [66, 67]. The production of excess ROS by normal metabolic processes and photochemical injury often lead to cumulative oxidative damage to the RPE [35–37], an event believed to be an underlying cause in some visual disorders. Here, we examined how oxidative stress and increased chronological aging alter the function of these organelles.
We show that with increased chronological age, RPE cells become larger and have more complex cytoplasmic compartments and an unusually intricate branching network of mitochondria compared to their younger counterparts, which likely reflects increased cell surface spreading. Mitochondria often undergo ultrastructural remodeling to tailor energy output to meet the demands on the cell and their number can vary between cells of the same tissue [68–71]. The “megamitochondria” we observed have disruptions in their cristae architecture, a condition which was previously noted with cross-linking ATP synthase complexes [72, 73]. A general trend in cells of older organisms is a decrease in number and increase in size of the mitochondrial population [70, 74]. Marked increase in the percentage of oversized mitochondria with structural abnormalities have been reported in several instances including in RPE cells of advance aged individuals with increasing severity [42] of AMD at the synaptic terminals of old rats [75] and in other adverse conditions where cells are exposed to large amounts of free radicals over an extended period [76, 77]. The speculation is that numeric loss of mitochondria is due, in part, to impaired duplicative capacity of these organelles and that a shift in size compensates for numbers to keep volume density and area involved in cellular respiration constant during the lifespan of the individual [70, 78–80]. mtDNA is highly susceptible to oxidative stress and unlike nuclear DNA, mutations in mtDNA are not repaired. These mitochondria can go undetected, duplicate, and increase in cells [81, 82]. It is, therefore, not surprising that aging RPE cells accumulate a subpopulation of impaired mitochondria which may weaken their response to stress and promote untimely cell degeneration.
To cope with toxic oxygen intermediates, cells evolve effective defenses against oxidative damage. RPE cells are particularly rich in anti-oxidants such as vitamin E, superoxide dismutase, catalase, glutathione-S-transferases, glutathione, and ascorbate [83, 84]. Catalase activity and hemeoxygenase-1 levels are known to decrease in aging RPE cells [85, 86]. We show that several antioxidant enzymes, including mtHsp70, UCP2, and SOD3 have reduced expression with increased aging of the cells, a possible explanation for why these cells are less viable when exposed to increased oxidative stress compared to younger cells. The structural and gene changes we observed correlated well with alterations in the mitochondria membrane potential, ATP production, ROS generation, and mitochondrial calcium levels clearly indicating that with increased aging RPE cells accumulate a subpopulation of dysfunctional mitochondria, which could increase their susceptibility to oxidative stress.
The decrease in ROS production in the aging cells contradicts popular findings that ROS increases in aging tissues. One explanation is that upregulation of SOD2 expression we noted in these cells may be a compensatory mechanism that attenuates ROS production with life span extension as a primary goal. Our finding of lower ATP levels in the cells underscores the “low metabolic rate–high life expectancy” principle.
Apoptosis is generally accompanied by loss of ΔΨm, induction of MPT opening, and cytosolic translocation of cytochrome c [60, 61] by the mitochondria in response to proapoptotic stimuli. Although the aging cells in normal growth conditions showed a decreased in ΔΨm compared to the younger cells, we did not detect release of cytochrome c or increased expression of Bax in these cells indicating that apoptotic mechanisms have not been triggered in the normal aging RPE population. However, mitochondrial collapse and cytochrome c release readily occurred when these cells were exposed to oxidative stress. Our results suggest that though aging RPE cells are viable they were not able to cope with oxidative stress compared to cells from younger donors.
Our observation of higher [Ca2+]m in the aging RPE follows physiological principles that [Ca2+]m overload can trigger MPTP opening resulting in lowered ΔΨm and cytochrome c release [58, 87–89] which was evident in these cultures. The logical progression then is that released cytochrome c interacts with the IP3 receptors inducing further calcium release from ER stores followed by massive cytochrome c release from the mitochondria and activation of apoptotic pathways. This study presents evidence that aging RPE cells are less likely to cope with high levels of oxidative stress because of abnormalities in a subpopulation of their mitochondria.
We hypothesize that RPE cell function may be severely compromised if abnormal mitochondria populations are not efficiently destroyed by the cells and accumulate above the normal aging threshold.
Acknowledgments
This work was supported by grants from the Ben Franklin Foundation, PA, USA, the National Basic Research Program of China (no. 2007CB512200), and the National Natural Science Foundation of China (no. 30672275, no. 30400486), NEI Core Grant P30 EY01931, and an unrestricted grant from Research to Prevent Blindness, Inc. to the Medical College of Wisconsin, and by grants from Shaanxi Province Departments of Health (no. 2010D56) and Education (no. 2010JK807), China. The first author received support from the China Scholarship Council.
Glossary
- AMD
Age-related macular degeneration
- RPE
Retinal pigment epithelium
- H2-DCF-DA
2′,7′-Dichlorodihydrofluorescin diacetate
- JC-1
5,5′,6,6′-Tetrachloro 1,1′3,3′-tetraethylbenzimid azolocarbocyanine iodide
- MPTP
Mitochondrial permeability transition pore
- ROS
Reactive oxygen species
- ΔΨm
Mitochondrial membrane potential
- ATP
Adenosine Triphosphate
- [Ca2+]c
Cytoplasmic calcium
- [Ca2+]m
Mitochondrial calcium
- mtHSP70
Mitochondrial heat shock protein 70
- SOD
Superoxide dismutase
- UCP2
Uncoupling protein 2
Contributor Information
Jian Ge, Email: gejian@mail.sysu.edu.cn.
Joyce Tombran-Tink, Email: jttink@aol.com.
References
- 1.Beckman KB, Ames BN. Mitochondrial aging: open questions. Ann N Y Acad Sci. 1998;854:118–127. doi: 10.1111/j.1749-6632.1998.tb09897.x. [DOI] [PubMed] [Google Scholar]
- 2.Sohal RS, Mockett RJ, Orr WC. Mechanisms of aging: an appraisal of the oxidative stress hypothesis. Free Radic Biol Med. 2002;33:575–586. doi: 10.1016/S0891-5849(02)00886-9. [DOI] [PubMed] [Google Scholar]
- 3.Pamplona R, Barja G, Portero-Otín M. Membrane fatty acid unsaturation, protection against oxidative stress, and maximum life span: a homeoviscous-longevity adaptation? Ann N Y Acad Sci. 2002;959:475–490. doi: 10.1111/j.1749-6632.2002.tb02118.x. [DOI] [PubMed] [Google Scholar]
- 4.Viña J, Sastre J, Pallardó FV, Gambini J, Borrás C. Role of mitochondrial oxidative stress to explain the different longevity between genders: protective effect of estrogens. Free Radic Res. 2006;40:1359–1365. doi: 10.1080/10715760600952851. [DOI] [PubMed] [Google Scholar]
- 5.Duchen MR. Contributions of mitochondria to animal physiology: from homeostatic sensor to calcium signaling and cell death. J Physiol. 1999;16:1–17. doi: 10.1111/j.1469-7793.1999.001aa.x. [DOI] [PMC free article] [PubMed] [Google Scholar]
- 6.Lane N. Mitochondrial disease: powerhouse of disease. Nature. 2006;440:600–602. doi: 10.1038/440600a. [DOI] [PubMed] [Google Scholar]
- 7.Mancuso C, Scapagini G, Currò D, Giuffrida Stella AM, Marco C, et al. Mitochondrial dysfunction, free radical generation and cellular stress response in neurodegenerative disorders. Front Biosci. 2007;12:1107–1123. doi: 10.2741/2130. [DOI] [PubMed] [Google Scholar]
- 8.Jezek P, Hlavatá L. Mitochondria in homeostasis of reactive oxygen species in cell, tissues, and organism. Int J Biochem Cell Biol. 2005;37:2478–2503. doi: 10.1016/j.biocel.2005.05.013. [DOI] [PubMed] [Google Scholar]
- 9.Czarna M, Jarmuszkiewicz W. Role of mitochondria in reactive oxygen species generation and removal; relevance to signaling and programmed cell death. Postepy Biochem. 2006;52:145–156. [PubMed] [Google Scholar]
- 10.Inoue M, Sato EF, Nishikawa M, Park AM, Kira Y, et al. Mitochondrial generation of reactive oxygen species and its role in aerobic life. Curr Med Chem. 2003;10:2495–2505. doi: 10.2174/0929867033456477. [DOI] [PubMed] [Google Scholar]
- 11.Passos JF, Saretzki G, Zglinicki T. DNA damage in telomeres and mitochondria during cellular senescence: is there a connection? Nucleic Acids Res. 2007;35:7505–7513. doi: 10.1093/nar/gkm893. [DOI] [PMC free article] [PubMed] [Google Scholar]
- 12.Chen JH, Hales CN, Ozanne SE. DNA damage, cellular senescence and organismal ageing: causal or correlative? Nucleic Acids Res. 2007;35:7417–7428. doi: 10.1093/nar/gkm681. [DOI] [PMC free article] [PubMed] [Google Scholar]
- 13.Stuart JA, Brown MF. Mitochondrial DNA maintenance and bioenergetics. Biochim Biophys Acta. 2006;1757:79–89. doi: 10.1016/j.bbabio.2006.01.003. [DOI] [PubMed] [Google Scholar]
- 14.Koopman WJ, Verkaart S, Visch HJ, Emst-de VS, Nijtmans LG, et al. Human NADH:ubiquinone oxidoreductase deficiency: radical changes in mitochondrial morphology? Am J Physiol Cell Physiol. 2007;293:C22–C29. doi: 10.1152/ajpcell.00194.2006. [DOI] [PubMed] [Google Scholar]
- 15.Chen X, Stern D, Yan SD. Mitochondrial dysfunction and Alzheimer's disease. Curr Alzheimer Res. 2006;3:515–520. doi: 10.2174/156720506779025215. [DOI] [PubMed] [Google Scholar]
- 16.Hauptmann S, Scherping I, Dröse S, Brandt U, Schulz KL, et al. Mitochondrial dysfunction: an early event in Alzheimer pathology accumulates with age in AD transgenic mice. Neurobiol Aging. 2008;30:1574–1586. doi: 10.1016/j.neurobiolaging.2007.12.005. [DOI] [PubMed] [Google Scholar]
- 17.Kwong JQ, Henning MS, Starkov AA, Manfredi G. The mitochondrial respiratory chain is a modulator of apoptosis. J Cell Biol. 2007;179:1163–1177. doi: 10.1083/jcb.200704059. [DOI] [PMC free article] [PubMed] [Google Scholar]
- 18.Lin MT, Beal MF. Mitochondrial dysfunction and oxidative stress in neurodegenerative diseases. Nature. 2006;443:787–795. doi: 10.1038/nature05292. [DOI] [PubMed] [Google Scholar]
- 19.Takuma K, Yao J, Huang J, Xu H, Chen X, et al. ABAD enhances Abeta-induced cell stress via mitochondrial dysfunction. FASEB J. 2005;19:597–598. doi: 10.1096/fj.04-2582fje. [DOI] [PubMed] [Google Scholar]
- 20.Beal MF. Mitochondrial dysfunction in neurodegenerative diseases. Biochim Biophys Acta. 1998;1366:211–223. doi: 10.1016/S0005-2728(98)00114-5. [DOI] [PubMed] [Google Scholar]
- 21.Krieger C, Duchen MR. Mitochondria, Ca2+ and neurodegenerative disease. Eur J Pharm. 2002;447:177–188. doi: 10.1016/S0014-2999(02)01842-3. [DOI] [PubMed] [Google Scholar]
- 22.Eckert A, Hauptmann S, Scherping I, Rhein V, Müller-Spahn F, et al. Soluble beta-amyloid leads to mitochondrial defects in amyloid precursor protein and tau transgenic mice. Neurodegener Dis. 2008;5:157–159. doi: 10.1159/000113689. [DOI] [PubMed] [Google Scholar]
- 23.Song DD, Shults CW, Sisk A, Rockenstein E, Masliah E. Enhanced substantia nigra mitochondrial pathology in human alpha-synuclein transgenic mice after treatment with MPTP. Exp Neurol. 2004;186:158–172. doi: 10.1016/S0014-4886(03)00342-X. [DOI] [PubMed] [Google Scholar]
- 24.Schapira AH. Mitochondria in the aetiology and pathogenesis of Parkinson's disease. Parkinsonism Relat Disord. 1999;5:139–143. doi: 10.1016/S1353-8020(99)00029-2. [DOI] [PubMed] [Google Scholar]
- 25.Valente EM, Abou-Sleiman PM, Caputo V. Hereditary early-onset Parkinson's disease caused by mutations in PINK1. Science. 2004;304:1158–1160. doi: 10.1126/science.1096284. [DOI] [PubMed] [Google Scholar]
- 26.Wenzel P, Schuhmacher S, Kienhöfer J. Manganese superoxide dismutase and aldehyde dehydrogenase deficiency increase mitochondrial oxidative stress and aggravate age-dependent vascular dysfunction. Cardiovasc Res. 2008;80:280–289. doi: 10.1093/cvr/cvn182. [DOI] [PMC free article] [PubMed] [Google Scholar]
- 27.Hayakawa N, Yokoyama H, Kato H, Araki T. Age-related alterations of oxidative stress markers in campal CA1 sector. Exp Mol Pathol. 2008;85:135–140. doi: 10.1016/j.yexmp.2008.05.001. [DOI] [PubMed] [Google Scholar]
- 28.Sasaki T, Unno K, Tahara S, Shimada A, Chiba Y, et al. Age-related increase of superoxide generation in the brains of mammals and birds. Aging Cell. 2008;7:459–469. doi: 10.1111/j.1474-9726.2008.00394.x. [DOI] [PubMed] [Google Scholar]
- 29.Kimura K, Tanaka N, Nakamura N, Takano S, Ohkuma S. Knockdown of mitochondrial heat shock protein 70 promotes progeria-like phenotypes in Caenorhabditis elegans. J Biol Chem. 2007;282:5910–5918. doi: 10.1074/jbc.M609025200. [DOI] [PubMed] [Google Scholar]
- 30.Kirkwood TB. Understanding the odd science of aging. Cell. 2005;120:437–447. doi: 10.1016/j.cell.2005.01.027. [DOI] [PubMed] [Google Scholar]
- 31.D’Cruz PM, Yasumura D, Weir J, Matthes MT, Abderrahim H, et al. Mutation of the receptor tyrosine kinase gene Mertk in the retinal dystrophic RCS rat. Hum Mol Genet. 2000;9:645–651. doi: 10.1093/hmg/9.4.645. [DOI] [PubMed] [Google Scholar]
- 32.Gal A, Li Y, Thompson DA, Weir J, Orth U, et al. Mutations in MERTK, the human orthologue of the RCS rat retinal dystrophy gene, cause retinitis pigmentosa. Nat Genet. 2000;26:270–271. doi: 10.1038/81555. [DOI] [PubMed] [Google Scholar]
- 33.Dorey CK, Wu G, Ebenstein D, Garsd A, Weiter JJ. Cell loss in the aging retina. Relationship to lipofuscin accumulation and macular degeneration. Invest Ophthalmol Vis Sci. 1989;30:1691–1699. [PubMed] [Google Scholar]
- 34.Green WR, Enger C. Age-related macular degeneration histopathologic studies. The 1992 Lorenz E. Zimmerman lecture. Ophthalmology. 1993;100:1519–1535. doi: 10.1016/s0161-6420(93)31466-1. [DOI] [PubMed] [Google Scholar]
- 35.Beatty S, Koh H, Phil M, Henson D, Boulton M. The role of oxidative stress in the pathogenesis of age-related macular degeneration. Surv Ophthalmol. 2000;45:115–134. doi: 10.1016/S0039-6257(00)00140-5. [DOI] [PubMed] [Google Scholar]
- 36.Dunaief JL, Dentchev T, Ying GS, Milam AH. The role of apoptosis in age-related macular degeneration. Arch Ophthalmol. 2002;120:1435–1442. doi: 10.1001/archopht.120.11.1435. [DOI] [PubMed] [Google Scholar]
- 37.Winkler BS, Boulton ME, Gottsch JD, Sternberg P. Oxidative damage and age-related macular degeneration. Mol Vis. 1999;5:32. [PMC free article] [PubMed] [Google Scholar]
- 38.Green WR, McDonnell PJ, Yeo JH. Pathologic features of senile macular degeneration. Ophthalmology. 1985;92:615–627. [PubMed] [Google Scholar]
- 39.Young RW. Pathophysiology of age-related macular degeneration. Surv Ophthalmol. 1987;31:291–306. doi: 10.1016/0039-6257(87)90115-9. [DOI] [PubMed] [Google Scholar]
- 40.Hageman GS, Luthert PJ, Victor Chong NH, Johnson LV, Anderson DH, et al. An integrated hypothesis that considers drusen as biomarkers of immune-mediated processes at the RPE-Bruch’s membrane interface in aging and age related macular degeneration. Prog Retin Eye Res. 2001;20:705–732. doi: 10.1016/S1350-9462(01)00010-6. [DOI] [PubMed] [Google Scholar]
- 41.Penfold PL, Madigan MC, Gillies MC, Provis JM. Immunological and aetiological aspects of macular degeneration. Prog Retin Eye Res. 2001;20:385–414. doi: 10.1016/S1350-9462(00)00025-2. [DOI] [PubMed] [Google Scholar]
- 42.Feher J, Kovacs I, Artico M, Cavallotti C, Papale A, et al. Mitochondrial alterations of retinal pigment epithelium in age-related macular degeneration. Neurobiol Aging. 2006;27:983–993. doi: 10.1016/j.neurobiolaging.2005.05.012. [DOI] [PubMed] [Google Scholar]
- 43.Weiter JJ. Phototoxic changes in the retina. In: Miller D, editor. Clinical light damage to the eye. New York: Springer; 1987. pp. 79–125. [Google Scholar]
- 44.Zareba M, Raciti MW, Henry MM, Sarna T, Burke JM. Oxidative stress in ARPE-19 cultures: do melanosomes confer cytoprotection? Free Radic Biol Med. 2006;40:87–100. doi: 10.1016/j.freeradbiomed.2005.08.015. [DOI] [PubMed] [Google Scholar]
- 45.Nordgaard CL, Karunadharma PP, Feng X, Olsen TW, Ferrington DA. Mitochondrial proteomics of the retinal pigment epithelium at progressive stages of age-related macular degeneration. Invest Ophthalmol Vis Sci. 2008;49:2848–2855. doi: 10.1167/iovs.07-1352. [DOI] [PMC free article] [PubMed] [Google Scholar]
- 46.Jin M, Yaung J, Kannan R, He S, Ryan SJ, et al. Hepatocyte growth factor protects RPE cells from apoptosis induced by glutathione depletion. Invest Ophthalmol Vis Sci. 2005;46:4311–4319. doi: 10.1167/iovs.05-0353. [DOI] [PubMed] [Google Scholar]
- 47.Liang FQ, Godley BF. Oxidative stress-induced mitochondrial DNA damage in human retinal pigment epithelial cells: a possible mechanism for RPE aging and age-related macular degeneration. Exp Eye Res. 2003;76:397–403. doi: 10.1016/S0014-4835(03)00023-X. [DOI] [PubMed] [Google Scholar]
- 48.Jin GF, Hurst JS, Godley BF. Rod outer segments mediate mitochondrial DNA damage and apoptosis in human retinal pigment epithelium. Curr Eye Res. 2001;23:11–19. doi: 10.1076/ceyr.23.1.11.5423. [DOI] [PubMed] [Google Scholar]
- 49.Wang AL, Lukas TJ, Yuan M, Neufeld AH. Increased mitochondrial DNA damage and down-regulation of DNA repair enzymes in aged rodent retinal pigment epithelium and choroid. Mol Vis. 2008;14:644–651. [PMC free article] [PubMed] [Google Scholar]
- 50.Suter M, Remé C, Grimm C, Wenzel A, Jäättela M, et al. Age-related macular degeneration. The lipofusion component N-retinyl-N-retinylidene ethanolamine detaches proapoptotic proteins from mitochondria and induces apoptosis in mammalian retinal pigment epithelial cells. J Biol Chem. 2000;275:39625–39630. doi: 10.1074/jbc.M007049200. [DOI] [PubMed] [Google Scholar]
- 51.McKay BS, Burke JM. Separation of phenotypically distinct subpopulations of cultured human retinal pigment epithelial cells. Exp Cell Res. 1994;213:85–92. doi: 10.1006/excr.1994.1176. [DOI] [PubMed] [Google Scholar]
- 52.Campos CB, Paim BA, Cosso RG, Castilho RF, Rottenberg H, et al. Method for monitoring of mitochondrial cytochrome c release during cell death: immunodetection of cytochrome c by flow cytometry after selective permeabilization of the plasma membrane. Cytometry A. 2006;69:515–523. doi: 10.1002/cyto.a.20273. [DOI] [PubMed] [Google Scholar]
- 53.Ma X, Tian X, Huang X, Yan F, Qiao D. Resveratrol-induced mitochondrial dysfunction and apoptosis are associated with Ca2+ and mCICR-mediated MPT activation in HepG2 cells. Mol Cell Biochem. 2007;302:99–109. doi: 10.1007/s11010-007-9431-8. [DOI] [PubMed] [Google Scholar]
- 54.Degli Esposti M. Measuring mitochondrial reactive oxygen species. Methods. 2002;26:335–340. doi: 10.1016/S1046-2023(02)00039-7. [DOI] [PubMed] [Google Scholar]
- 55.Amer J, Goldfarb A, Fibach E. Flow cytometric measurement of reactive oxygen species production by normal and thalassaemic red blood cells. Eur J Haematol. 2003;70:84–90. doi: 10.1034/j.1600-0609.2003.00011.x. [DOI] [PubMed] [Google Scholar]
- 56.He Y, Tombran-Tink J, Ge J, Yue HZ, Duan S, et al. Mitochondrial complex I defect induces ROS release and degeneration in trabecular meshwork cells of POAG patients: protection by antioxidants. Invest Ophthalmol Vis Sci. 2008;49:1447–1458. doi: 10.1167/iovs.07-1361. [DOI] [PubMed] [Google Scholar]
- 57.He Y, Ge J, Tombran-Tink J. Mitochondrial defects and dysfunction in calcium regulation in glaucomatous trabecular meshwork cells. Invest Ophthalmol Vis Sci. 2008;49:4912–4922. doi: 10.1167/iovs.08-2192. [DOI] [PubMed] [Google Scholar]
- 58.Deng X, Yin F, Lu X, Cai B, Yin W. The apoptotic effect of brucine from the seed of Strychnos nux-vomica on human hepatoma cells is mediated via Bcl-2 and Ca2+ involved mitochondrial pathway. Toxicol Sci. 2006;91:59–69. doi: 10.1093/toxsci/kfj114. [DOI] [PubMed] [Google Scholar]
- 59.Mironov SL, Ivannikov MV, Johansson M. [Ca2+]i signaling between mitochondria and endoplasmic reticulum in neurons is regulated by microtubules. From mitochondrial permeability transition pore to Ca2+-induced Ca2+ release. J Biol Chem. 2005;280:715–721. doi: 10.1074/jbc.M409819200. [DOI] [PubMed] [Google Scholar]
- 60.Armstrong JS. Mitochondrial membrane permeabilization: the sine qua non for cell death. Bioessays. 2006;28:253–260. doi: 10.1002/bies.20370. [DOI] [PubMed] [Google Scholar]
- 61.Green DR, Kroemer G. The pathophysiology of mitochondrial cell death. Science. 2004;305:626–629. doi: 10.1126/science.1099320. [DOI] [PubMed] [Google Scholar]
- 62.Snodderly DM. Evidence for protection against age-related macular degeneration by carotenoids and antioxidant vitamins. Am J Clin Nutr. 1995;62:1448S–1461S. doi: 10.1093/ajcn/62.6.1448S. [DOI] [PubMed] [Google Scholar]
- 63.Esterbauer H, Schaur RJ, Zollner H. Chemistry and biochemistry of 4-hydroxynonenal, malonaldehyde and related aldehydes. Free Radic Biol Med. 1991;11:81–128. doi: 10.1016/0891-5849(91)90192-6. [DOI] [PubMed] [Google Scholar]
- 64.Srivastava S, Chandra A, Bhatnagar A, Srivastava SK, Ansari NH. Lipid peroxidation product, 4-hydroxynonenal and its conjugate with GSH are excellent substrates of bovine lens aldose reductase. Biochem Biophys Res Commun. 1995;217:741–746. doi: 10.1006/bbrc.1995.2835. [DOI] [PubMed] [Google Scholar]
- 65.Tate DJ, Jr, Miceli MV, Newsome DA. Phagocytosis and H2O2 induce catalase and metallothionein gene expression in human retinal pigment epithelial cells. Invest Ophthalmol Vis Sci. 1995;36:1271–1279. [PubMed] [Google Scholar]
- 66.Gaillard ER, Atherton SJ, Eldred G, Dillon J. Photophysical studies on human retinal lipofuscin. Photochem Photobiol. 1995;61:448–453. doi: 10.1111/j.1751-1097.1995.tb02343.x. [DOI] [PubMed] [Google Scholar]
- 67.Rozanowska M, Jarvis-Evans J, Korytowski W, Boulton ME, Burke JM, et al. Blue light-induced reactivity of retinal age pigment. In vitro generation of oxygen-reactive species. J Biol Chem. 1995;270:18825–18830. doi: 10.1074/jbc.270.32.18825. [DOI] [PubMed] [Google Scholar]
- 68.Knott AB, Perkins G, Schwarzenbacher R, Bossy-Wetzel E. Mitochondrial fragmentation in neurodegeneration. Nat Rev Neurosci. 2008;9:505–518. doi: 10.1038/nrn2417. [DOI] [PMC free article] [PubMed] [Google Scholar]
- 69.Bereiter-Hahn J, Vöth M. Dynamics of mitochondria in living cells: shape changes, dislocations, fusion, and fission of mitochondria. Microsc Res Tech. 1994;27:198–219. doi: 10.1002/jemt.1070270303. [DOI] [PubMed] [Google Scholar]
- 70.Bertoni-Freddari C, Fattoretti P, Casoli T, Spagna C, Meier-Ruge W, et al. Morphological plasticity of synaptic mitochondria during aging. Brain Res. 1993;628:193–200. doi: 10.1016/0006-8993(93)90955-M. [DOI] [PubMed] [Google Scholar]
- 71.Bertoni-Freddari C, Fattoretti P, Casoli T, Stefano G, Solazzi M, et al. Quantitative cytochemical mapping of mitochondrial enzymes in rat cerebella. Micron. 2001;32:405–410. doi: 10.1016/S0968-4328(00)00015-9. [DOI] [PubMed] [Google Scholar]
- 72.Ko YH, Delannoy M, Hullihen J, Chiu W, Pedersen PL. Mitochondrial ATP synthasome. Cristae-enriched membranes and a multiwell detergent screening assay yield dispersed single complexes containing the ATP synthase and carriers for Pi and ADP/ATP. J Biol Chem. 2003;278:12305–12309. doi: 10.1074/jbc.C200703200. [DOI] [PubMed] [Google Scholar]
- 73.Gavin PD, Prescott M, Luff SE, Devenish RJ. Cross-linking ATP synthase complexes in vivo eliminates mitochondrial cristae. J Cell Sci. 2004;117:2333–2343. doi: 10.1242/jcs.01074. [DOI] [PubMed] [Google Scholar]
- 74.Bertoni-Freddari C, Balietti M, Giorgetti B, et al. Selective decline of the metabolic competence of oversized synaptic mitochondria in the old monkey cerebellum. Rejuvenation Res. 2008;11:387–391. doi: 10.1089/rej.2008.0659. [DOI] [PubMed] [Google Scholar]
- 75.Melov S. Modeling mitochondrial function in aging neurons. Trends Neurosci. 2004;27:601–606. doi: 10.1016/j.tins.2004.08.004. [DOI] [PubMed] [Google Scholar]
- 76.Karbowski M, Kurono C, Wozniak M, et al. Free radical-induced megamitochondria formation and apoptosis. Free Radic Biol Med. 1999;26:396–409. doi: 10.1016/S0891-5849(98)00209-3. [DOI] [PubMed] [Google Scholar]
- 77.Wakabayashi T. Megamitochondria formation—physiology and pathology. J Cell Mol Med. 2002;6:497–538. doi: 10.1111/j.1582-4934.2002.tb00452.x. [DOI] [PMC free article] [PubMed] [Google Scholar]
- 78.Solmi R, Pallotti F, Rugolo M, et al. Lack of major mitochondrial bioenergetic changes in cultured skin fibroblasts from aged individuals. Biochem Mol Biol Int. 1994;33:477–484. [PubMed] [Google Scholar]
- 79.Bertoni-Freddari C, Fattoretti P, Paoloni R, Caselli U, Giorgetti B, et al. Inverse correlation between mitochondrial size and metabolic competence: a quantitative cytochemical study of cytochrome oxidase activity. Naturwissenschaften. 2003;90:68–71. doi: 10.1007/s00114-002-0398-8. [DOI] [PubMed] [Google Scholar]
- 80.Bertoni-Freddari C, Fattoretti P, Giorgetti B, Spazzafumo L, Solazzi M, et al. Age-related decline in metabolic competence of small and medium-sized synaptic mitochondria. Naturwissenschaften. 2005;92:82–85. doi: 10.1007/s00114-004-0591-z. [DOI] [PubMed] [Google Scholar]
- 81.Sastre J, Pallardó FV, García de la Asunción J, Viña J. Mitochondria, oxidative stress and aging. Free Radic Res. 2000;32:189–198. doi: 10.1080/10715760000300201. [DOI] [PubMed] [Google Scholar]
- 82.Barja G. Free radicals and aging. Trends Neurosci. 2004;27:595–600. doi: 10.1016/j.tins.2004.07.005. [DOI] [PubMed] [Google Scholar]
- 83.Newsome DA, Dobard EP, Liles MR, Oliver PD. Human retinal pigment epithelium contains two distinct species of superoxide dismutase. Invest Ophthalmol Vis Sci. 1990;31:2508–2513. [PubMed] [Google Scholar]
- 84.Beatty S, Murray IJ, Henson DB, Carden D, Koh H, et al. Macular pigment and risk for age-related macular degeneration in subjects from a Northern European population. Invest Ophthalmol Vis Sci. 2001;42:439–446. [PubMed] [Google Scholar]
- 85.Liles MR, Newsome DA, Oliver PD. Antioxidant enzymes in the aging human retinal pigment epithelium. Arch Ophthalmol. 1991;109:1285–1288. doi: 10.1001/archopht.1991.01080090111033. [DOI] [PubMed] [Google Scholar]
- 86.Tate DJ, Jr, Newsome DA, Oliver PD. Metallothionein shows an age-related decrease in human macular retinal pigment epithelium. Invest Ophthalmol Vis Sci. 1993;34:2348–2351. [PubMed] [Google Scholar]
- 87.Berridge MJ, Lipp P, Bootman MD. The versatility and universality of calcium signaling. Nature. 2000;1:11–21. doi: 10.1038/35036035. [DOI] [PubMed] [Google Scholar]
- 88.Jackson JG, Thayer SA. Mitochondrial modulation of Ca2+-induced Ca2+-release in rat sensory neurons. J Neurophysiol. 2006;96:1093–1104. doi: 10.1152/jn.00283.2006. [DOI] [PubMed] [Google Scholar]
- 89.Dahlem YA, Wolf G, Siemen D, Horn TF. Combined modulation of the mitochondrial ATP-dependent potassium channel and the permeability transition pore causes prolongation of the biphasic calcium dynamics. Cell Calcium. 2006;39:387–400. doi: 10.1016/j.ceca.2006.01.001. [DOI] [PubMed] [Google Scholar]


