

Abstract
Step-by-step variations occur during normal human walking, induced in part by imperfect sensorimotor control and naturally occurring random perturbations. These effects might increase energy expenditure during walking, because they differ from the nominal preferred gait, which is typically the most economical, and because of the cost of making active feedback adjustments to maintain gait stability. We tested this hypothesis by artificially inducing greater step variability through visual perturbations from a virtual reality display, and measuring the effect on energy expenditure. Young healthy adult subjects (N = 11) walked on a treadmill while viewing a virtual hallway, to which virtual perturbations were applied in fore-aft or medio-lateral directions. The greatest effect on gait was achieved with medio-lateral visual perturbations, which resulted in a 65% increase in step width variability and a 5.9% increase (both P < 0.05) in net metabolic rate compared to walking without perturbations. Perturbations generally induced greater variability in both step width and (to a lesser degree) step length, and also induced slightly wider and (to a lesser degree) shorter mean steps. Each of these measures was found to correlate significantly with each other, regardless of perturbation direction and magnitude. They also correlated with metabolic rate (P < 0.05 for each separate measure), despite explaining only a modest proportion of overall energetic variations (R2 < 0.40). Step variability increases with some gait disorders and with increasing age. Our results suggest that imperfect sensorimotor control may contribute to the increased metabolic cost of walking observed with such conditions.
Keywords: gait, balance, step variability, energetic cost
INTRODUCTION
Humans expend metabolic energy to actively move the limbs and body during walking. Steady gait has a nominal periodic pattern that almost certainly accounts for most of the energy expenditure. But even apparently steady gait has small step-by-step variations, which may in part be associated with noisy fluctuations in muscle force, imperfect sensorimotor control, and perturbations from the environment [1]. These variations have also been observed to increase with some gait deficits as well as with age [2-6]. Step variability might also contribute to energy expenditure, for example due to the effort expended to make feedback corrections to reduce these variations and maintain stability, or simply because the nominal gait is energetically economical and deviations from it are more costly. If this is indeed the case, increased variability might explain a portion of the increased energy expenditure often associated with impaired or unusual gait [7-10].
There are at least two reasons why variations in steps might cost additional energy. One is that active feedback corrections themselves require muscular effort. For example, step-by-step foot placements—particularly in the lateral direction—appear to be actively controlled to correct balance during the preceding step [1, 11, 12]. Adjustments to stabilize the nominal gait pattern against variations may require some work or force to be performed on the limbs, and at some energetic cost. The second reason is that gait economy may be reduced by high variability of steps, regardless of whether they are produced actively, passively, or by external influence. This is because, for a given speed, humans prefer a nominal step length [13] and width [14] that coincide with a minimum of energy expenditure. Although these costs have been quantified only for steady-state changes in mean step length or width from preferred, it would nonetheless be expected that similar costs apply for step-by-step variations from nominal. We therefore hypothesize that additional energy is expended, first to produce corrections related to balance, and second as a consequence of those steps deviating from the energetically optimal, nominal gait pattern.
Use of external stabilization provides indirect evidence for the cost of step variability. Lateral stability may be artificially improved for treadmill walking by attaching elastic cords to the pelvis and extending them laterally to a fixed support [15]. Such external stabilization reduces lateral step variability and decreases metabolic energy expenditure by up to 9% [7, 15, 16]. However, this decrease cannot be attributed solely to step variability because external stabilization applies forces to the body and may affect gait mechanics in unintended ways. The hypothesized cost of step variability should therefore be tested without applying forces to the body.
We explored another approach for experimentally affecting gait variability, by applying perturbations to the visual field. During treadmill walking, visual perturbations applied through a virtual reality display induce a false sense of imbalance and lead to greater step variability, with particularly high sensitivity in the lateral direction [12]. Unlike external lateral stabilization, this approach affects step variability through sensory information alone. The purpose of the present study was to use virtual reality to test whether visually induced step variability leads to increased energy expenditure compared to normal, unperturbed walking.
METHODS
We measured the effect of visual perturbations, applied through virtual reality, on step placement variability and metabolic rate, as indicators of active balance control during walking and the energetic cost of such effort. Based on previous observations [12], we expected that visual perturbations in the medio-lateral direction would elicit significant increases in step variability. Here we hypothesized that such increases would lead to greater energy expenditure, and performed the following measurements to test that hypothesis.
Eleven young adults (all male; body mass 74.6 ± 11.4 kg, mean ± s.d.; leg length 0.99 ± 0.05 m; age 18 - 22 yrs) provided informed consent according to University of Michigan procedures and participated in this study. All were healthy adults with no known visual conditions or impairments affecting daily walking function; including vestibular conditions, somatosensory loss, or neurological disorders.
Subjects walked on an instrumented treadmill [17] while viewing a virtual dark hallway tiled with randomly placed white rectangles [18] (Fig. 1). The hallway was displayed through a wide field-of-view, projection system placed around the treadmill [for details see 12]. Subjects walked at a constant speed of 1.25 m/s, and were instructed to look forward and use the visual information as naturally as possible. The virtual hallway was nominally stationary, with perturbations applied to the static view according to condition. Previous results suggest that humans have similar sensitivity to perturbations whether or not the hallway is nominally moving [12].
Figure. 1.
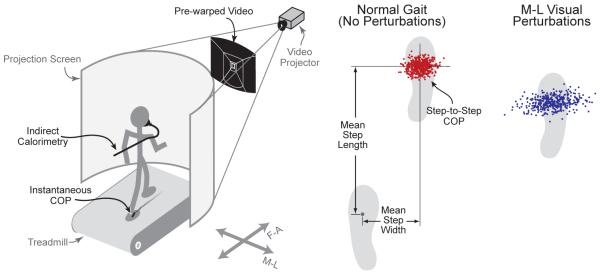
Experimental set-up for increasing gait unsteadiness, and definition of step parameters. Subjects walked on an instrumented treadmill while viewing a rear-projected virtual hallway. Visual perturbations to the virtual hallway were applied in the M-L and F-A directions, and their effect on step-by-step foot placement and metabolic rate (measured using indirect calorimetry) were quantified. The length and width of each step was estimated from the instantaneous COP under each foot at corresponding points during the gait cycle. The step distances were used to calculate means and RMS variabilities for each trial. We predicted high sensitivity of step width variability to M-L visual perturbations and a corresponding increase in rate of metabolic energy expenditure.
Continuous perturbations were applied using sum-of-sines pseudorandom waveforms, presented as medio-lateral (M-L) or fore-aft (F-A) motions of the visual field. The waveforms were composed of three sinusoidal frequencies (0.135, 0.250, and 0.442 Hz), with amplitudes scaled such that the middle frequency [previously used by 12] had twice the amplitude of the other two. We report the total amplitude for each trial as the summed amplitudes of the sinusoidal components. Both directions of perturbation were also applied as translational and rotational motions, to provide a wide range of perturbations. The translational motions were in the horizontal plane, whereas rotational motions simulated rotation about the ankles in the frontal plane and sagittal plane, respectively. For sake of comparison, amplitudes were quantified in terms of the arc length of motion.
Subjects were exposed to continuous perturbations of the visual flow in a total of ten randomized trials lasting 7 minutes each. These consisted of four translational perturbation trials, four rotational perturbation trials, and two control trials with no perturbations. The translational and rotational perturbation trials each consisted of perturbations with arc length amplitudes of 0.20 and 0.35 (expressed as fraction of leg length) in both the M-L and F-A directions.
During each trial, we measured step-by-step foot placement and the rate of metabolic energy expenditure. We recorded instantaneous center-of-pressure (COP) from the instrumented treadmill, sampled at 1200 Hz and low-pass filtered with a 25 Hz cut-off frequency using a fourth order, zero-phase-shift Butterworth filter. Volume flow rate of oxygen and carbon dioxide were measured from a respirometry system (Oxycon Mobile, Viasys Healthcare). Metabolic power was determined using standard equations [14], subtracting the expenditure for normal standing (111.96 ± 13.17 W, mean ± s.d., recorded in a separate trial) to yield net metabolic rate for each condition. To allow subjects to reach steady-state, trials lasted 7 minutes each, but using only the last 3 minutes of data for analysis. We quantified four step parameters for walking: mean step length, mean step width, root-mean-square (RMS) step length variability, and RMS step width variability. Step length and step width were estimated from the instantaneous COP under each foot at corresponding points during the beginning of each leg’s single support period [12]. The step distances were used to calculate means and RMS variabilities for all steps in each trial. RMS measurements were computed for each leg separately and then averaged to produce one measure per trial.
All data were non-dimensionalized using each subject’s leg length L, body mass M, and the gravitational constant g as base units. Length measurements were normalized by L, and power measurements were normalized by Mg1.5L0.5, with an average normalization factor of 2292 W. We report data in non-dimensional terms as well as more familiar SI units for ease of comparison.
There were two main expectations to be tested. The first was that energy expenditure would be greater than normal for conditions with increased step variability. We therefore performed paired t-tests comparing each perturbation against the control condition in terms of step width and length variability and net metabolic rate. Previous results suggested that M-L perturbations would have the largest effects on step variability [12], and so we primarily expected a significant energetic difference for the M-L perturbations. The second expectation was that energy expenditure would increase continuously with step variability, regardless of discrete perturbation conditions. A previous dynamic walking model revealed a single mode of instability [19], suggesting that different perturbations might excite a single active feedback mechanism. We therefore performed linear regression between net metabolic rate and step variabilities, with the latter treated as a continuous independent variable regardless of perturbation condition. We tested for a significant slope in that regression, for both step variabilities and means. All statistical tests were performed with a maximum Type I error rate of 0.05.
RESULTS
We found that visual perturbations caused changes in stepping that resulted in increased energy expenditure. The greatest effects on step variability were induced by M-L rotational perturbations, with an accompanying increase in energy expenditure. In terms of a continuous range of step variabilities, all perturbations contributed to a single linear proportionality between energy expenditure and step variability. But visual perturbations generally led to simultaneous changes in multiple step measures, so that this proportionality could be attributed more to a linear combination of step parameters rather than an isolated effect. All changes were observed relative to a baseline for normal walking: Subjects walked with a mean step length 0.686 ± 0.047 and step width 0.125 ± 0.023 (mean ± s.d., as fraction of leg length L), and respective RMS variabilities 0.018 ± 0.004 and 0.028 ± 0.007. The net metabolic rate was 0.11 ± 0.02 (dimensionless; equivalent to 3.3 ± 0.5 W/kg). Below we examine the specific changes in step variability and energy expenditure, as well as the relationships between the two.
Visual perturbations resulted in changes mainly to the M-L aspects of walking (Table 1). Comparing discrete conditions, significant effects were observed in mean step width and in step width variability (P = 0.012 and 1.4e-8 respectively, repeated measures ANOVA), but not in step length and step length variability (P = 0.79 and 0.59 respectively). Post-hoc tests revealed significant effects only for M-L perturbations, and only in step width variability (P < 0.05, T-test with Holm-Sidak correction). The greatest effects were for rotational M-L perturbations at the larger amplitude (Fig. 2), which caused an increase of 65% in step width variability (P = 0.0062), 20% in mean step width (P = 0.014), and 5.9% in net metabolic rate (P = 0.015) compared to normal. There were statistically insignificant changes of −1% in mean step length (P = 0.17) and 31% in step length variability (P = 0.12).
Table 1.
Step placement and metabolic cost values across visual perturbation conditions. Data are reported as mean ± standard deviation, with lengths given in units of leg length, L. Asterisk (*) denotes statistical significance (P < 0.05) relative to the control condition. Perturbation conditions refer to fore-aft (F-A) and medio-lateral (M-L) directions, translational (T) and rotational (R) motions, and maximum amplitudes of 0.20 and 0.35 L.
| Perturbation | Step length mean (L) |
Step width mean (L) |
Step length RMS (L) |
Step width RMS (L) |
Net metabolic rate (Mg1.5L0.5) |
|---|---|---|---|---|---|
| Control | 0.686 ± 0.047 | 0.125 ± 0.023 | 0.018 ± 0.004 | 0.028 ± 0.007 | 0.109 ± 0.017 |
| F-A T 0.20 | 0.681 ± 0.047 | 0.120 ± 0.033 | 0.019 ± 0.005 | 0.032 ± 0.008 | 0.102 ± 0.012 |
| F-A T 0.35 | 0.686 ± 0.045 | 0.123 ± 0.026 | 0.020 ± 0.008 | 0.031 ± 0.008 | 0.108 ± 0.017 |
| F-A T 0.20 | 0.682 ± 0.048 | 0.116 ± 0.028 | 0.017 ± 0.004 | 0.032 ± 0.008 | 0.105 ± 0.012 |
| F-A R 0.35 | 0.690 ± 0.043 | 0.125 ± 0.027 | 0.020 ± 0.007 | 0.033 ± 0.006 | 0.108 ± 0.018 |
| M-L T 0.20 | 0.686 ± 0.041 | 0.132 ± 0.036 | 0.022 ± 0.011 | 0.042 ± 0.011* | 0.109 ± 0.019 |
| M-L T 0.35 | 0.682 ± 0.049 | 0.129 ± 0.032 | 0.019 ± 0.004 | 0.044 ± 0.012* | 0.109 ± 0.018 |
| M-L R 0.20 | 0.684 ± 0.045 | 0.135 ± 0.039 | 0.021 ± 0.006 | 0.043 ± 0.012* | 0.111 ± 0.024 |
| M-L R 0.35 | 0.679 ± 0.040 | 0.149 ± 0.040* | 0.023 ± 0.012 | 0.046 ± 0.019* | 0.115 ± 0.022* |
Figure. 2.

Effect of medio-lateral (M-L) perturbations to the visual field on walking. Shown are mean step length, mean step width, RMS step length variability, and RMS step width variability (all shown as fraction of leg length L), and net metabolic rate (in both W/kg and dimensionless units). Comparisons are for the normal control condition without visual perturbations, and walking with translational M-L perturbations at arc length amplitude of 0.35 L (left and right bars, respectively). The M-L perturbations caused a significant increase in only three measures (asterisk * denotes P < 0.05), mean step width, RMS step width and net metabolic rate (20% increase, 65% increase, and 5.9% increase, respectively).
Treating step parameters as continuous variables, they were found to be linearly dependent on each other (Fig. 3). Because step width variability was most affected by perturbations, we treated it as the independent variable in linear regressions, with the other parameters as dependent variables. Each regression was tested for a single linear dependency or slope (e.g. between step width and step width variability) across all subjects, with each subject assigned a separate offset to account for individual gait characteristics. All three regressions yielded significant dependencies: Step length was negatively correlated with step width variability, with a slope of −0.306 ± 0.19 (mean ± CI, 95% confidence interval; P = 1.8e-5, R2 = 0.18). Step width was positively correlated with step width variability, with slope 0.712 ± 0.326 (P = 2.1e-8, R2 = 0.29). Step length variability was positively correlated with step width variability, with slope 0.268 ± 0.123 (P = 2.5e-8, R2 = 0.28).
Figure 3.

Linear dependence between step parameters across all conditions. (A) Mean step length, (B) mean step width, and (C) RMS step length variability are plotted against RMS step width variability for all conditions. Each symbol denotes a different condition, and each color denotes a different subject (N = 11). Dependence was tested using linear regression with a single slope, but with a separate offset for each subject; plot shows data with offsets averaged together. All step parameters were found to be linearly dependent, regardless of perturbation type (asterisk * denotes P < 0.05). (Note that step width variability is plotted on the horizontal axis to demonstrate linear dependence, but is not an independent variable.)
We also observed a modest linear relationship between step parameters and energy expenditure (Fig. 4). Again treating step width variability as the independent variable, net metabolic rate increased with a slope of 0.153 ± 0.092 (P = 0.0014, R2 = 0.11). And because of the linear relationship between all step measures, energy expenditure was also linearly correlated with the other measures, with slopes of −0.081 ± 0.027 for step length (P = 3.2e-8, R2 = 0.28), 0.122 ± 0.034 for step width (P = 2.3e-10, R2 = 0.36), and 0.220 ± 0.156 for step length variability (P = 0.0062, R2 = 0.08). These correlations do not, however, indicate independent relationships. To characterize the degree of dependency, we performed a step-wise, partial least squares regression with all four step parameters as possible regressors. This yielded R2 of 0.347 for one principal component, and 0.383 for four. A single linear combination of parameters then explains only 3.6% less of the overall variance than all of them together. The four step parameters were therefore largely linearly dependent on each other regardless of perturbation type.
Figure. 4.

Energetic cost of walking as a function of step parameters, across all conditions. Net metabolic rate is plotted against (A) mean step length, (B) mean step width, (C) RMS step width variability, and (D) RMS step length variability, for all perturbation trials. Each symbol denotes a different condition, and each color denotes a different subject (N = 11). Plot shows linear regression fit; separate offsets for each subject are averaged together. Although each parameter could partially explain changes in metabolic rate (asterisk * denotes P < 0.05), linear dependence between step parameters (see Fig. 3) suggests that perturbations largely caused changes in a single linear combination of step parameters, which induced a single effect on energy expenditure.
DISCUSSION
We had sought to test whether greater step variability, induced through perturbations to the visual field, result in greater energy expenditure. Indeed, the most substantial observation was 65% greater step variability (rotational M-L perturbation) as a result of visual perturbations, accompanied by a 5.9% increase in energy expenditure. We attribute much of the change in energy expenditure to the variability, consistent with our hypothesis.
It is also possible that energy expenditure was affected by mean step parameters, because steady deviations from optimum would also be expected to cost energy. Considering all step parameters as continuous variables, mean step width increased with step width variability, and mean step length actually decreased. We suspect that changes in mean step length exacted little cost, because it changed by an insignificant 1% in the condition (rotational M-L perturbation) that caused energy expenditure to change the most. By contrast, mean step width increased by a more significant 20%. We previously observed energy expenditure to increase the square of step width [14]. Applying that relationship to the greater step width observed here yields an estimated increase of slightly less than 2%, or about one-third of the total increase in energy expenditure (again for rotational M-L perturbation). Energy expenditure therefore appears to have been more affected by step width variability. This conclusion must, however, be considered tentative, because the observed increase in energy expenditure was correlated to a linear dependence in all step parameters: step width and length variabilities and their means.
This raises the question of why step parameters should vary together at all. It is not unexpected for step length variability to be related to step width variability. A dynamic walking model [1, 19] suggests that they should have a small degree of coupling (e.g. slightly shorter steps should also be slightly wider) for active control stability, and there might also be some biomechanical coupling [20]. We have no mechanistic prediction for the change in mean steps, but it is possible that humans select wider steps in response to increased gait variability to maintain a relatively constant margin of safety [15, 21-23].
Our results may be compared with previous studies. The multiple effects of visual perturbations on step parameters are consistent with our own previous observations [12]. Several other studies have applied external lateral stabilization during treadmill walking [7, 15, 16] through elastic cords supporting the person laterally, and found decreased step width and length variability, decreased step width, and decreased energy expenditure. The present study differs from lateral stabilization in applying no forces to the person and in amplifying variability, yet yields quite consistent results. This suggests that step parameters and their energetic cost are coupled, due to active control of balance during walking and deviations from an optimum gait.
This study is subject to several limitations. As discussed above, visual perturbations appear to lead to coupled changes to steady-state gait. This makes it difficult to distinguish the relative metabolic costs of active foot placement vs. non-optimal steps, or step variability vs. mean steps. The limited precision of COP measurements may also have limited the resolution with which step parameters could be discriminated. Similarly, the realism of the virtual reality display produces an imperfect illusion of self-motion and therefore limits the ability to induce step variability related to balance. But these effects would tend to diminish the differences observed here, suggesting that the overall results are not due to experimental errors.
Our findings may have ramifications for other subject groups. We have previously observed healthy older adults to expend 26% more net metabolic energy than younger adults [7]. Subjects take wider and more variable steps with age [3], and that may explain part of their increased energy expenditure. The metabolic sensitivity to gait variability may also be higher in older adults for whom active balance requires greater attentional resources [24]. Hemiplegics also take considerably wider and more variable steps [6, 25] and expend more energy to walk than healthy controls at preferred speed [9]. Our results suggest that changes in step parameters associated with unsteady gait may explain some of the greater energetic cost of walking observed due to age or disability.
We tested the effect of increased step variability on energy expenditure of walking
We induced step variability with visual perturbations and measured metabolic rate
Lateral perturbations caused greatest step variance and a 6% greater metabolic rate
Step variability correlated with energy cost across visual perturbation conditions
Step variability may explain increased cost of walking with age and gait disorders
ACKNOWLEDGEMENTS
This project was supported by the Rackham Graduate Student Research Grant and NIH DC6466.
Footnotes
Publisher's Disclaimer: This is a PDF file of an unedited manuscript that has been accepted for publication. As a service to our customers we are providing this early version of the manuscript. The manuscript will undergo copyediting, typesetting, and review of the resulting proof before it is published in its final citable form. Please note that during the production process errors may be discovered which could affect the content, and all legal disclaimers that apply to the journal pertain.
CONFLICT OF INTEREST STATEMENT
None.
REFERENCES
- [1].Bauby CE, Kuo AD. Active control of lateral balance in human walking. J Biomech. 2000;33:1433–40. doi: 10.1016/s0021-9290(00)00101-9. [DOI] [PubMed] [Google Scholar]
- [2].Owings TM, Grabiner MD. Step width variability, but not step length variability or step time variability, discriminates gait of healthy young and older adults during treadmill locomotion. J Biomech. 2004;37:935–8. doi: 10.1016/j.jbiomech.2003.11.012. [DOI] [PubMed] [Google Scholar]
- [3].Owings TM, Grabiner MD. Variability of step kinematics in young and older adults. Gait Posture. 2004;20:26–9. doi: 10.1016/S0966-6362(03)00088-2. [DOI] [PubMed] [Google Scholar]
- [4].Gabell A, Nayak US. The effect of age on variability in gait. J Gerontol. 1984;39:662–6. doi: 10.1093/geronj/39.6.662. [DOI] [PubMed] [Google Scholar]
- [5].Hausdorff JM, Rios DA, Edelberg HK. Gait variability and fall risk in community-living older adults: a 1-year prospective study. Arch Phys Med Rehabil. 2001;82:1050–6. doi: 10.1053/apmr.2001.24893. [DOI] [PubMed] [Google Scholar]
- [6].Zverev Y, Adeloye A, Chisi J. Quantitative analysis of gait pattern in hemiparetic patients. East Afr Med J. 2002;79:420–2. doi: 10.4314/eamj.v79i8.8828. [DOI] [PubMed] [Google Scholar]
- [7].Dean JC, Alexander NB, Kuo AD. The effect of lateral stabilization on walking in young and old adults. IEEE Trans Biomed Eng. 2007;54:1919–26. doi: 10.1109/TBME.2007.901031. [DOI] [PubMed] [Google Scholar]
- [8].Ortega JD, Farley CT. Individual limb work does not explain the greater metabolic cost of walking in elderly adults. J Appl Physiol. 2007;00583:2006. doi: 10.1152/japplphysiol.00583.2006. [DOI] [PubMed] [Google Scholar]
- [9].Zamparo P, Francescato MP, De Luca G, Lovati L, di Prampero PE. The energy cost of level walking in patients with hemiplegia. Scand J Med Sci Sports. 1995;5:348–52. doi: 10.1111/j.1600-0838.1995.tb00057.x. [DOI] [PubMed] [Google Scholar]
- [10].van den Hecke A, Malghem C, Renders A, Detrembleur C, Palumbo S, Lejeune TM. Mechanical work, energetic cost, and gait efficiency in children with cerebral palsy. J Pediatr Orthop. 2007;27:643–7. doi: 10.1097/BPO.0b013e318093f4c3. [DOI] [PubMed] [Google Scholar]
- [11].Hurt CP, Rosenblatt N, Crenshaw JR, Grabiner MD. Variation in trunk kinematics influences variation in step width during treadmill walking by older and younger adults. Gait Posture. 2010;31:461–4. doi: 10.1016/j.gaitpost.2010.02.001. [DOI] [PubMed] [Google Scholar]
- [12].O’Connor SM, Kuo AD. Direction-dependent control of balance during walking and standing. J Neurophysiol. 2009;102:1411–9. doi: 10.1152/jn.00131.2009. [DOI] [PMC free article] [PubMed] [Google Scholar]
- [13].Zarrugh MY, Todd FN, Ralston HJ. Optimization of energy expenditure during level walking. Eur J Appl Physiol. 1974;33:293–306. doi: 10.1007/BF00430237. [DOI] [PubMed] [Google Scholar]
- [14].Donelan JM, Kram R, Kuo AD. Mechanical and metabolic determinants of the preferred step width in human walking. Proc R Soc Lond Ser B-Biol Sci. 2001;268:1985–92. doi: 10.1098/rspb.2001.1761. [DOI] [PMC free article] [PubMed] [Google Scholar]
- [15].Donelan JM, Shipman DW, Kram R, Kuo AD. Mechanical and metabolic requirements for active lateral stabilization in human walking. J Biomech. 2004;37:827–35. doi: 10.1016/j.jbiomech.2003.06.002. [DOI] [PubMed] [Google Scholar]
- [16].Ortega JD, Fehlman LA, Farley CT. Effects of aging and arm swing on the metabolic cost of stability in human walking. J Biomech. 2008;41:3303–8. doi: 10.1016/j.jbiomech.2008.06.039. [DOI] [PMC free article] [PubMed] [Google Scholar]
- [17].Collins SH, Adamczyk PG, Ferris DP, Kuo AD. A simple method for calibrating force plates and force treadmills using an instrumented pole. Gait Posture. 2008 doi: 10.1016/j.gaitpost.2008.06.010. [DOI] [PMC free article] [PubMed] [Google Scholar]
- [18].Warren WH, Kay BA, Yilmaz EH. Visual control of posture during walking: functional specificity. J Exp Psychol Hum Percept Perform. 1996;22:818–38. doi: 10.1037//0096-1523.22.4.818. [DOI] [PubMed] [Google Scholar]
- [19].Kuo AD. Stabilization of lateral motion in passive dynamic walking. International Journal of Robotics Research. 1999;18 [Google Scholar]
- [20].Wisse M, Schwab AL. Skateboards, bicycles, and 3D biped walkers; velocity dependent stability by means of lean-to-yaw coupling. Int J of Robotics Research. 2005;24:417–29. [Google Scholar]
- [21].Rosenblatt NJ, Grabiner MD. Measures of frontal plane stability during treadmill and overground walking. Gait Posture. 2010;31:380–4. doi: 10.1016/j.gaitpost.2010.01.002. [DOI] [PubMed] [Google Scholar]
- [22].Hof AL, van Bockel RM, Schoppen T, Postema K. Control of lateral balance in walking. Experimental findings in normal subjects and above-knee amputees. Gait & Posture. 2007;25:250–8. doi: 10.1016/j.gaitpost.2006.04.013. [DOI] [PubMed] [Google Scholar]
- [23].Hof AL, Gazendam MG, Sinke WE. The condition for dynamic stability. J Biomech. 2005;38:1–8. doi: 10.1016/j.jbiomech.2004.03.025. [DOI] [PubMed] [Google Scholar]
- [24].Lajoie Y, Teasdale N, Bard C, Fleury M. Attentional demands for static and dynamic equilibrium. Experimental brain research Experimentelle Hirnforschung Experimentation cerebrale. 1993;97:139–44. doi: 10.1007/BF00228824. [DOI] [PubMed] [Google Scholar]
- [25].Roerdink M, Lamoth CJ, Kwakkel G, van Wieringen PC, Beek PJ. Gait coordination after stroke: benefits of acoustically paced treadmill walking. Phys Ther. 2007;87:1009–22. doi: 10.2522/ptj.20050394. [DOI] [PubMed] [Google Scholar]