

Abstract
BACKGROUND
Genome-wide association studies (GWAS) have identified over 100 genetic loci for various cancers. However, only one is for endometrial cancer.
METHODS
We conducted a three-stage GWAS including 8,492 endometrial cancer cases and 16,596 controls. After analyzing 585,963 SNPs in 832 cases and 2,682 controls (Stage 1) from the Shanghai Endometrial Cancer Genetics Study, we selected the top 106 SNPs for in silico replication among 1,265 cases and 5,190 controls from the Australian/British Endometrial Cancer GWAS (Stage 2). Nine SNPs showed results consistent in direction with Stage 1 with P<0.1. These 9 SNPs were investigated among 459 cases and 558 controls (Stage 3a) and 6 SNPs showed a direction of association consistent with Stages 1 and 2. These 6 SNPs, plus 2 additional SNPs selected based on linkage disequilibrium (LD) and P values in Stage 2, were investigated among 5,936 cases and 8,166 controls from an additional 11 studies (Stage 3b).
RESULTS
SNP rs1202524, near the CAPN9 gene on chromosome 1q42.2, showed a consistent association with endometrial cancer risk across all three stages, with odds ratios (OR) of 1.09 (95% CI: 1.03–1.16) for the A/G genotype and 1.17 (95% CI: 1.05–1.30) for the G/G genotype (P=1.6 × 10⁻⁴ in combined analyses of all samples). The association was stronger when limited to the endometrioid subtype, with ORs (95% CI) of 1.11 (1.04–1.18) and 1.21 (1.08–1.35), respectively (P=2.4 × 10⁻⁵).
CONCLUSIONS
Chromosome 1q42.2 may host an endometrial cancer susceptibility locus.
IMPACT
This study identified a potential genetic locus for endometrial cancer risk.
INTRODUCTION
Endometrial cancer is the second most common gynecologic cancer in the world (1). Early age at menarche, late age at menopause, nulliparity, obesity, use of estrogen-alone hormone-replacement therapy, use of tamoxifen, and family history of endometrial, breast, ovarian, or colorectal cancer are established risk factors for endometrial cancer (2). Over the past 10 years, a number of studies have reported that certain genetic variants are associated with endometrial cancer risk, including polymorphisms in genes involved in estrogen metabolism (3). However, very few of these associations have been confirmed (4–7). Given that almost all previous studies used the candidate-gene approach, in which only a limited number of genetic variants are investigated, and the choice of genes is driven by our limited knowledge of cancer biology, more comprehensive genetic investigations of endometrial cancer risk are urgently needed. Genome-wide association studies (GWAS) have successfully identified more than 100 genetic loci at P<5×10⁻⁸ for common cancers (8). Many GWAS-identified markers are located in genes or non-gene regions that had not previously been associated with cancer susceptibility. Very recently, the first endometrial cancer GWAS, conducted by Spurdle et al. (9), reported a novel endometrial cancer susceptibility marker, rs4430796. This marker is located on chromosome 17q, very close to the HNF1B gene, and has also been associated with an increased risk of prostate cancer (10, 11) and decreased risk of type 2 diabetes (12). In order to identify additional endometrial cancer risk variants, we conducted a three-stage GWAS among 24,071 endometrial cancer patients and controls.
MATERIALS AND METHODS
An overview of the study design, including study stage, study population, and SNP selection, are presented in Figure 1.
Figure 1.

Overview of the study design.
Study population
Fourteen studies contributed a total of 8,492 endometrial cancer cases and 16,596 controls to this study. Detailed descriptions of participating studies are included in the Supplement. The discovery stage (Stage 1) was conducted among participants of the Shanghai Endometrial Cancer Genetics Study (SECGS) and included 832 endometrial cancer cases from the Shanghai Endometrial Cancer Study (SECS) and 2,682 controls from the Shanghai Breast Cancer Study (SBCS) and Shanghai Women’s Health Study (SWHS). Data for Stage 2 were extracted from the Australian/British Endometrial Cancer GWAS (9), which included 599 cases from the Australian National Endometrial Cancer Study (ANECS), 666 cases from the Study of Epidemiology and Risk Factors in Cancer Heredity (SEARCH), and 5,190 controls from the Wellcome Trust Case-Control Consortium (WTCCC). All cases in Stage 2 were endometrioid subtype cases. Data for Stage 3a came from the Polish Endometrial Cancer Study (PECS) and included 459 cases and 558 controls. The final replication stage (Stage 3b) included 5,936 cases and 8,166 controls from the Bavarian Endometrial Cancer Study (BECS), Connecticut Endometrial Cancer Study (CECS), Hannover-Almaty Endometrial Cancer Study (HAECS), Hawaii Endometrial Cancer Study (HECS), Hannover-Jena Endometrial Cancer Study (HJECS), Leuven Endometrial Cancer Study (LES), Molecular Markers in Treatment of Endometrial Cancer (MoMaTEC), National Study of Endometrial Cancer Genetics (NSECG), additional samples from SEARCH that were not included in Stage 2, additional samples from ANECS that were not included in Stage 2 analyzed together with Australian cases recruited into the Newcastle Endometrial Cancer Study (NECS) and Australian controls recruited via the Australian Red Cross Blood Service (ARCBS), and additional samples from the SECGS (SECGS-II) that were not included in Stage 1 (Supplementary Table S1).
The study protocol was approved by the institutional review boards at Vanderbilt University Medical Center and each of the collaborating institutes. Informed consent was obtained from all participants.
Stage 1 genotyping
Genotyping was conducted using the Affymetrix Genome-Wide Human SNP Array 6.0. All genotyping protocols and quality control (QC) procedures were identical to those used in our breast cancer GWAS (13). We included one negative and three positive QC samples from Coriell Cell Repositories (14) in each of the 96-well plates for GWAS genotyping. The average concordance rate among QC samples was 99.85% with a median value of 100%. The sex of all study samples was confirmed to be female. Multidimensional scaling analyses of the pooled data set, which included data from 210 unrelated HapMap samples and Stage 1 of the present study, showed that all study participants clustered closely with HapMap Asians. All close relatives with a pairwise proportion of identity by descent (IBD) estimate of PI_HAT≥0.25 were excluded. SNPs that fell into any of the following categories were excluded: 1) minor allele frequency (MAF) <5%; 2) call rate <95%; 3) Hardy-Weinberg equilibrium (HWE) test P<1.0 × 10⁻⁴; 4) concordance rate <95% among QC samples; 5) significantly different missing rates for cases and controls (P<1.0 × 10⁻⁴). After these exclusion criteria were applied, 585,963 SNPs remained for the Stage 1 analyses.
Stage 2 SNP selection and genotyping
We selected 106 SNPs for in silico replication in Stage 2 according to the following criteria: 1) minor allele frequency (MAF) ≥10%; 2) P<0.001 in Stage 1; 3) high genotyping quality, as indicated by very clear genotyping clusters; 4) included in the Illumina 610K array (Stage 2 samples were genotyped using this platform). For SNPs not included in this array, we used a surrogate SNP in LD (r2≥0.5) with the originally selected SNP based on HapMap Caucasian data. Additionally, if multiple SNPs in the same region met the above criteria, a SNP with a high functional score was chosen. The functional score was derived from SNP factors available through the NIEHS SNP Function Prediction (FuncPred) tool (15). Potential functional SNPs are those causing amino acid changes, alterations in splicing regulation, stop codons, structural changes, changes in transcription factor binding sites, and changes in miRNA binding site. Last, we confirmed that there was no LD between the selected SNPs (r2<0.2).
Stage 2 genotyping
Methods have been described in detail elsewhere (9). In brief, endometrioid endometrial cancer subtype cases were genotyped using the Illumina Human 610K array; control data were extracted for these 610K SNPs from existing Illumina 1.2M genome-wide scan data for the WTCCC2 (16). Of the top 106 SNPs selected from the current Stage 1, data were available for 99 SNPs in the Stage 2 dataset, including 27 directly genotyped SNPs and 72 surrogate SNPs (Supplementary Table S2; imputation data were not available at the time of study implementation). Surrogate SNPs were selected based on the following criteria: 1) data available in Stage 2; 2) in LD with the index SNP (r2>0.5 in Caucasians); 3) if multiple SNPs were in LD with the index SNP, the SNP with the strongest LD with the index SNP was selected; 4) if multiple SNPs in similar LD with the index SNP in Caucasians, the SNP with the strongest LD in Asians was selected.
Stage 3 SNP selection and genotyping
Among the 99 SNPs investigated in Stage 2, 9 SNPs showed a direction of association consistent with Stage 1 and were further investigated for replication in Stage 3a. Stage 3a data were extracted from the GWAS dataset genotyped by Illumina 660W-Quad from the PECS. We used directly genotyped data for four SNPs and used surrogates for the other 5 SNPs (Supplementary Table S2) in an approach similar to that used for Stage 2. Among these 9 SNPs, 6 SNPs (rs1202529, rs17556883, rs10795561, rs11663212, rs12208947, and rs190262) showed a direction of association consistent with Stages 1 and 2 and were selected for genotyping in Stage 3b samples. After careful reevaluation of these 6 loci in the Australian/British GWAS data (9), rs9397178 was more significant than the index SNP rs12208947 (P=0.009 and 0.075, respectively). These two SNPs are in strong LD in Asians (r2=0.93) and moderate LD in Caucasians (r2=0.43) based on HapMap data. Similarly, the association of SNP rs1202524 was slightly more significant than rs3828128, a proxy for the index SNP rs1202529 (P=0.02 and 0.045, respectively). Thus, these two SNPs, rs9397178 and rs1202524, were also included in the Stage 3b validation.
Stage 3b genotyping was conducted using the Sequenom iPLEX MassArray or Taqman platforms. Genotyping assay protocols were developed and validated at the Vanderbilt Molecular Epidemiology Laboratory. TaqMan genotyping assay reagents were provided to investigators of 3 studies, HAECS, HJCES, and SEARCH. SNP rs450712 was genotyped to serve as a surrogate for the index SNP rs190262 (r2=1.00 in both Asians and Caucasians based on HapMap data) for Taqman genotyping. Sequenom assay reagents were provided to 5 studies, including the ANECS, BECS, MoMaTEC, and NSECG (genotyped in Brisbane) and LES (genotyped in Leuven). Samples from the SECGS-II, CECS, and HECS were genotyped using Sequenom at the Vanderbilt Molecular Epidemiology Laboratory. Another 435 cases from the SECGS-II were genotyped using the same Sequenom SNP pool at Fudan University in Shanghai, China. All studies complied with QC standards by including 2 or more non-DNA template controls per 384-well assay plate, assaying 2% or more duplicate samples, and achieving a genotyping call rate of >95% and concordance rate between duplicate samples of ≥95% for each SNP assay. Studies with HWE P<1 × 10⁻⁴ were automatically excluded from the association analysis. Data for NSECG controls were drawn from the UK1/CORGI colorectal cancer GWAS, which used the Illumina 550K platform (17). SNPs not on the Illumina 550K were imputed using IMPUTE for the NSECG controls.
Statistical analyses
In Stage 1, PLINK (version 1.06) was used to analyze the genome-wide data. A set of 4,305 SNPs with a MAF ≥35% and a distance of ≥100 kb between two adjacent SNPs were selected to evaluate the population structure. The inflation factor λ was estimated to be 1.045, suggesting that any population substructure, if present, should not have any appreciable effect on the results.
Associations between SNPs and endometrial cancer risk were assessed using odds ratios (ORs) and 95% confidence intervals (CIs) derived from logistic regression models. ORs were estimated for heterozygotes and homozygotes for the variant allele compared with homozygotes for the common allele in Stage 1. ORs were also estimated for the variant allele based on a log-additive model. Meta-analyses for Stages 2 and 3 were performed using a weighted average method with the inverse-variance weights, w=1/se2. An overall z-statistic and P value was calculated from the weighted average of the individual statistics. All P values presented are based on two-tailed tests.
RESULTS
In Stage 1 which was conducted in the Chinese population, multiple genomic locations were revealed as potentially related to endometrial cancer risk (Supplementary Figure S1), and the observed number of SNPs with a small P-value was larger than that expected by chance (Supplementary Figure S2). P values presented in Supplementary Figure S1 are derived from trend tests using logistic regression (df =1).
Of the 99 SNPs selected for Stage 2 in silico replication using data from the Australia/British GWAS (9), 13 SNPs had an association with endometrial cancer (P<0.1) and of these SNPs, 9 had the same direction of association as in Stage 1 (rs10795561, rs11663212, rs1202529, rs12208947, rs12516561, rs17556883, rs190262, rs2876846, and rs4729568) (Supplementary Table S3). These 9 SNPs were further investigated for replication in the PECS (Stage 3a). Of these, 6 SNPs (rs10795561, rs11663212, rs1202529, rs12208947, rs17556883, and rs190262) had the same direction of association as in Stages 1 and 2 (Supplementary Table S3). After further evaluation of these 6 loci in the Stage 2 data (9), we found that the association for surrogate SNPs rs9397178 and rs1202524 were more significant than the index SNPs rs12208947 and rs1202529. Thus, the two surrogate SNPs, rs9397178 and rs1202524, were also included in the Stage 3b validation.
Among the 8 SNPs included in the Stage 3b replication, an association was observed for rs1202524 (P=0.072). The ORs (95% CI) were 1.06 (0.98–1.13) for the A/G genotype and 1.10 (0.97–1.25) for G/G genotype versus A/A (Table 1). Meta-analyses of all studies combined resulted in a P value of 1.6 × 10⁻⁴. Restricting analyses to type I endometrial cancer (endometrioid) cases (7,558 of the 8,468 cases genotyped for this SNP) strengthened the association, with ORs (95% CI) of 1.11 (1.04–1.18) for the A/G genotype and 1.21 (1.08–1.35) for the G/G genotype (P=2.4 × 10⁻⁵; Table 2). Analyses stratified by ethnicity showed that this SNP was associated with ORs of 1.22 (1.05–1.42) for the A/G genotype and 1.60 (0.86–2.96) for the G/G genotype in Asians and 1.07 (1.00–1.15) for the A/G genotype and 1.18 (1.06–1.32) for the G/G genotype among European-ancestry participants. Similar results were observed for SNP rs1202529, which is in strong LD with rs1202524 (r2=1.00 in both Asian and Caucasian HapMap data), with P values of 2.4 × 10⁻⁴ and 3.2 × 10⁻⁵, respectively, among all women and limited to type I cases (Table 2). Additional adjustment for BMI did not change the results appreciably (data not shown). None of the other SNPs were associated with endometrial cancer risk in Stage 3b (Supplementary Table S4).
Table 1.
Association results for the 8 SNPs included in all 3 Stages of the study
| SNP | Effect/reference allele | Study | N | Frequency | OR (95% CI) | P | |||
|---|---|---|---|---|---|---|---|---|---|
|
| |||||||||
| Cases | Controls | Cases | Controls | Heterozygotes | Homozygotes | ||||
| rs1202524 | G/A | Stage 1 | 832 | 2682 | 0.12 | 0.09 | 1.47(1.21–1.78) | 2.25(0.97–5.21) | 2.3E-05 |
| Stage 2 | 1265 | 5189 | 0.35 | 0.32 | 1.07(0.94–1.22) | 1.31(1.07–1.59) | 1.4E-02 | ||
| Stage 3 | 6371 | 8686 | 0.28 | 0.26 | 1.06(0.98–1.13) | 1.10(0.97–1.25) | 7.2E-02 | ||
| Combined | 8468 | 16557 | 0.27 | 0.25 | 1.09(1.03–1.16) | 1.17(1.05–1.30) | 1.6E-04 | ||
| rs1202529 | G/C | Stage 1 | 824 | 2668 | 0.12 | 0.09 | 1.45(1.20–1.76) | 1.97(0.87–4.48) | 5.5E-05 |
| Stage 2 | 1265 | 5189 | 0.35 | 0.32 | 1.07(0.94–1.22) | 1.31(1.07–1.59) | 1.4E-02 | ||
| Stage 3 | 6366 | 8684 | 0.28 | 0.26 | 1.06(0.99–1.14) | 1.09(0.96–1.23) | 8.1E-02 | ||
| Combined | 8455 | 16541 | 0.27 | 0.25 | 1.10(1.03–1.16) | 1.16(1.04–1.29) | 2.4E-04 | ||
| rs17556883 | T/C | Stage 1 | 832 | 2680 | 0.35 | 0.40 | 0.77(0.65–0.91) | 0.67(0.52–0.85) | 1.9E-04 |
| Stage 2 | 1264 | 5188 | 0.54 | 0.56 | 0.88(0.75–1.03) | 0.83(0.70–1.00) | 5.3E-02 | ||
| Stage 3 | 6361 | 8663 | 0.52 | 0.52 | 0.94(0.87–1.03) | 0.96(0.87–1.06) | 3.3E-01 | ||
| Combined | 8457 | 16531 | 0.51 | 0.52 | 0.90(0.84–0.96) | 0.90(0.83–0.97) | 3.1E-03 | ||
| rs9397178 | G/A | Stage 1 | 832 | 2682 | 0.41 | 0.37 | 1.16(0.98–1.38) | 1.41(1.12–1.78) | 3.6E-03 |
| Stage 2 | 1265 | 5189 | 0.09 | 0.07 | 1.14(0.96–1.36) | 2.45(1.37–4.40) | 8.1E-03 | ||
| Stage 3 | 6369 | 8683 | 0.13 | 0.15 | 0.97(0.88–1.06) | 1.07(0.87–1.33) | 8.8E-01 | ||
| Combined | 8466 | 16554 | 0.15 | 0.16 | 1.03(0.96–1.10) | 1.28(1.10–1.49) | 1.9E-02 | ||
| rs12208947 | A/G | Stage 1 | 831 | 2534 | 0.41 | 0.37 | 1.16(0.97–1.38) | 1.48(1.17–1.88) | 1.3E-03 |
| Stage 2 | 1265 | 5187 | 0.15 | 0.13 | 1.09(0.94–1.26) | 1.34(0.89–2.04) | 1.0E-01 | ||
| Stage 3 | 6367 | 8684 | 0.17 | 0.19 | 0.96(0.89–1.04) | 0.97(0.80–1.16) | 3.0E-01 | ||
| Combined | 8463 | 16405 | 0.19 | 0.20 | 1.01(0.95–1.08) | 1.15(1.01–1.32) | 2.0E-01 | ||
| rs11663212 | A/C | Stage 1 | 832 | 2679 | 0.30 | 0.25 | 1.34(1.14–1.57) | 1.42(1.03–1.94) | 3.0E-04 |
| Stage 2 | 1265 | 5190 | 0.12 | 0.11 | 1.17(1.00–1.36) | 0.92(0.50–1.68) | 1.0E-01 | ||
| Stage 3 | 6358 | 8657 | 0.14 | 0.14 | 1.02(0.94–1.11) | 1.08(0.86–1.36) | 4.2E-01 | ||
| Combined | 8455 | 16526 | 0.15 | 0.15 | 1.10(1.03–1.17) | 1.16(0.97–1.39) | 3.7E-03 | ||
| rs10795561 | T/A | Stage 1 | 832 | 2681 | 0.29 | 0.26 | 1.16(0.99–1.37) | 1.55(1.16–2.08) | 2.1E-03 |
| Stage 2 | 1145 | 4705 | 0.36 | 0.34 | 1.12(0.98–1.29) | 1.16(0.94–1.44) | 7.4E-02 | ||
| Stage 3 | 6353 | 8653 | 0.34 | 0.34 | 1.00(0.93–1.08) | 1.08(0.97–1.21) | 3.2E-01 | ||
| Combined | 8330 | 16039 | 0.34 | 0.33 | 1.04(0.98–1.11) | 1.14(1.04–1.25) | 8.2E-03 | ||
| rs190262 | T/G | Stage 1 | 832 | 2681 | 0.16 | 0.13 | 1.25(1.05–1.50) | 1.84(1.12–3.01) | 1.2E-03 |
| Stage 2 | 1265 | 5190 | 0.13 | 0.11 | 1.19(1.02–1.38) | 1.30(0.81–2.11) | 1.5E-02 | ||
| Stage 3 | 6356 | 8663 | 0.11 | 0.12 | 0.93(0.86–1.01) | 1.06(0.79–1.42) | 2.1E-01 | ||
| Combined | 8453 | 16534 | 0.12 | 0.12 | 1.02(0.96–1.09) | 1.24(0.99–1.55) | 1.7E-01 | ||
Table 2.
Association of rs1202524 and 1202529 with Type I endometrial cancer, for all participants and by ethnicity
| Population | SNP | N | Frequency | OR (95% CI) | P | |||
|---|---|---|---|---|---|---|---|---|
|
| ||||||||
| Cases | Controls | Cases | Controls | Heterzygotes | Homozygotes | |||
| All women: Type I endometrial cancer cases vs controls | ||||||||
| rs1202524 | 7558 | 16557 | 0.27 | 0.25 | 1.11(1.04– 1.18) | 1.21(1.08– 1.35) | 2.4E-05 | |
| rs1202529 | 7546 | 16541 | 0.27 | 0.25 | 1.11(1.04– 1.18) | 1.19(1.07– 1.33) | 3.2E-05 | |
| Asian women: Type I endometrial cancer cases vs controls | ||||||||
| rs1202524 | 1689 | 3829 | 0.11 | 0.10 | 1.22(1.05– 1.42) | 1.60(0.86– 2.96) | 3.0E-03 | |
| rs1202529 | 1681 | 3812 | 0.11 | 0.10 | 1.22(1.05– 1.42) | 1.45(0.78– 2.69) | 4.6E-03 | |
| European-ancestry women: Type I endometrial cancer cases vs controls | ||||||||
| rs1202524 | 6646 | 11797 | 0.32 | 0.31 | 1.07(1.00–1.15) | 1.18(1.06–1.32) | 1.7E-03 | |
| rs1202529 | 6641 | 11796 | 0.32 | 0.31 | 1.07(1.00–1.15) | 1.17(1.05–1.31) | 2.2E-03 | |
DISCUSSION
In this three-stage GWAS of endometrial cancer conducted among 8,492 cases and 16,596 controls, we found that SNPs rs1202524 and rs1202529, which are in strong LD, were associated with endometrial cancer risk among both Chinese women and women of European ancestry. Although neither association reached the conventionally used GWAS significance level of 5 × 10⁻⁸, the associations were consistent across 9 of 14 contributing studies and did not vary by ethnicity. These two SNPs are located on chromosome 1q42.2, approximately 13kb and 17kb downstream of the CAPN9 gene (Figure 2). The CAPN9 gene belongs to the calpain gene family, encoding a ubiquitous, well-conserved family of calcium-dependent, cysteine proteases. Multiple, alternatively spliced transcript variants encoding different isoforms have been found for this gene. A growing body of literature has implicated the role of calpain in various aspects of carcinogenesis, including cell-cycle progression, cellular differentiation, and apoptosis (18). TP53, a substrate of calpains, is known to play an important role in the pathogenesis of various tumors (19). Inhibitors of calpains have a stabilizing effect on TP53 and can increase TP53 levels and reduce tumor growth. It has been reported that calpain may play an important role in the regulation of estrogen receptor (ER) function. Shiba et al. (20, 21) found that calpain activity was significantly higher in breast cancer tissue compared with normal breast tissue, in addition to being higher in ER-positive tumors compared with ER-negative tumors. A very recent study showed that calpain 1, calpain 2, and the inhibitor calpastatin are expressed in endometrial tissue and that endometrial carcinoma has higher expression of calpastatin and calpain 2 than benign endometrial tissue (22). A number of oncogenic and tumor suppressor proteins are substrates of calpain family enzymes, including c-fos, c-jun, p53, the estrogen receptor, and integrin (23). Calpain 9, expressed predominantly in the digestive tract, has been associated with suppression of gastric cancer (19) and is down-regulated in gastric cancer tissue and both differentiated and poorly differentiated cell lines (24, 25). It has been suggested that calpain 9 might act as a tumor suppressor through degradation of oncogenic proteins (15).
Figure 2.
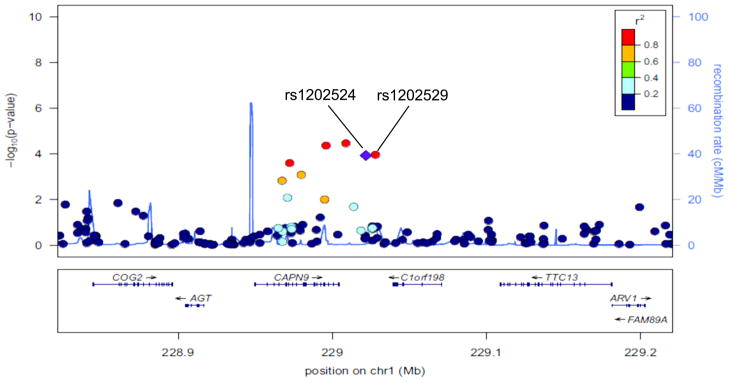
A regional plot of the −log10P-values for SNPs at 1q42.2. The LD is estimated using data from the HapMap Asian population. Also shown are recombination rates in centimorgans (cM) per megabase (Mb) and genes in the region (below) based on the March 2006 UCSC Genome Browser assembly.
There exists limited evidence for the functional significance of SNPs rs1202524 and rs1202529. Vasan et al. (26) found rs1202524 to be associated with left ventricular diastolic dimension (P=0.03). Both rs1202529 and rs1202524 are in LD with two synonymous SNPs in the CAPN9 gene, rs3828126 (r2=0.68/0.57 in CEU/Asian data) and rs2282319 (0.48/0.10). Both synonymous SNPs are predicted to be exon splice enhancers by the ESE finder (27).
To date, only one SNP (rs4430796) has been identified by a GWAS of endometrial cancer (9). This SNP is located in the HNF1B gene on chromosome 17q. The per G allele OR (95% CI) was 0.84 (0.79–0.89; P=7.1×10⁻¹⁰). This SNP was not significantly associated with endometrial cancer among Chinese women based on our stage I data (OR per G allele: 0.97, 95% CI: 0.84–1.12), but the direction of the association was consistent with what has been observed among European-ancestry women.
Several limitations of this study should be noted. First, although the present study is one of the largest epidemiological studies of endometrial cancer, the sample size in the discovery stage is still small and mixed-ethnicity groups were included in the replication study. Unlike the genetic studies of more common cancers, such as the one we conducted on breast cancer (13), conducting a GWAS of endometrial cancer among Chinese populations alone or even among all Asians is currently unfeasible simply due to the rareness of this cancer and the limited amount of epidemiological research conducted on it. Therefore, the validation study had to rely mainly on women of European ancestry. Because the allele frequencies of some SNPs differ across populations and LD patterns of adjacent SNPs also vary considerably by population, underlying differences in the genetic architecture of Asian- and European-ancestry populations could have resulted in false negative results (i.e. failed replication) for some of the 99 SNPs prioritized for replication. Another limitation of this study is that some surrogate SNPs used in the replication stages showed only moderate LD with the index SNPs, which could have reduced the statistical power of the replication study. Nevertheless, finding a consistent association across different populations adds strong evidence for a true association. The lack of direct evidence on the functional significance of the two SNPs near the CAPN9 gene is another limitation. Additional functional studies are needed to understand the nature of these SNP associations. Finally, cases with different subtypes of endometrial cancer were included in the present study, which may have biased the results towards the null. In fact, analyses restricted to women with endometrioid histology resulted in more significant associations with the two top SNPs.
In summary, in this large GWAS of endometrial cancer, we found one potential locus downstream of the CAPN9 gene associated with endometrial cancer risk. Further research on this genetic region, including functional analyses, would shed light on the biological role of CAPN9 in endometrial carcinogenesis.
Supplementary Material
Acknowledgments
Funding and Acknowledgements
The SECS was supported by US PHS grant R01 CA092585 (PI: X.O. Shu). Other studies that contributed to the SECS GWAS were funded by US PHS grants, R01 CA064277, R01 CA090899, and R37 CA070867 (PI: W. Zheng). The SECS GWAS thanks Drs. Wanghong Xu, Fan Jin, and other research staff for their contributions to the field operation, Ms. Regina Courtney for DNA preparation, and Ms. Bethanie Rammer for editorial support in the preparation of this manuscript. The HJECS thanks Dr. Wen Zheng, Prof. Peter Hillemanns, and Prof. Ingo Runnebaum for their support in patient recruitment. The HAECS gratefully acknowledges Prof. Tjoung-Won Park-Simon for her support. The Stage 2 ANECS/SEARCH research was supported by the National Health and Medical Research Council (ID#552402), the Wellcome Trust, and by Cancer Research UK grants C1287/A10118, C490/A1021, C8197/A10865, and C8197/A10123. A.B. Spurdle is an NHMRC Senior Research Fellow. T. O’Mara. is supported by an Australian Postgraduate Award, an Institute of Health and Biomedical Innovation PhD Top-Up, and an Qld Government Smart State PhD Award. D.F. Easton is a Principal Research Fellow of Cancer Research UK. A.M. Dunning is supported by the Joseph Mitchell Trust. I. Tomlinson is supported by Cancer Research UK and the Oxford Comprehensive Biomedical Research Centre. The ANECS/SEARCH study made use of data generated by the Wellcome Trust Case Control Consortium 2, and a full list of the investigators who contributed to the generation of these data is available from the WTCCC website (16). We acknowledge use of DNA from the British 1958 Birth Cohort collection, funded by the Medical Research Council grant G0000934 and the Wellcome Trust grant 068545/Z/02. Funding for this project was provided by the Wellcome Trust under award 085475. P.A. Fasching was partly funded by Dr. Mildred Scheel Stiftung of the Deutsche Krebshilfe (German Cancer Aid). We thank study participants and collaborators, and the research teams involved in design and implementation of the individual studies included (see supplementary text for full list of collaborators and specific acknowledgements). Lose F, Spurdle AB, and O’Mara T represent the ANECS. ANECS gratefully acknowledges the contributions of Study Investigator Penelope Webb and support of recruitment by project grants from the National Health and Medical Research Council of Australia (ID#339435), The Cancer Council Queensland (ID#4196615), and Cancer Council Tasmania (ID#403031 and ID#457636). The Bavarian Endometrial Cancer Study (BECS) was partly funded by the ELAN fund of the University of Erlangen. The Leuven Endometrium Study (LES) was supported by the Verelst Foundation for endometrial cancer. MoMaTEC received financial support from a Helse Vest Grant, the University of Bergen, Melzer Foundation, The Norwegian Cancer Society (Harald Andersens legat), The Research Council of Norway and Haukeland University Hospital. The Newcastle Endometrial Cancer Study (NECS) acknowledges contributions from the University of Newcastle, The NBN Children’s Cancer Research Group, Ms. Jennie Thomas, and the Hunter Medical Research Institute. The National Study of Endometrial Cancer Genetics Group was supported principally by Cancer Research UK and by funds from the Oxford Comprehensive Biomedical Research Centre, with core infrastructure support to the Wellcome Trust Centre for Human Genetics, Oxford provided by grant 075491/Z/04. The Polish Endometrial Cancer Study (PECS) was funded by the intramural research program at the US National Cancer Institute, Division of Cancer Epidemiology and Genetics in the Hormonal and Reproductive Epidemiology Branch. PECS thanks Drs. Montserrat Garcia-Closas and Mark Sherman and the Core Genotyping Facility at the Division of Cancer Epidemiology and Genetics of the National Cancer Institute, USA; Dr. Witold Zatonski of the Department of Cancer Epidemiology and Prevention, The M. Sklodowska-Curie Cancer Center and Institute of Oncology (Warsaw, Poland); Drs. Neonila Szeszenia- Dabrowska and Beata Peplonska of the Nofer Institute of Occupational Medicine (Lodz, Poland); and Pei Chao and Michael Stagner from Information Management Services (Silver Spring, MD, USA), for their valuable contributions to the study. SEARCH is funded by a programme grant from Cancer Research UK [C490/A10124].
Footnotes
Conflict of interests: None
Reference List
- 1.Parkin DM, Bray F, Ferlay J, Pisani P. Global cancer statistics, 2002. CA Cancer J Clin. 2005;55(2):74–108. doi: 10.3322/canjclin.55.2.74. [DOI] [PubMed] [Google Scholar]
- 2.Mueck AO, Seeger H, Rabe T. Hormonal contraception and risk of endometrial cancer: a systematic review. Endocr Relat Cancer. 2010;17(4):R263–R271. doi: 10.1677/ERC-10-0076. [DOI] [PubMed] [Google Scholar]
- 3.Olson SH, Bandera EV, Orlow I. Variants in estrogen biosynthesis genes, sex steroid hormone levels, and endometrial cancer: a HuGE review. Am J Epidemiol. 2007;165(3):235–45. doi: 10.1093/aje/kwk015. [DOI] [PubMed] [Google Scholar]
- 4.O’Mara TA, Fahey P, Ferguson K, Marquart L, Lambrechts D, Despierre E, et al. Progesterone receptor gene variants and risk of endometrial cancer. Carcinogenesis. 2011;32(3):331–5. doi: 10.1093/carcin/bgq263. [DOI] [PMC free article] [PubMed] [Google Scholar]
- 5.Xu WH, Long JR, Zheng W, Ruan ZX, Cai Q, Cheng JR, et al. Association of the progesterone receptor gene with endometrial cancer risk in a Chinese population. Cancer. 2009;115(12):2693–700. doi: 10.1002/cncr.24289. [DOI] [PMC free article] [PubMed] [Google Scholar]
- 6.Setiawan VW, Doherty JA, Shu XO, Akbari MR, Chen C, De VI, et al. Two estrogen-related variants in CYP19A1 and endometrial cancer risk: a pooled analysis in the Epidemiology of Endometrial Cancer Consortium. Cancer Epidemiol Biomarkers Prev. 2009;18(1):242–7. doi: 10.1158/1055-9965.EPI-08-0689. [DOI] [PMC free article] [PubMed] [Google Scholar]
- 7.Xu WH, Dai Q, Xiang YB, Long JR, Ruan ZX, Cheng JR, et al. Interaction of soy food and tea consumption with CYP19A1 genetic polymorphisms in the development of endometrial cancer. Am J Epidemiol. 2007;166(12):1420–30. doi: 10.1093/aje/kwm242. [DOI] [PMC free article] [PubMed] [Google Scholar]
- 8.GWAS catelog. 2012 http://www.genome.gov/26525384.
- 9.Spurdle AB, Thompson DJ, Ahmed S, Ferguson K, Healey CS, O’Mara T, et al. Genome-wide association study identifies a common variant associated with risk of endometrial cancer. Nat Genet. 2011 doi: 10.1038/ng.812. [DOI] [PMC free article] [PubMed] [Google Scholar]
- 10.Gudmundsson J, Sulem P, Steinthorsdottir V, Bergthorsson JT, Thorleifsson G, Manolescu A, et al. Two variants on chromosome 17 confer prostate cancer risk, and the one in TCF2 protects against type 2 diabetes. Nat Genet. 2007;39(8):977–83. doi: 10.1038/ng2062. [DOI] [PubMed] [Google Scholar]
- 11.Thomas G, Jacobs KB, Yeager M, Kraft P, Wacholder S, Orr N, et al. Multiple loci identified in a genome-wide association study of prostate cancer. Nat Genet. 2008;40(3):310–5. doi: 10.1038/ng.91. [DOI] [PubMed] [Google Scholar]
- 12.Voight BF, Scott LJ, Steinthorsdottir V, Morris AP, Dina C, Welch RP, et al. Twelve type 2 diabetes susceptibility loci identified through large-scale association analysis. Nat Genet. 2010;42(7):579–89. doi: 10.1038/ng.609. [DOI] [PMC free article] [PubMed] [Google Scholar]
- 13.Zheng W, Long J, Gao YT, Li C, Zheng Y, Xiang YB, et al. Genome-wide association study identifies a new breast cancer susceptibility locus at 6q25.1. Nat Genet. 2009;41(3):324–8. doi: 10.1038/ng.318. [DOI] [PMC free article] [PubMed] [Google Scholar]
- 14.Coriell Cell Repositories. [2012]; http://ccr.coriell.org/
- 15.NIEHS SNP Function Prediction (FuncPred) tool. 2012 http://snpinfo.niehs.nih.gov/snpfunc.htm.
- 16.WTCCC2. 2012 http://www.wtccc.org.uk/ccc2/
- 17.Houlston RS, Cheadle J, Dobbins SE, Tenesa A, Jones AM, Howarth K, et al. Meta-analysis of three genome-wide association studies identifies susceptibility loci for colorectal cancer at 1q41, 3q26.2, 12q13.13 and 20q13.33. Nat Genet. 2010;42(11):973–7. doi: 10.1038/ng.670. [DOI] [PMC free article] [PubMed] [Google Scholar]
- 18.Wang KK. Calpain and caspase: can you tell the difference? Trends Neurosci. 2000;23(1):20–6. doi: 10.1016/s0166-2236(99)01479-4. [DOI] [PubMed] [Google Scholar]
- 19.Huang Y, Wang KK. The calpain family and human disease. Trends Mol Med. 2001;7(8):355–62. doi: 10.1016/s1471-4914(01)02049-4. [DOI] [PubMed] [Google Scholar]
- 20.Shiba E, Kambayashi JI, Sakon M, Kawasaki T, Kobayashi T, Koyama H, et al. Ca²+;-Dependent Neutral Protease (Calpain) Activity in Breast Cancer Tissue and Estrogen Receptor Status. Breast Cancer. 1996;3(1):13–7. doi: 10.1007/BF02966957. [DOI] [PubMed] [Google Scholar]
- 21.Shiba E, Kim S, Fujitani M, Kambayashi JI, Kawamura I, Tsujimoto S, et al. Possible involvement of calpain in the growth of estrogen receptor positive breast cancer cells. Anticancer Res. 1996;16(2):773–7. [PubMed] [Google Scholar]
- 22.Salehin D, Fromberg I, Haugk C, Dohmen B, Georg T, Bohle RM, et al. Immunhistochemical analysis for expression of calpain 1, calpain 2 and calpastatin in endometrial cancer. Anticancer Res. 2010;30(7):2837–43. [PubMed] [Google Scholar]
- 23.Wang KKW, Yuen PW. Calpain: pharmacology and toxicology of calcium-dependent protease. CRC; 1999. [Google Scholar]
- 24.Davis TL, Walker JR, Finerty PJ, Jr, Mackenzie F, Newman EM, Dhe-Paganon S. The crystal structures of human calpains 1 and 9 imply diverse mechanisms of action and auto-inhibition. J Mol Biol. 2007;366(1):216–29. doi: 10.1016/j.jmb.2006.11.037. [DOI] [PubMed] [Google Scholar]
- 25.Yoshikawa Y, Mukai H, Hino F, Asada K, Kato I. Isolation of two novel genes, down-regulated in gastric cancer. Jpn J Cancer Res. 2000;91(5):459–63. doi: 10.1111/j.1349-7006.2000.tb00967.x. [DOI] [PMC free article] [PubMed] [Google Scholar]
- 26.Vasan RS, Larson MG, Aragam J, Wang TJ, Mitchell GF, Kathiresan S, et al. Genome-wide association of echocardiographic dimensions, brachial artery endothelial function and treadmill exercise responses in the Framingham Heart Study. BMC Med Genet. 2007;19(8 Suppl 1):S2. doi: 10.1186/1471-2350-8-S1-S2. [DOI] [PMC free article] [PubMed] [Google Scholar]
- 27. [2012];ESE finder. http://rulai.cshl.edu/cgi-bin/tools/ESE3/esefinder.cgi?process=home.
Associated Data
This section collects any data citations, data availability statements, or supplementary materials included in this article.