

Abstract
Background
Prior structural neuroimaging studies of the amygdala in patients with bipolar disorder have reported higher or lower volumes, or no difference relative to healthy controls. These inconsistent findings may have resulted from combining subjects in different mood states. The prefrontal cortex has recently been reported to have a lower volume in depressed versus euthymic bipolar patients. Here we examined whether similar mood state-dependent volumetric differences are detectable in the amygdala.
Methods
Forty subjects, including 28 with bipolar disorder type I (12 depressed and 16 euthymic), and 12 healthy comparison subjects were scanned on a 3T magnetic resonance image (MRI) scanner. Amygdala volumes were manually traced and compared across subject groups, adjusting for sex and total brain volume.
Results
Statistical analyses found a significant effect of mood state and hemisphere on amygdala volume. Subsequent comparisons revealed that amygdala volumes were significantly lower in the depressed bipolar group compared to both the euthymic bipolar (p=0.005) and healthy control (p=0.043) groups.
Limitations
Our study was cross-sectional and some patients were medicated.
Conclusions
Our results suggest that mood state influences amygdala volume in subjects with bipolar disorder. Future studies that replicate these findings in unmedicated patient samples scanned longitudinally are needed.
Keywords: Bipolar Disorder, Depression, Magnetic resonance imaging, MRI, Amygdala
1. Introduction
Several lines of evidence, including data from behavioral studies finding disruptions in the recognition of facial emotion (George et al., 1998; Murphy et al., 1999), and data from functional neuroimaging studies showing abnormal activation (Altshuler et al., 2005; Foland et al., 2008; Yurgelun-Todd et al., 2000) have implicated the involvement of the amygdala in the pathophysiology of bipolar illness. Structural neuroimaging studies of this brain region in bipolar disorder, however, have yielded inconsistent findings. One early study failed to detect any differences in amygdala volume between patients and controls (Swayze et al., 1992), but subsequent structural neuroimaging studies reported both higher (Altshuler et al., 1998; Brambilla et al., 2003; Strakowski et al., 1999) and lower (Pearlson et al., 1997; Rosso et al., 2007) amygdala volumes in bipolar patients relative to healthy controls.
One possible explanation for the inconsistency in findings is that the mood state of bipolar subjects may affect volumetric measurements. Most studies have reported on mixed groups of bipolar subjects in multiple mood states, and assumed that mood state does not affect brain structure. However, both our group (Brooks et al., 2009, 2011) and others (Nery et al., 2009) have recently found that bipolar patients scanned during the depressed phase of their illness have lower gray matter density in prefrontal cortex compared to patients scanned during the euthymic phase of their illness. This led us to speculate whether the amygdala would also have mood state-associated volumetric differences, a possibility that, to our knowledge, has not yet been addressed. In the current study, we evaluated this by comparing manually traced amygdala volumes in depressed and euthymic bipolar disorder patients and healthy comparison subjects. We hypothesized that, in line with previous mood-state investigations of frontal lobe gray matter, depressed subjects with bipolar disorder would show volumetric reductions of amygdala gray matter relative to euthymic subjects.
2. Methods
2.1 Participants
The Institutional Review Boards at UCLA and the VA Greater Los Angeles Healthcare System approved the study. Each subject provided written informed consent. Subjects with bipolar I disorder, currently depressed or euthymic, were recruited through the outpatient UCLA Mood Disorders Clinic and the outpatient Bipolar Disorders Clinic of the Veterans Affairs Greater Los Angeles Health Care System. Control subjects were recruited by advertisement in local newspapers and campus flyers. Control and patient populations were evaluated by a psychiatrist and the diagnosis was confirmed using the Structured Clinical Interview for DSM-IV (SCID) administered by a trained clinician. Bipolar subjects with other active Axis I comorbidities were excluded, and healthy controls were excluded if they met any past or current SCID. Additional exclusion criteria for all subjects were left-handedness, hypertension, neurological illness, metal implants and a history of skull fracture or head trauma with loss of consciousness >5 minutes.
On the day of scanning, current mood state of bipolar subjects was assessed by a trained researcher using SCID interviews, the Young Mania Rating Scale (YMRS; Young et al., 1978) and 21-item Hamilton Depression Rating Scale (HAMD; Hamilton, 1960). Bipolar subjects were considered euthymic if they did not currently meet SCID criteria for a manic, hypomanic or depressive mood episode and had both YMRS and HAMD scores ≤7. Bipolar subjects were classified as depressed if they met SCID criteria for a depressive mood episode and had a HAMD score ≥18, and a YMRS score ≤7. Information on prior illness history and current medication for patients was obtained by self-report, medical records when available, and by family/significant other corroboration.
Forty subjects qualified for the study, including 28 subjects with bipolar I disorder (12 depressed, 16 euthymic) and 12 healthy comparison subjects. Clinical and demographic information, including prior course of illness characteristics for all subjects is provided in Table 1. Groups did not differ in age, sex or educational level.
Table 1.
Demographic and clinical characteristics of subjects
| Euthymic Bipolar n = 16 | Depressed Bipolar n = 12 | Healthy Comparison n = 12 | Significance | |
|---|---|---|---|---|
| Age (SD) | 37.4 (10.8) | 39.3 (9.5) | 32.8 (7.8) | F(2, 37)=1.5, p=0.24 |
| Number of females (%) | 7 (44) | 3 (25) | 7 (58) | χ2(2)=2.7, p=0.25 |
| Illness duration (SD) | 14.7 (10.8) | 23.8 (12.3) | - | t(25)=2.04, p=0.05 |
| Number of prior manic episodes (%) | χ2(2)=2.6, p=0.10 | |||
| 1–4 | 4 (31%) | 2 (18%) | - | |
| 5–10 | 7 (59%) | 3 (27%) | - | |
| 11+ | 2 (15%) | 6 (55%) | - | |
| Number of prior depressive episodes (%) | χ2(2)=6.7, p=0.02 | |||
| 1–4 | 5 (36%) | 1 (9%) | - | |
| 5–10 | 6 (43%) | 2 (18%) | - | |
| 11+ | 3 (21%) | 8 (73%) | - | |
| History of alcohol use disorder | 5 (31%) | 4 (33%) | - | χ2(1)=0.01, p=0.91 |
| History of drug use disorder | 4 (25%) | 1 (8%) | - | χ2(1)=1.3, p=0.25 |
| HAM-D (SD) | 4.3 (4.0) | 23.5 (2.5) | - | |
| YMRS (SD) | 2.1 (1.9) | 2.0 (2.0) | - | |
| Number treated with medication (%): | ||||
| Lithium | 6 (38%) | 2 (17%) | - | χ2(1)=1.5, p=0.27 |
| Antipsychotics, any | 0 | 1 (8%) | - | χ2(l)=0.02, p=0.89 |
| Olanzapine | 0 | 1 (8%) | - | |
| Anticonvulsants, any | 9 (56%) | 11 (83%) | - | χ2(1)=2.7, p=0.10 |
| divalproex | 8 (50%) | 4 (33%) | - | |
| lamotrigine | 0 | 4 (33%) | - | |
| carbamazepine | 0 | 1 (8%) | - | |
| gabapentin | 1 (6.3%) | 2 (17%) | - | |
| Antidepressants, any | 6 (38%) | 8 (67%) | - | χ2(1)=1.3, p=0.25 |
| SSRIs | 4 (25%) | 3 (25%) | - | |
| bupropion | 2 (12.5%) | 4 (33%) | - | |
| venlafaxine | 0 | 1 (8%) | - | |
| Benzodiazepines | 0 | 2 (16%) | - | χ2(1)=0.9, p=0.34 |
| Amygdala volume (mm3) | ||||
| Left | 1684.4 (316.2) | 1515.1 (276.7) | 1686.1 (332.3) | see text |
| Right | 1592.5 (404.1) | 1262.3 (386.9) | 1541.0 (212.5) | see text |
Note: Standard deviations are in parentheses. HAM-D = Hamilton Depression Rating Scale (21-item); YMRS = Young Mania Rating Scale; SSRI = selective serotonin reuptake inhibitor. χ2 tests for the number of prior episodes are Mantel-Haenszel tests for linear trend. One depressed BP subject was missing illness duration.
2.2 Image Acquisition
Scans were acquired on a 3T MRI scanner (General Electric, Waukesha, WI). A 3-plane gradient echo scan was acquired for alignment and localization, followed by a shimming procedure to improve magnetic field homogeneity. A T1-weighted 3-dimensional volume scan was obtained for each subject that spanned the entire brain using a spoiled-gradient echo pulse sequence, with a slice thickness of 1.2mm (SPGR, echo time = 3.7 ms, TR = 25ms, field of view = 20cm, NEX = 1). Precautions were taken to minimize participant motion during scanning.
2.3 Image Preprocessing
Image preprocessing steps consisted of: correction of artifactual intensity nonuniformities due to magnetic field inhomogeneities (Zijdenbos & Dawant, 1994), adjustment for head position and transformation of imaging data into a common stereotaxic coordinate system using a three-translation and three-rotation rigid-body transformation (Woods et al., 1998), and reslicing in the coronal plane. Additionally, all images were processed to remove non-brain tissue using automated algorithms (Shattuck & Leahy, 2002), which allowed total brain volume (TBV) to be computed.
2.4 Amygdala delineation
The amygdala was manually traced by one of the authors (LFR), who was blind to demographics and diagnosis. Amygdalae were delineated using a previously defined protocol (Altshuler et al., 2000) that defined the most posterior portion as the section where the amygdala joins the tail of the caudate, and the most anterior portion as the region where amygdala gray matter was 2.5 times as thick as the surrounding temporal lobe cortex. To assess intra-rater reliability, ten different randomly selected brains were re-traced by the same investigator. Reliability was excellent, with intraclass correlations (ICC) of 0.83 and 0.86 for the left and right amygdala, respectively.
2.5 Statistical analysis
Demographic variables were analyzed using chi-square tests and analysis of variance. Amygdala volumes were analyzed using mixed effects regression (SAS MIXED V9.2) with ML estimation. Amygdala volumes were the dependent measures; mood state (depressed, euthymic, control) was a between-subjects fixed effect and was crossed with hemisphere (left, right), a within-subject factor, with compound symmetry selected as the covariance structure. Sex and TBV were significantly associated with amygdala volume measures and included as covariates. Supplementary analyses were done adding lithium and treatment duration as covariates, but these were both non-significant (both p-values >0.65) and dropped from the final models. Pairwise group contrasts were done with t-tests at unadjusted two-tailed p=0.05, with control for multiple testing provided by the overall main effect F-test.
3. Results
3.1 Neuroimaging results
The effects of mood state (F(2, 40)=4.47, p=0.018) and hemisphere (F(1, 40)=10.48, p=0.0024) were significant. The interaction was not significant (F<1), indicating that averaging across hemispheres was appropriate. Averaged across hemispheres, amygdala volume in the depressed group was significantly lower than in the euthymic (t(40)= 2.96, p=0.0052) and control groups (t(40)=2.09, p=0.043), which did not differ from each other (t(40)=0.45, p=0.65; Figure 1). Current lithium use was a non significant covariate (F<1) and including this variable in the model showed mood state remained a significant predictor of amygdala volume (F2,40)=4.24, p=0.021). There was a trend for group differences between euthymic and depressed bipolar subjects in illness duration (t(25)=2.04, p=0.052). Results comparing amygdala volumes in these two groups including illness duration as an additional covariate showed duration was not itself a significant predictor of amygdala volume (F<1). Including this factor showed that the mean volume difference between the groups remained highly significant (F(1, 27)=7.76, p=0.010).
Figure 1.
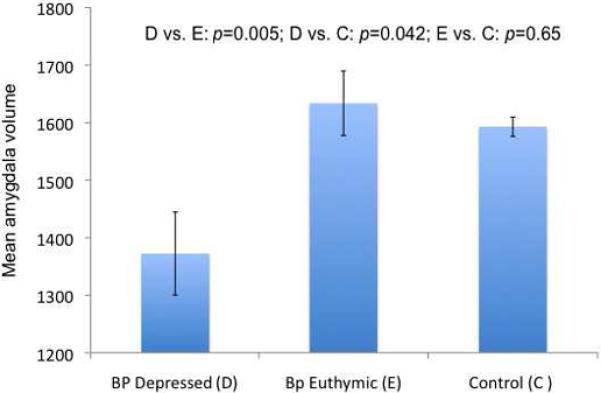
Mean amygdala volume, averaged across hemispheres, for euthymic and depressed bipolar subjects and control subjects.
4. Discussion
Our study found significant reductions in total amygdala volume in depressed bipolar subjects compared to euthymic bipolar subjects and healthy controls. These findings, taken in the context with previous research (Brooks 2009, Nery 2009, Brooks 2011) suggest that mood state should be considered and not overlooked in structural imaging studies. The mechanisms underlying these mood-dependent volumetric reductions in the amygdala, seen previously in the prefrontal cortex, are unknown. Possible causes include atrophy and shrinkage of neuronal cell bodies (Castren et al., 2007), neurotoxic elevations in stress hormones (Sapolsky et al., 2000) or reductions in fluid associated with depressed mood (Duning et al., 2005).
Our findings should be interpreted in light of several limitations. First, many of our patients were taking medication. While we found no matter measurements. Second, in the current study, statistically significant evidence of lithium affecting our findings, it cannot be ruled out that other medications may have also impacted gray we chose to specifically focus on the amygdala given that our group has conducted many structural and function investigations of this brain region (Altshuler et al., 1998, 2000, 2005; Foland et al., 2008a, 2008b), and since lesions in this area of the brain have been previously linked with a range of symptoms that overlap with that of bipolar disorder (Bear & Fedio, 1977; Flor-Henry, 1969; Shukla et al., 1987; Starkstein et al., 1988). Other brain areas implicated in bipolar disorder may also be affected by mood state. Third, as this study included only euthymic and depressed subjects with bipolar disorder, it remains unclear how mania might be associated with volumetric abnormalities of the amygdala.
Our findings are consistent with previous studies examining mood-state changes in prefrontal cortex and suggest that mood state should not be overlooked in structural neuroimaging investigations of bipolar disorder. Future studies that replicate these findings in unmedicated samples scanned longitudinally would be of interest.
Acknowledgements
The authors thank Katherine Narr, Ph.D. for methodological consultations.
Role of Funding Source Funding for this study was provided the National Institute of Mental Health (MH078556 to LCFR, and MH075944 and MH01848 to LLA). Additional support for algorithm development was provided by the NIA, NIBIB, and the National Center for Research Resources (AG016570, EB01651, RR019771 to PT). For their generous support, the authors also thank the National Association for Research on Schizophrenia and Affective Disorders (NARSAD), Brain Mapping Medical Research Organization, Brain Mapping Support Foundation, Pierson-Lovelace Foundation, The Ahmanson Foundation, William M. and Linda R. Dietel Philanthropic Fund at the Northern Piedmont Community Foundation, Tamkin Foundation, Jennifer Jones-Simon Foundation, Capital Group Companies Charitable Foundation, Robson Family and Northstar Fund. The project was also supported by Grant Numbers RR12169, RR13642 and RR00865 from the National Center for Research Resources (NCRR), a component of the National Institutes of Health (NIH). Funding sources had no further role in study design; in the collection, analysis and interpretation of data; in the writing of the report; and in the decision to submit the paper for publication.
Footnotes
Publisher's Disclaimer: This is a PDF file of an unedited manuscript that has been accepted for publication. As a service to our customers we are providing this early version of the manuscript. The manuscript will undergo copyediting, typesetting, and review of the resulting proof before it is published in its final citable form. Please note that during the production process errors may be discovered which could affect the content, and all legal disclaimers that apply to the journal pertain.
Contributors Dr. Foland-Ross designed the study, managed the literature searches and traced all brain structures. Dr. Mintz undertook the statistical analysis. Dr. Altshuler supervised all analyses and oversaw the research. All authors contributed to and have approved the final manuscript.
Conflict of Interest Disclosure Statement Dr. Altshuler has received past (and potential future) funding from Abbott Laboratories (research support and consulting honoraria); Forest Laboratories (consulting and speakers bureau honoraria); GlaxoSmithKline (speakers bureau honoraria); and no past, but potential future honoraria from Astra-Zeneca (speakers bureau) and Merck and Co. (consulting). Dr. Brooks has received funding from Pfizer Inc. (research support), Merck (speakers bureau), and Sunovion (speakers bureau).
References
- Altshuler L, Bookheimer S, Proenza M, Townsend J, Sabb F, Firestine A, et al. Increased amygdala activation during mania: a functional magnetic resonance imaging study. Amer. J. Psychiatry. 2005;162:1211–1213. doi: 10.1176/appi.ajp.162.6.1211. [DOI] [PubMed] [Google Scholar]
- Altshuler L, Bartzokis G, Grieder T, Curran J, Jimenez T, Leight K, et al. An MRI study of temporal lobe structures in men with bipolar disorder or schizophrenia. Biol. Psychiatry. 2000;48:147–162. doi: 10.1016/s0006-3223(00)00836-2. [DOI] [PubMed] [Google Scholar]
- Altshuler L, Bartzokis G, Grieder T, Curran J, Mintz J. Amygdala enlargement in bipolar disorder and hippocampal reduction in schizophrenia: an MRI study demonstrating neuroanatomic specificity. Arch. Gen. Psychiatry. 1998;55:663–664. doi: 10.1001/archpsyc.55.7.663. [DOI] [PubMed] [Google Scholar]
- Brambilla P, Harenski K, Nicoletti M, Sassi R, Mallinger A, Frank E, et al. MRI investigation of temporal lobe structures in bipolar patients. J. Psychiatr. Res. 2003;37:287–295. doi: 10.1016/s0022-3956(03)00024-4. [DOI] [PubMed] [Google Scholar]
- Brooks J, Bonner J, Rosen A, Wang P, Hoblyn J, Hill S, et al. Dorsolateral and dorsomedial prefrontal gray matter density changes associated with bipolar depression. Psychiatry Res. 2009;172:200–204. doi: 10.1016/j.pscychresns.2008.06.007. [DOI] [PMC free article] [PubMed] [Google Scholar]
- Brooks J, Foland-Ross L, Thompson P, Altshuler L. Within-subject changes in gray matter density associated with remission of bipolar depression. Psychiatric Research Neuroimaging. 2011;193:53–55. doi: 10.1016/j.pscychresns.2010.12.012. [DOI] [PMC free article] [PubMed] [Google Scholar]
- Castren E, Voikar V, Rantamaki T. Role of neurotrophic factors in depression. Current Opinion in Pharamcology. 2007;7:18–21. doi: 10.1016/j.coph.2006.08.009. [DOI] [PubMed] [Google Scholar]
- Duning T, Kloska S, Steinstrater O, Kugel H, Heindel W, Knecht S. Dehydration confounds the assessment of brain atrophy. Neurology. 2005;64:548–550. doi: 10.1212/01.WNL.0000150542.16969.CC. [DOI] [PubMed] [Google Scholar]
- Foland LC, Altshuler L, Bookheimer S, Eisenberger N, Townsend J, Thompson P. Evidence for deficient modulation of amygdala response by prefrontal cortex in bipolar mania. Psychiatric Research Neuroimaging. 2008;162:27–37. doi: 10.1016/j.pscychresns.2007.04.007. [DOI] [PMC free article] [PubMed] [Google Scholar]
- George M, Huggins T, McDermut W, Parekh P, Rubinow D, Post R. Abnormal facial emotion recognition in depression: serial testing in an ultra-rapid cycling patient. Behav. Modif. 1998;22:192–204. doi: 10.1177/01454455980222007. [DOI] [PubMed] [Google Scholar]
- Hajek T, Kopecek M, Kozeny J, Gunde E, Alda M, Höschl C. Amygdala volumes in mood disorders–meta-analysis of magnetic resonance volumetry studies. J. Affect. Disord. 2010;115:395–410. doi: 10.1016/j.jad.2008.10.007. [DOI] [PubMed] [Google Scholar]
- Hamilton M. A rating scale for depression. J. Neurol. Neurosurg. Psychiatry. 1960;12:56–62. doi: 10.1136/jnnp.23.1.56. [DOI] [PMC free article] [PubMed] [Google Scholar]
- Murphy F, Sahakian B, Rubinsztein J, Michael A, Rogers R, Robbins T, et al. Emotional bias and inhibitory control processes in mania and depression. Psychol. Med. 1999;29:1307–1321. doi: 10.1017/s0033291799001233. [DOI] [PubMed] [Google Scholar]
- Nery F, Chen H, Hatch J, Nicoletti M, Brambilla P, Sassi R, et al. Orbitofrontal cortex gray matter volumes in bipolar disorder patients: a region-of-interest MRI study. Bipolar Disorders. 2009;11:145–153. doi: 10.1111/j.1399-5618.2009.00662.x. [DOI] [PubMed] [Google Scholar]
- Pearlson G, Barta P, Powers R, Menon R, Richards S, Aylward E, et al. Medial and superior temporal gyral volumes and cerebral asymmetry in schizophrenia versus bipolar disorder. Biol. Psychiatry. 1997;41:1–14. doi: 10.1016/s0006-3223(96)00373-3. [DOI] [PubMed] [Google Scholar]
- Rosso I, Killgore W, Cintron C, Gruber S, Tohen M, Yurgelun-Todd D. Reduced amygdala volumes in first-episode bipolar disorder and correlation with cerebral white matter. Biol. Psychiatry. 2007;61:743–749. doi: 10.1016/j.biopsych.2006.07.035. [DOI] [PubMed] [Google Scholar]
- Shattuck D, Leahy R. Brainsuite: An automated cortical surface identification tool. Med. Image Anal. 2002;6:129–142. doi: 10.1016/s1361-8415(02)00054-3. [DOI] [PubMed] [Google Scholar]
- Strakowski S, DelBello M, Sax K, Zimmerman M, Shear P, Hawkins J, et al. Brain magnetic resonance imaging of structural abnormalities in bipolar disorder. Arch. Gen. Psychiatry. 1999;56:254–260. doi: 10.1001/archpsyc.56.3.254. [DOI] [PubMed] [Google Scholar]
- Swayze V. n., Andreasen N, Alliger R, Yuh W, Ehrhardt J. Subcortical and temporal structures in affective disorder and schizophrenia: a magnetic resonance imaging study. Biol. Psychiatry. 1992;31:221–240. doi: 10.1016/0006-3223(92)90046-3. [DOI] [PubMed] [Google Scholar]
- Usher J, Leucht S, Falkai P, Scherk H. Correlation between amygdala volume and age in bipolar disorder - A systematic review and meta-analysis of structural MRI studies. Psychiatry Res. 2010;182:1–8. doi: 10.1016/j.pscychresns.2009.09.004. [DOI] [PubMed] [Google Scholar]
- Woods R, Grafton S, Holmes C, Cherry S, Mazziotta J. Automated image registration: I. General methods and intrasubject, intramodality validation. J. Comput. Assist. Tomogr. 1998;22:139–152. doi: 10.1097/00004728-199801000-00027. [DOI] [PubMed] [Google Scholar]
- Young R, Biggs J, Ziegler V, Meyer D. A rating scale for mania: Reliability, validity and sensitivity. Br. J. Psychiatry. 1978;133:429–435. doi: 10.1192/bjp.133.5.429. [DOI] [PubMed] [Google Scholar]
- Yurgelun-Todd D, Gruber S, Kanayama G, Killgore W, Baird A, Young A. fMRI during affect discrimination in bipolar affective disorder. Bipolar Disorders. 2000;2:237–248. doi: 10.1034/j.1399-5618.2000.20304.x. [DOI] [PubMed] [Google Scholar]
- Zijdenbos A, Dawant B. Brain segmentation and white matter lesion detection in mr images. Crit. Rev. Biomed. Eng. 1994;22:401–465. [PubMed] [Google Scholar]