

Abstract
Histamine is involved in the central control of arousal, circadian rhythms and metabolism. The preoptic area, a region that contains thermoregulatory neurons is the main locus of histamine modulation of body temperature. Here we report that in mice histamine activates H2 subtype receptors in the medial preoptic nucleus (MPON) and induces hyperthermia. We also found that a population of glutamatergic MPON neurons express H2 receptors and are excited by histamine or H2 specific agonists. The agonists decreased the input resistance of the neuron and increased the depolarizing “sag” observed during hyperpolarizing current injections. Furthermore, at −60 mV holding potential activation of H2 receptors induced an inward current that was blocked by ZD7288, a specific blocker of the hyperpolarization activated cationic current (Ih). Indeed, activation of H2 receptors resulted in increased Ih amplitude in response to hyperpolarizing voltage steps and a depolarizing shift in its voltage-dependent activation. The neurons excited by H2 specific agonism expressed the HCN1 and HCN2 channel subunits. Our data indicate that at the level of the MPON histamine influences thermoregulation by increasing the firing rate of glutamatergic neurons that express H2 receptors.
Keywords: histamine, hyperthermia, H2 histamine receptor, H-current, medial preoptic nucleus
1. Introduction
The preoptic area/anterior hypothalamus (PO/AH) contains thermoregulatory neurons that send a GABAergic inhibitory tone to the dorsomedial hypothalamus or to the medullary rostral raphe pallidus that project to premotor sympathetic neurons connected to brown adipose tissue or cutaneous blood vessels (for review see (McAllen et al., 2010; Morrison et al., 2008). Recent studies have proposed also the presence of a glutamatergic output of the PO/AH in the control of thermoregulation (Dimitrov et al., 2011; Lundius et al., 2010). Within the PO/AH several nuclei are involved in thermoregulation, with the median and the medial nuclei playing similar but distinct roles (Nakamura et al., 2009; Tanaka et al., 2011; Yoshida et al., 2009).
A role of CNS histamine signaling in thermoregulation has been reported in various organisms from invertebrates to mammals (Green et al., 1976; Hong et al., 2006; Leger and Mathieson, 1997). The neurons of the tuberomammillary nucleus, the only neuronal source of histamine in the brain, project their axons throughout the brain (for review, see (Haas and Panula, 2003)), in the hypothalamus the histaminergic fibers are especially dense in the anterior part (Wada, 1992). The PO/AH appears to be the main locus in which histamine affects body temperature. Histamine injected in the PO/AH induces hyperthermia (Gatti and Gertner, 1984). We have previously reported that in the median preoptic nucleus, the most rostral region involved in the central control of thermoregulation, histamine influences body temperature by activating H1 and H3 receptors expressed by glutamatergic and GABAergic preoptic neurons, respectively (Lundius et al., 2010). However, previous in vivo studies have also indicated a role of H2 receptors in the effects of histamine on body temperature, namely in the caudal region of the PO/AH (Colboc et al., 1982). We have therefore tested the hypothesis that the MPON is the site where activation of H2 receptors modulates thermoregulation. Here we study the effects of histamine and subtype specific agonists on the activity of identified MPON GABAergic and glutamatergic neurons. We also investigate the histamine receptor subtypes involved in the hyperthermia activated by histamine when infused in the MPON.
2. Materials and Methods
2.1. Ethical approval of animal work
All animal work was conducted in accordance with the Institutional Animal Care and Use Committee of the Scripps Research Institute. The standards are set forth by American Association for the Accreditation of Laboratory Animal Care (AAALAC) standards and the regulations set forth in the Animal Welfare Act.
2.2. Slice preparation
Coronal tissue slices containing the medial preoptic nucleus (MPON) were prepared from GAD65-GFP male mice (28–42 days old) housed in standard conditions. This transgenic mouse line expresses enhanced green fluorescent protein (eGFP) under the control of the regulatory region of mouse glutamic acid decarboxylase (GAD) 65 gene (Bali et al., 2005). The mice were a kind gift from Dr Gabor Szabo (Hungarian Academy of Sciences, Budapest). A total of 29 male mice were used for slice preparations. The slice used in our recordings comprised the sections located from 0.14 mm to −0.22 mm from Bregma in the mouse brain atlas (Paxinos and Franklin, 2001) and corresponded to the location of the canulla in our in vivo experiments (see below). The slices were prepared at 9–11 am local time during the “subjective light period” and recordings were carried out up to the end of this period i.e. 8 pm local time.
2.3. Whole-cell patch clamp recording
The artificial cerebrospinal fluid (aCSF) contained: 130 NaCI, 3.5 KCI, 1.25 NaH2PO4, 24 NaHCO3, 2 CaCI2, 1 MgSO4, 10 glucose osmolarity of 300–305 mOsm, equilibrated with 95% O2 and 5% CO2 (pH 7.4). Other salts and agents were added to this medium. A K+ pipette solution containing 130 K-gluconate, 5 KCI, 10 HEPES, 2 MgCI2, 0.5 EGTA, 2 ATP, 1 GTP (pH7.3) was used in most experiments. For recordings of miniature IPSCs, at a holding potential of −10 mV a Cs pipette solution containing 135 Cs-methanesulphonate, 5 CsCI, 10 HEPES, 2 MgCI2, 0.5 EGTA, 2 ATP, 1 GTP (pH 7.4) was used. Glass micropipettes were pulled with a horizontal puller (Sutter Instruments) using Sutter borosilicate glass capillaries with filament. The electrode resistance after back-filling was 2–4 MOmega;. All voltages were corrected for the liquid junction potential (−13 mV). The histaminergic ligands were from Tocris (Ellisville, MO) while the other substances were purchased from Sigma. The recording chamber was constantly perfused with aCSF (2–3 mL/min). The treatments were applied locally using a perfusion pencil system (tip diameter 100 μm, Automate Scientific) driven by gravity. Only brightly fluorescent neurons were selected throughout this study as “GFP positive” and neurons lacking any fluorescence as “GFP-negative”. Neurons that appeared to display slight fluorescence were not studied.
2.4. Data acquisition and analysis
Data was acquired with a MultiClamp 700B amplifier digitized using a Digidata 1320A interface and the Pclamp9.2 software package (all from Molecular Devices, Sunnyvale, CA). The sampling rate for the continuous recordings of spontaneous activity was 50 kHz. The temperature of the external solution was controlled with a TC-344B temperature controller and an inline heater (Warner Instruments, Hamden CT) and was maintained at 36–37 °C. After establishing whole-cell configuration the spontaneous activity of the neuron was recorded for 2–4 min to determine its control behavior at 36–37 °C. The spontaneous firing activity of the neurons was recorded in whole-cell mode (current clamp, I=0). The thermal coefficient of a neuron, defined as the slope of the linear regression fitted to the firing rate versus temperature plot was determined as described previously (Tabarean et al., 2004; Tabarean et al., 2006). Briefly, the temperature was varied in the range 35–40°C, and the thermal coefficient was determined over a temperature range of at least 3°C. A neuron having a thermal coefficient higher than 0.8 impulses · s−1 · °C−1 was defined as warm-sensitive. The cell capacitance was determined and compensated using the Multiclamp Commander software. The input resistance of the neurons was determined as the slope of the fit to the linear region of the I–V curve, obtained by injections of hyperpolarizing square current pulses. Synaptic potentials were detected automatically using the Mini Analysis program (Synaptosoft). The frequency, amplitudes, and kinetics of synaptic events were analyzed using MiniAnalysis software. Linear leak subtraction was carried out with a −P/8 protocol applied after the test pulse. This protocol prevented activation of voltage-gated currents during the subtraction steps with the caveat of increased noise level in the corrected traces.
2.5. Cytoplasm harvesting and reverse transcription
MPON neurons in slices were patch-clamped and then harvested into the patch pipette by applying negative pressure. The content of the pipette was expelled in a PCR tube. dNTPs (0.5 mM), 50 ng random primers (Invitrogen) and H2O were added to each cell to a volume of 16 μl. The samples were incubated at 65°C for 5 min and then put on ice for 3 min. First strand buffer (Invitrogen), DTT (5 mM, Invitrogen), RNaseOUT (40 U, Invitrogen) and SuperScriptIII (200 U, Invitrogen) were added to each sample to a volume of 20 μl followed by incubation at room temperature for 5 min, at 50°C for 50 min and then at 75°C for 15 min. After reverse transcription samples were immediately put on ice. 1μl of RNAse H was added to samples and kept at 37°C for 20 min.
2.6. Nested PCR
Gene specific primers for GAD65 and histamine H1-3 receptors H1-3 were as described elsewhere (Lundius et al., 2010). The primer pairs for Vglut2 and HCN1-4 are listed in Table 1. cDNAs were amplified in a volume of 25 μl using a high-fidelity Platinum Taq polymerase kit (Invitrogen) and 0.4 mM dNTPs (Invitrogen). For each gene 1/10 of the cDNA from each cell was subjected to a first round of PCR using the outer primer pair and a thermal cycling program with an initial denaturation at 94°C for 2 min, 35 cycles of denaturation at 94°C for 15 s, annealing at 55°C for 30 s and extension at 68°C for 45 s followed by a final extension at 68°C for 10 min. 1.5 μl of the PCR product was subjected to a second round of PCR using the inner primer pair and 40 cycles of the same thermal cycling program as above with the extension time reduced to 30 s. PCR products were visualized by ethidium bromide stained 2% agarose gel electrophoresis. For HCN2 a second round of PCR was not necessary since it did not yield additional positives when compared with the first round. Neurons were analyzed in batches of 5–9 neurons within 5 days after being harvested.
Table 1.
Primers
| Primer | External sequence | Amplicon Size | Internal sequence | Amplicon Size |
|---|---|---|---|---|
| Vglut 2 | F: 5′ ctggatggtcgtcagtattttatg 3′ R: 5′atgagagtagccaacaaccagaag 3′ |
Bp:503 | F: 5′ gcaggagctggactttttatttac 3′ R: 5′ tagttgttgagagaatttgcttgc 3′ |
Bp:186 |
| HCN 1 | F:5′ tcaaagcagaaaagaagtac3′ R:5′gatctaattggagttgcctt3′ |
Bp:400 | F: 5′ ccaatcaaagctttctttca 3′ R:5′ ttttctcacaaaatcaatgaac 3′ |
Bp:222 |
| HCN 2 | F:5′ gcatctgtaaacctgatcgc 3′ R:5′ ggtgtccatcaacaacatgg 3′ |
Bp:370 | F:5′ ggtgtccatcaacaacatgg 3′ R: 5′ttgcttgtccttctcctggt 3′ |
Bp:200 |
| HCN 3 | F: 5′: gacactttcttcctgctgga 3′ R:5′ gcttgtggaaggacatgtact 3′ |
Bp: 728 | F: 5′ctgtctcctccaarccctg 3′ R:5′ ttgtggacatgtact 3′ |
Bp:237 |
| HCN 4 | F:5′ cctgtcgactacatcttcct 3′ R:5′ cacctgtttatacttctcctgg 3′ |
Bp:550 | F: 5′ gggaagagatcttccacat 3′ R: gaacatggcatagcagtg3′ |
Bp: 327 |
2.7. Surgery for in vivo studies
Surgery was performed in a dedicated surgery room, using sterile instruments, sterile surgical gloves, facemask and aseptic procedures. Any items to be implanted such as telemetry transmitters etc. are also sterilized. The surgical site is and disinfected with povidone-iodine solution and alcohol. All surgical procedures were performed under general anesthesia with isofluorane (4–5% induction, 1–2% maintenance) administered by inhalation via nose cone using a closed-flow-by/exhaust nebulizer system. After induction, animals are continuously maintained at a proper level of anesthesia, as defined by absence of the corneal reflex or by testing the posterior limb withdrawal reflex. A heating pad regulated by a thermostat automatically maintained animal’s core body temperature at ~37°C. In order to minimize the incidence of infection, topical antibiotic treatments (Bacitracin Zinc Ointment) were applied after completion of surgical procedures. After completion of surgery and appropriate wound closure, the mouse recovered under observation while in a clean single cage that did not contain bedding and monitored for anesthetic recovery of normal righting capability and locomotion. Body temperature was monitored and maintained with a heating pad. Post surgical analgesia consisted of buprenorphin (0.05–0.1 mg/kg, subcutaneous, at time of surgery, then every 3 hours if needed, 1–3 days). Operated mice were monitored until they fully recovered from anesthesia.
2.8. Radiotelemetrv studies of core body temperature and motor activity
Mice were implanted with the radio transmitter (TA10TA-F20™ and RPC-1™, Data Sciences, Inc.) as previously described (Lundius et al., 2010). The cages were positioned onto the receiver plates. Radio signals from the animals’ core body temperature (CBT) and motor activity (MA) were continuously monitored by a fully automated data acquisition system (Dataquest™ A.R.T. ™, Data Sciences, Inc). C57/Bl6 adult males (12–14 weeks old) were used for the in vivo experiments. A total of 48 mice were implanted for the studies described here.
2.9. Stereotaxic injections
Cannula implantation and injections were carried out as previously described (Lundius et al., 2010). Coordinates for cannula (27 ga. 16 mm length) implants in the medial preoptic nucleus (MPON): from Bregma: −0.02 mm, 0.35 and −0.35 mm lateral, and ventral 4.75 mm (Paxinos and Franklin, 2001). The ambient temperature was maintained at ~25 ± 0.5 °C in a 12:12-h lightdark cycle controlled room (lights on 8:00 am). Histaminergic ligands were injected bilaterally. All substances injected were dissolved in sterile aCSF. Mice were handled for at least three days before the injection during 5 minutes every day for habituation. On the day of injections, mice were held and the injector (cannulae 33 Ga, 17 mm length) was placed inside the cannula. The injector was connected to a microsyringe (1.0 μL). The injected volume was 0.2 μL (rate 0.1 μL/min). After this procedure the animal was returned to the home cage. Injections were always performed at 12 am local time, during the “subjective light period”. Each mouse received a maximum of three injections, including the control (aCSF) one. The cannula placement was always checked at the end of the experiments by blue pontamine dye injection. The animals were then killed by guillotine decapitation while under general anesthesia with isoflorane (5%). The brains were removed and cryosectioned. The cannula placement in the MPON was confirmed using an inverted microscope.
2.10. Statistics
The values reported are presented as mean ± standard deviation (S.D.). Statistical significance of the results pooled from two groups was assessed with t-tests using Prism4 (GraphPad Software). Non-parametric one way analysis of variance (ANOVA, Kruskal-Wallis) with Dunn’s post hoc test (P<0.05) was used for comparison of multiple groups. For analysis of synaptic activity comparisons of cumulative distributions were done with Kolmogorov-Smirnov test (P< 0.05). All data collected as time series were compared across time points by two way ANOVA with repeated measures (P<0.05) followed by unpaired t-tests (P<0.05) for comparisons at each time point (Prism4, GraphPad Software).
3. Results
3.1. Effects of histamine on the spontaneous activity of MPON neurons
MPON GABAergic neurons were identified by using the transgenic mouse line GAD65-GFP as described previously (Lundius et al., 2010). The spontaneous firing activity of GABAergic neurons was not affected by histamine (30 μM) applied locally via a perfusion pencil (diameter 100 μm) in all the cells studied (n=36). The average firing rate of the neurons was 6.9 ± 3.1 Hz (n = 15) in control and 7.1 ± 2.9 Hz (n = 15) during histamine application (paired t-test, P>0.6). Other concentrations of histamine (3 μM, n=10, and 100 μM, n=11) were also without effect on the spontaneous firing activity of MPON GABAergic neurons. Among the 36 GABAergic neurons studied 10 were warm-sensitive (average thermal coefficient of0.9 ± 0.1 impulses · s−1 · °C−1) while the rest were temperature-insensitive (average thermal coefficient of 0.4 ± 0.2 impulses · s−1 · °C−1). When recorded in voltage-clamp (at −50 mV holding potential) the neurotransmitter did not affect the characteristics (frequency, amplitude, and kinetics) of spontaneous (s)EPSCs and sIPSCs in GABAergic MPON neurons (n=10 neurons).
We then studied the effect of histamine on GFP-negative MPON neurons (i.e. putative glutamatergic, see below). The amine increased the spontaneous firing rate of 24 of 63 (38%) neurons studied. The average firing rate of the neurons increased from 2.7±1.1 Hz to 4.9±2.0 Hz (n=15, paired t-test P<0.05) and from 2.5 ±1.3 Hz to 4.6 ±1.9 Hz (n=7, paired t-test P<0.05) in the presence of 30 and 100 μM histamine, respectively. Lower concentrations (3 μM) were ineffective in all neurons studied (n=10). All 63 GFP-negative neurons studied were temperature-insensitive (average thermal coefficient of 0.4 ± 0.3 impulses · s−1 · °C−1). Since we have previously found that histamine excitation of glutamatergic neurons from a different preoptic region (the median preoptic nucleus) was dependent upon activation of H1 receptors (Lundius et al., 2010) we tested whether the same mechanisms applies to MPON neurons.
Surprisingly the H1 receptor specific antagonist trans triprolidine (0.1 μM) blocked the increase in firing rate induced by histamine (30 μM) only in two out of 18 studied neurons. Instead, the H2 receptor specific antagonist tiotidine (0.1 μM) abolished the effect of histamine in all the other MPON GFP-negative neurons. Figure 1A presents such an experiment in which the increase in firing rate induced by the neurotransmitter was abolished by tiotidine. Figure 1B presents the average firing rate of three neurons in response to histamine, before and after tiotidine incubation. The H2 receptor antagonist itself had no effect on the spontaneous firing activity of the neurons suggesting that this receptor did not present a tonic activity. The H4R selective antagonist JNJ 10191584 (0.5 μM) did not affect the increase in firing rate induced by histamine (30 μM) in any of the MPON GFP-negative neurons tested (n=8). The H2 receptor specific agonist dimaprit (10 μM) mimicked the effect of histamine in MPON GFP-negative neurons, it increased the firing rate from 2.8 ±1.5 Hz to 4.6 ± 2.1 Hz (n=16, paired t-test P<0.05) in 16 out of 40 neurons tested. This increase in firing rate was not changed in the presence of the H1 receptor antagonist trans-triprolidine (n=7) (Fig 2A, B).
Figure 1.
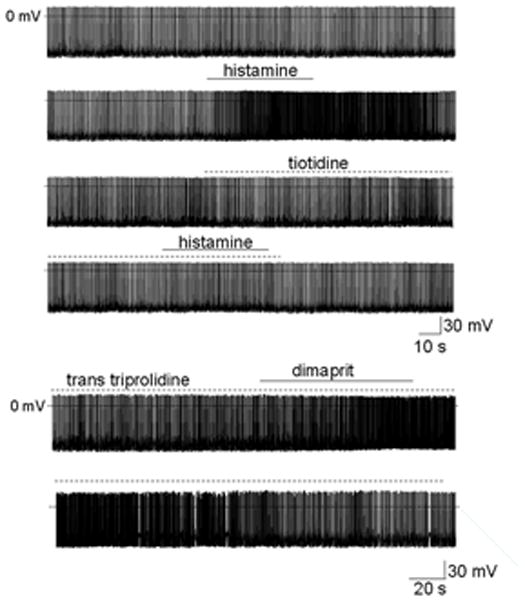
Histamine increases the firing rate of MPON nonGABAergic neurons.
A. Spontaneous firing activity of MPON nonGABAergic neuron recorded before, during, and after application of histamine (60 μM). The firing rate increased from 2.2 Hz to 5.7 Hz in response to the neurotransmitter (upper two traces). After full recovery of the firing rate, histamine was without effect in the presence of the H2 antagonist tiotidine (0.1 μM) (lower two traces). B. Average firing rate (for every 10 s) recorded before, during, and after application of histamine (60 μM). After full recovery of the firing rate, histamine was without effect in the presence of the H2 antagonist tiotidine (0.1 μM). Data are from three neurons. The filled circles (●) correspond to the experiment presented in A.
Figure 2.

Activation of H2 receptors increases the firing rate of MPON nonGABAergic neurons.
A. Spontaneous firing activity of MPON nonGABAergic neuron recorded before, during, and after application of H2 agonist dimaprit (10 μM). The firing rate increased from 1.9 Hz to 4.1 Hz in response to the agonist. The H1 antagonist trans triprolidine (0.1 μM) was present in the extracellular solutions. B. Bar chart summarizing the average change in spontaneous firing rate in response to incubations with histamine receptor agonists and antagonists. ** indicates statistical significance of P< 0.01 when compared with the control (ANOVA, Kruskal-Wallis with Dunn’s post test). The bars represent averages ±S.D.
Together with the block by tiotidine, these results indicated that the histamine-induced increase in firing of putative glutamatergic MPON neurons is mediated by activation of the H2 receptors in the large majority of neurons, with only few neurons being excited by activation of H1 receptors. The effect described above was not associated with any obvious change in the frequency of sIPSPs or sEPSPs but with a slight decrease in the resting membrane potential (see below). We further studied possible synaptic effects in 6 GFP-negative MPON neurons excited by the H2 agonist and in 11 GFP-negative MPON neurons that did not respond to it, by recording synaptic events in the absence of action potentials at a −50 mV holding potential. The properties (frequency, amplitude, and kinetics) of sIPSCs and sEPSCs in these neurons were not affected by either histamine (n = 17) or dimaprit (n = 17) (Table 2).
Table 2.
Characteristics of GABAergic and glutamatergic MPON neurons
| GABAergic cells | glutamatergic cells | |||
|---|---|---|---|---|
| control | dimaprit (10 μM) | control | dimaprit (10 μM) | |
| Firing rate (Hz) | 6.4 ± 2.2 (12) | 6.7 ± 2.3 (12) | 2.8 ± 1.5 (16) * | 4.6 ± 2.1 (16) * |
| Resting membrane potential (mV) | −54.5 ± 4.2 (12) | −53.9 ± 4.0 (12) | −59.8 ± 3.5 (16) * | −62.9 ± 4.3 (16) * |
| Input resistance (Omega;) | 405 ± 121(12) | 413 ± 134 (12) | 392 ± 85 (16) * | 283 ± 69 (16) * |
| sIPSC freq. (Hz) | 6.2 ± 3.9 (12) | 6.8 ± 4.1 (12) | 4.8 ± 2.8 (17) | 5.2 ± 2.6 (17) |
| sEPSC freq. (Hz) | 8.2 ± 3.3 (12) | 8.0. ± 3.9 (12) | 10.4 ± 5.6 (17) | 11.0 ± 5.4 (17) |
| mIPSC freq. (Hz) | 4.2 ± 2.3 (5) | 4.3 ± 2.1 (5) | 3.9 ± 2.2 (6) | 4.1 ± 3.1 (6) |
| mEPSC freq. (Hz) | 6.7 ± 2.5 (6) | 6.5 ± 2.1 (6) | 7.2 ± 3.3 (7) | 7.5 ± 3.6 (7) |
Values are presented as mean ± S.D., (n)-number of cells, * indicates P<0.05, paired t-tests
Finally, we have also tested the effect of dimaprit (10 μM) on a group of GFP-positive MPON neurons (n=12). The agonist did not change the spontaneous firing rate, the input resistance, and the synaptic activity of the neurons studied (Table 2).
3.2. Role of the hyperpolarization activated cationic current (Ih) in the H2 receptor mediated excitation of MPON neurons
To determine the effect of dimaprit on the input resistance of GFP-negative MPON neurons we have measured the voltage responses to hyperpolarizing current steps. The voltage responses were decreased during dimaprit (10 μM) incubation indicating a decrease in input resistance (Fig 2A) in neurons excited by dimaprit (n=16). The depolarizing voltage sag present during hyperpolarizing voltage steps was increased by the H2 receptor agonist, suggesting a change in Ih. Dimaprit (10 μM) was without effect on the input resistance or depolarizing sag in neurons in which the agonist did not alter the firing rate (n=10). The specific Ih blocker ZD7288 (50 μM) abolished the sag and increased the amplitude of the voltage responses, indicating a large increase in membrane resistance (Fig 2A). We have also noticed that dimaprit induced a decrease of 3 ± 2 mV (n=16) in the resting membrane potential (measured in TTX to abolish spontaneous firing). Table 2 summarizes the properties of the cells in control and during dimaprit incubation.
In voltage-clamp recordings, in the presence of TTX (1 μM) to block the persistent sodium current and action-potential driven PSCs, dimaprit activated an inward current that averaged 12 ± 5 pA (n=8) at −60 mV holding potential (Fig 3B). The current was fully blocked by ZD7288 (50 μM). The blocker also activated an apparent outward current (5 ± 2 pA, n=8) suggesting that a tonic Ih, albeit of small amplitude, is activated at −60 mV holding potential. To measure directly the influence of H2 receptor activation on the characteristic of Ih we applied a series of hyperpolarizing voltage steps (−60 to −120 mV) from −50 mV holding potential. Voltages more negative than −120 mV usually resulted in unstable current traces at our recording temperature (36–37 degrees C). Ih displayed fast activation kinetics, the current reaching steady state within 250 ms at all voltages (Fig 4A). ZD7288 (50 μM) completely blocked the current (Fig 4A). Dimaprit (10 μM) incubation resulted in a robust increase in current amplitude, at all voltages, in 9 out of 21 GFP-negative MPON neurons (P<0.01, paired t-tests for each voltage). The effect was more pronounced at more positive potentials, it averaged 90 ± 31 % at −60 mV (n=9) and 26 ± 12% at −120 mV (n=9) (Fig 4A–C).
Figure 3.

Involvement of Ih in the dimaprit-activated responses in MPON nonGABAergic neurons.
A. Voltage responses to negative current steps (0, −25, −50, −75 and −100 pA) injected through the recording pipette in a whole-cell configuration. The depolarizing “sag” observed during hyperpolarizing current injections increased by dimaprit (10 μM) incubation (left, middle traces) and was abolished by 50 μM ZD7288 (left, lower traces) a specific blocker of the Ih current. Peak amplitude of the voltage responses plotted against the respective hyperpolarizing current injections in control conditions (●), and in the presence of dimaprit (△) and ZD7288 (□) (right). The points represent averages±S.D. B. Dimaprit (10 μM) activates an inward current in MPON nonGABAergic neurons (upper trace). The current was blocked by ZD7288 (50μM) (lower trace). The neuron was held at −60 mV. A, B. TTX (1 μM) was present in all extracellular solutions.
Figure 4.

Dimaprit increases the amplitude of Ih in MPON non-GABAergic neurons.
A. Ih currents recorded in control (upper traces), during dimaprit (10 μM) incubation (middle) and during ZD7288 (50 μM) incubation (lower) neurons. The currents were elicited by the voltage step protocol depicted in the inset from a holding potential of −50 mV. TTX (1 μM) was present in all solutions. B. I–V plot for the Ih density at the end of the test pulse in control (●), dimaprit (○) or ZD7288 (▼). Data represent averages from n=9 MPON neurons. S.D. was omitted for clarity (* indicates statistical significance of P<0.05, paired t-tests). C. Data from B normalized to the respective control presented as averages ± S.D. D. Ih currents recorded in control (thin traces), during db-cAMP (40 μM) incubation (thick traces) and during db-cAMP + dimaprit (10 μM) incubation (grey traces). The currents were elicited by the voltage step protocol depicted in the inset. TTX (1 μM) was present in all solutions. E. I–V plot for the normalized Ih density at the end of the test pulse in control (●), db-cAMP (○) or db-cAMP + dimaprit (△). Data represent averages ± S.D. from n=7 MPON neurons.
We then studied the Ih sensitivity to elevations of cyclic nucleotide levels by adding the membrane-permeant analog db-cAMP to the extracellular solution. Within 5 min of incubation with db-cAMP (40 μM) the amplitude of the Ih currents was augmented and the activation curve was shifted to more depolarized potentials (Fig 4D, E). This treatment also occluded any further effects of dimaprit (Fig 4D, E).
3.3. Lack of effects of the H2 receptor agonist on the spontaneous release of glutamate and GABA
We have also studied the effects of dimaprit (10 μM) on the properties of mEPSCs in a group of MPON neurons. In either GFP-positive (n = 6) or GFP-negative neurons (n =7), the H2 receptor agonist did not affect the characteristics (frequency, amplitude, and kinetics) of the mIPSCs (Table 2). Finally, the agonist did not affect the properties of mIPSCs in any neurons studied (n = 5 GFP-positive and n = 6 GFP- negative) (Table 2). These recordings were performed using the Cs pipette solution at a holding potential of −10 mV as previously described (Tabarean et al., 2006).
Expression of histamine H1-3 receptors and HCN1-4 subunits in MPON GFP-negative neurons
To further clarify the nature of the histamine receptors in the histamine responses of MPON neurons we performed single-cell reverse transcription-PCR (sc RT/PCR) experiments in 33 neurons. We have first characterized the electrophysiological responses to dimaprit (10 μM) and then harvested the cytoplasm of the recorded neuron (see Methods). The recordings were of short duration (5–10 min) to minimize mRNA dilution and/or degradation. Negative (−) control was amplified from a harvested cell without reverse transcription, and positive control (+) was amplified using 0.5 ng of preoptic mRNA. Other controls, including samples of the pipette and bath solutions, were negative after RT-PCR (data not shown). We have first analyzed the presence of Vglut2 and GAD65 transcripts. Vglut2 was detected in the majority of GFP-negative neurons (28 out of 33) while GAD65 was found only in one neuron, indicating that most of GFP-negative neurons are glutamatergic. We then analyzed the presence of H1-3 receptors transcripts. The H2 receptors were detected only in neurons excited by dimaprit (12 out of 14 neurons excited by the agonist). All 12 neurons were also Vglut2 positive. The H1 receptor was detected in one Vglut2 positive neuron that was not excited by dimaprit, while H3 receptor transcripts were not detected in any neuron.
To establish the molecular identity of the channels that conduct Ih in MPON neurons we have also analyzed the presence of HCN1-4 transcripts. HCN1 and/or HCN2 were detected in the majority of MPON neurons (20 out of 33). 4 neurons expressed HCN1 only, while 2 expressed HCN2 only. All H2 receptor positive neurons expressed both HCN1 and HCN2. HCN3 was not detected in any of the 33 neurons studied. HCN4 was detected in 5 MPON neurons. Ih in neurons expressing HCN2 or HCN4 only was characterized by slow activation kinetics (risetime > 300 ms). These neurons were H2-negative and were not excited by dimaprit.
Fig 5 illustrates such an analysis of a batch of 9 recorded MPON neurons. All neurons excited by dimaprit (cells 4–9) were Vglut2 positive and H2 receptor positive (Fig 5A). H1 receptor was not detected in any of these neurons. HCN1 and HCN2 were expressed in most MPON neurons (Fig 5B), including all dimaprit responsive neurons (cells 4–9).
Figure 5.
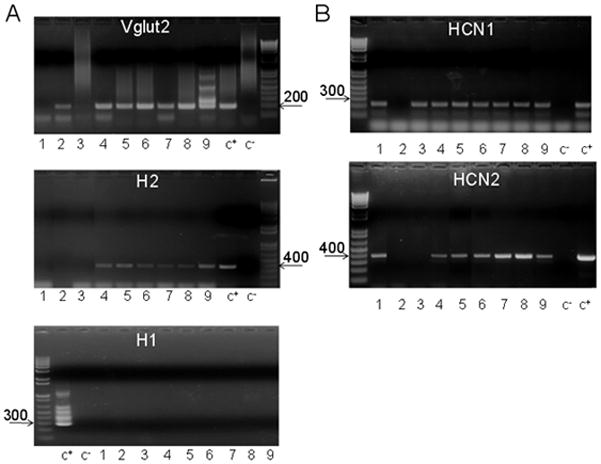
H2, Vglut2, HCN1 and HCN2 transcripts in MPON neurons recorded in slices from transgenic GAD65-GFP mice.
A. Agarose gels illustrating the expression of H2 (upper), Vglut2 (middle) and H1 (lower) in a batch of nine (1–9) recorded MPON neurons. The expected sizes of the PCR products are (in base pairs) 366, 186 and 286, respectively. B. Agarose gels illustrating the expression of HCN1 (up), HCN2 (middle) and HCN3 (lower) in the same neurons as in A. The expected sizes of the PCR products are (in base pairs) 220, 370 and 550, respectively. A,B. Negative (−) control was amplified from a harvested cell without reverse-transcription, and positive control (+) was amplified using 1 ng of hypothalamic mRNA.
3.4. Effects of bilateral intra-MPON injection of histaminergic agonists on core body temperature and motor activity
To assess the effect of histamine on CBT and MA, histamine (100 μM) or aCSF (control) was injected bilaterally in the MPON via two cannulas (see Materials and Methods). The neurotransmitter induced a hyperthermia when injected in the MPON (Fig. 6A top), an effect that was not accompanied by increased motor activity (Fig 6A, bottom), suggesting that it was due to changes in thermoregulation. In contrast, aCSF injections (0.2 μl, control) did not result in hyperthermia. The response to histamine was statistically different when compared to the control (two-way repeated measures ANOVA, P<0.01).
Figure 6.

Responses to bilateral intra-MPON injection of histamine receptor agonists.
A.Intra-MPON injection of histamine (60 μM, 0.2 μl) induced hyperthermia (upper panel) and did not affect motor activity (MA)(lower panel). In contrast vehicle (aCSF) injection was without effect on CBT. The CBT response to histamine was significantly different when compared with the one to aCSF (two-way repeated measures ANOVA, followed by t-tests for each time point, P<0.01). B. Intra-MnPO injection of H2 receptor agonist dimaprit (10 μM, 0.2 μL) induced hyperthermia (upper panel) and did not affect motor activity (MA)(lower panel). Similarly injection of the histamine N-methyltransferase inhibitor SKF91488 (100 μM, 0.2 μL) resulted in hyperthermia without changes in MA. The CBT responses to dimaprit and SKF91488 were significantly different when compared to the one to aCSF (two-way repeated measures ANOVA, followed by t-tests for each time point, ** P<0.01). B. Intra-MnPO injection of H2 receptor agonist dimaprit (10 μM, 0.2 μL) induced hyperthermia (upper panel) and did not affect motor activity (MA)(lower panel). Similarly injection of SKF91488 (100 μM, 0.2 μL) resulted in hyperthermia without changes in MA.C. Intra-MPON injection of H1 receptor agonist 2-pyridylethylamine (500 μM, 0.2 μL) induced a small hyperthermia with no changes in MA. In contrast, the H3 agonist R-α-methyhistamine (10 μM, 0.2 μL) did not affect either CBT or MA. The CBT responses to the H1 agonist was significantly different when compared to the one to aCSF (two-way repeated measures ANOVA, followed by t-tests for each time point, * P<0.05). A–C. The data points graphs represent averages±S.D. (n=6 mice) through the 10 h recording period. Experiments described in A–C were carried out in different sets of 12 mice.
In order to assess the effect of increasing the concentration of endogenous histamine in the MPON we have injected the histamine N-methyl transferase inhibitor SKF91488 (100 μM, 0.2 μl, bilateral) in a second set of 12 mice. The inhibitor induced a robust hyperthermia with no change in MA (Fig 6B) that was statistically different relative to the control (two-way repeated measures ANOVA, P<0.01). The response was not statistically different from that induced by histamine (two- way repeated measures ANOVA, P >0.3).
To determine the receptor subtypes involved, we then studied the effect of H1-3R subtype-specific agonists. The H2 receptor agonist dimaprit (10 μM, 0.2 μl, bilateral) induced a rapid increase in body temperature that was similar to that induced by SKF91488 with no effect in MA (Fig 6B). The response to dimaprit was not statistically different from that induced by histamine (100 μM) (two way repeated measures ANOVA, P > 0.1) or SKF91488 (two way repeated measures ANOVA, P > 0.2).
Finally, in a third set of 12 mice we have studied the effects of the H1 receptor agonist 2-pyridylethylamine (300 μM) and of the H3 receptor agonist R-α-methylhistamine (10 μM). The H3 agonist had no effect on CBT or MA while the H1 receptor agonist induced a small hyperthermia and no effect on MA (Fig 6B). Similar results were obtained in a fourth group of 12 mice when the H2 agonist amthamine (10 μM) and the H1 agonist betahistine (800 μM) were injected bilaterally. Fig 7 summarizes the CBT effect for all the histamine receptor agonists studied.
Figure 7.

Average CBT in response to bilateral intra-MPON injection of histamine receptor agonists. Bar chart provides 4 hours averages (the interval 2–6 hours) ± S.D. for each treatment. (* P<0.05, ANOVA Kruskal-Wallis with Dunn’s post test).
4. Discussion
4.1. Effect of intra-MPON histamine on CBT
We report here that in mice, as reported for other species (Colboc et al., 1982; Gatti and Gertner, 1984; Green et al., 1976), an increase in intra-MPON histamine induced hyperthermia. Activation of H2 receptors in the MPON accounted for most of the effect with also a smaller contribution from the activation of H1 receptors. In contrast, activation of H3 receptors in the MPON was without effect on CBT. Neither histamine nor H2 receptor specific agonists induced hypothermia (Bugajski and Zacny, 1981) in our experiments, suggesting that other sites may be involved in this effect. In a previous study we have found that in the median preoptic nucleus histamine induces hyperthermia by activation of H1 and H3 receptors, with no contribution of H2 receptors (Lundius et al., 2010). These contrasting findings further strengthen the view that the two preoptic nuclei (median and medial) play complementary but distinct roles in the control of thermoregulation and that their neurons may be subject to differential modulation mechanisms (Nakamura et al., 2009; Tanaka et al., 2011; Yoshida et al., 2009).
4.2. Cellular mechanisms of histamine actions at MPON neurons
Local application of histamine increased the firing activity of MPON glutamatergic neurons (as indicated by detection of Vglut2 transcripts using single cell RT/PCR) but did not influence the activity of GABAergic neurons. The effect was blocked by the H2 receptor antagonist tiotidine and mimicked by the H2 receptor dimaprit, in most MPON glutamatergic neurons indicating the role played by this receptor subtype. In the remaining MPON glutamatergic neurons excited by histamine the effect could be blocked by an H1 antagonist. The fact that the H1 receptor-dependent effects were observed only in very few MPON neurons prevented us from studying further these effects. The increase in firing rate induced by H2 receptor activation was associated with a small depolarization. In voltage clamp recordings dimaprit activated an inward current that persisted in TTX and was fully abolished by the ZD7288 a specific blocker of Ih. The activation of H2 receptors did not affect the characteristics (frequency, amplitude, kinetics) of spontaneous or action potential-dependent synaptic currents further suggesting that the mechanism involved is postsynaptic. The agonist increased the amplitude of Ih elicited by hyperpolarizing voltage steps and shifted the voltage–dependence of activation. While in most neuronal preparations activation of H2 receptors increases excitability by inhibiting K currents (Atzori et al., 2000; Greene and Haas, 1990; Munakata and Akaike, 1994) a very similar mechanism involving Ih was reported in geniculate relay neurons (McCormick and Williamson, 1991). The current activates at voltage steps more negative than −50 mV and, accordingly, we found small tonic currents at a holding potential of −60 mV. Since the resting membrane potential of MPON glutamatergic neurons was in the range −56 to −64 mV it is likely that Ih is tonically active, as indicated by the apparent outward current induced by ZD7288. Given the relatively high input resistance of MPON glutamatergic neurons (350–400 MOmega;), an increase in a tonic inward current of 5–10 pA in response to dimaprit would result in 2–4 mV depolarization, sufficient to induce a large increase in spontaneous firing activity.
In MPON neurons excited by dimaprit the kinetics of Ih was fast (time to peak less than 250 ms) and single cell RT/PCR studies indicated the presence of both HCN1 and HCN2 transcripts. The kinetics and voltage-dependence of the currents are in agreement with the properties of HCN1+HCN2 channels in heterologous expression systems (Chen et al., 2001). Ih was sensitive to elevations of the cAMP level and that dimaprit had no further effect in these experiments. These results suggest that H2 signaling in MPON neurons, as in most preparations, is positively coupled to the adenylate cyclase (Haas et al., 2008). It is interesting to note that all H2 positive neurons expressed both HCN1 and HCN2 subunits, the latter conferring cAMP-sensitivity to Ih (Chen et al., 2001). We also found MPON neurons that displayed no Ih, or one with very slow kinetics. In the latter neurons we detected either HCN2 or HCN4 transcripts only. The respective neurons were H2 negative, and the currents were not affected by dimaprit.
4.3. Implications for the thermoregulatory networks
Previous studies have shown that GABAergic neurons from both the medial and median preoptic nuclei project to thermoregulatory centers, such as the dorsomedial hypothalamus and the rostral raphe pallidus (for a review see (Morrison et al., 2008)). Activation of H2 receptors did not affect the firing rate of identified GABAergic preoptic neurons but depolarized and increased the firing rate of a population (38 %) of glutamatergic neurons. These results indicate that H2 receptors are present only on MPON glutamatergic neurons, result that was confirmed using single-cell RT/PCR. Little is known about the local neuronal networks comprising PO/AH neurons involved in thermoregulation. Local application of H2 receptor agonist did not change the frequency of sEPSCs recorded in MPON neurons (GFP positive or GFP negative) in slices, which suggests sparse local projections of the H2-positive glutamatergic neurons. These results suggest that MPON glutamatergic neurons control at least one thermoregulatory mechanism without having the MPON GABAergic neurons as intermediate. Indeed, if MPON GABAergic projection neurons were excited by H2 activation (directly or via activation of presynaptic neurons), one would expect a decrease in CBT, i.e. the opposite effect to that observed. Our data provide, in line with other recent studies (Dimitrov et al., 2011; Lundius et al., 2010; Tanaka et al., 2011), further evidence for the role of a PO/AH glutamatergic output in the control of thermoregulation.
Highlights.
Histamine excites MPON glutamatergic neurons by activating H2 subtype receptors
H2 specific agonists induce depolarization by increasing Ih
Ih is conducted by HCN1 and HCN2 subunits
Histamine and H2 specific agonists infused in the MPON induce hyperthermia
Acknowledgments
This work was supported by National Institutes of Health Grant NS060799 (I.V.T.).
Abbreviations
- CBT
core body temperature
- eGFP
enhanced green fluorescent protein
- GAD65
glutamic acid decarboxylase 65
- HCN
hyperpolarization-activated cyclic nucleotide-gated channel
- Ih
hyperpolarization activated cationic current
- MA
motor activity
- MPON
medial preoptic nucleus
- PO/AH
preoptic area/anterior hypothalamus
- Vglut2
vesicular glutamate transporter 2
Footnotes
Authors contributions: IVT designed and supervised the study. IVT, MS-A and JS carried out experiments and analyzed data. IVT wrote the manuscript.
References
- Atzori M, Lau D, Tansey EP, Chow A, Ozaita A, Rudy B, McBain CJ. H2 histamine receptor-phosphorylation of Kv3.2 modulates interneuron fast spiking. Nat Neurosci. 2000;3:791–798. doi: 10.1038/77693. [DOI] [PubMed] [Google Scholar]
- Bali B, Erdelyi F, Szabo G, Kovacs KJ. Visualization of stress-responsive inhibitory circuits in the GAD65-eGFP transgenic mice. Neurosci Lett. 2005;380:60–65. doi: 10.1016/j.neulet.2005.01.014. [DOI] [PubMed] [Google Scholar]
- Bugajski J, Zacny E. The role of central histamine H1-and H2-receptors in hypothermia induced by histamine in the rat. Agents Actions. 1981;11:442–447. doi: 10.1007/BF02004704. [DOI] [PubMed] [Google Scholar]
- Chen S, Wang J, Siegelbaum SA. Properties of hyperpolarization-activated pacemaker current defined by coassembly of HCN1 and HCN2 subunits and basal modulation by cyclic nucleotide. J Gen Physiol. 2001;117:491–504. doi: 10.1085/jgp.117.5.491. [DOI] [PMC free article] [PubMed] [Google Scholar]
- Colboc O, Protais P, Costentin J. Histamine-induced rise in core temperature of chloral-anaesthetized rats: mediation by H2-receptors located in the preopticus area of hypothalamus. Neuropharmacology. 1982;21:45–50. doi: 10.1016/0028-3908(82)90209-x. [DOI] [PubMed] [Google Scholar]
- Dimitrov E, Kim Y, Usdin TB. Tuberoinfundibular peptide of 39 residues modulates the mouse hypothalamic-pituitary-adrenal axis via paraventricular glutamatergic neurons. J Neurosci. 2011;518:4375–4394. doi: 10.1002/cne.22462. [DOI] [PMC free article] [PubMed] [Google Scholar]
- Gatti PJ, Gertner SB. The effect of intrahypothalamic injection of homodimaprit on blood pressure. Neuropharmacology. 1984;23:663–670. doi: 10.1016/0028-3908(84)90148-5. [DOI] [PubMed] [Google Scholar]
- Green MD, Cox B, Lomax P. Sites and mechanisms of action of histamine in the central thermoregulatory pathways of the rat. Neuropharmacology. 1976;15:321–324. doi: 10.1016/0028-3908(76)90136-2. [DOI] [PubMed] [Google Scholar]
- Greene RW, Haas HL. Effects of histamine on dentate granule cells in vitro. Neuroscience. 1990;34:299–303. doi: 10.1016/0306-4522(90)90140-y. [DOI] [PubMed] [Google Scholar]
- Haas H, Panula P. The role of histamine and the tuberomamillary nucleus in the nervous system. Nat Rev Neurosci. 2003;4:121–130. doi: 10.1038/nrn1034. [DOI] [PubMed] [Google Scholar]
- Haas HL, Sergeeva OA, Selbach O. Histamine in the nervous system. Physiol Rev. 2008;88:1183–1241. doi: 10.1152/physrev.00043.2007. [DOI] [PubMed] [Google Scholar]
- Hong ST, Bang S, Paik D, Kang J, Hwang S, Jeon K, Chun B, Hyun S, Lee Y, Kim J. Histamine and its receptors modulate temperature-preference behaviors in Drosophila. J Neurosci. 2006;26:7245–7256. doi: 10.1523/JNEUROSCI.5426-05.2006. [DOI] [PMC free article] [PubMed] [Google Scholar]
- Leger JP, Mathieson WB. Development of bombesin-like and histamine-like innervation in the bullfrog (Rana catesbeiana) central nervous system. Brain Behav Evol. 1997;49:63–77. doi: 10.1159/000112982. [DOI] [PubMed] [Google Scholar]
- Lundius EG, Sanchez-Alavez M, Ghochani Y, Klaus J, Tabarean IV. Histamine influences body temperature by acting at H1 and H3 receptors on distinct populations of preoptic neurons. J Neurosci. 2010;30:4369–4381. doi: 10.1523/JNEUROSCI.0378-10.2010. [DOI] [PMC free article] [PubMed] [Google Scholar]
- McAllen RM, Tanaka M, Ootsuka Y, McKinley MJ. Multiple thermoregulatory effectors with independent central controls. Eur J Appl Physiol. 2010;109:27–33. doi: 10.1007/s00421-009-1295-z. [DOI] [PubMed] [Google Scholar]
- McCormick DA, Williamson A. Modulation of neuronal firing mode in cat and guinea pig LGNd by histamine: possible cellular mechanisms of histaminergic control of arousal. J Neurosci. 1991;11:3188–3199. doi: 10.1523/JNEUROSCI.11-10-03188.1991. [DOI] [PMC free article] [PubMed] [Google Scholar]
- Morrison SF, Nakamura K, Madden CJ. Central control of thermogenesis in mammals. Exp Physiol. 2008;93:773–797. doi: 10.1113/expphysiol.2007.041848. [DOI] [PMC free article] [PubMed] [Google Scholar]
- Munakata M, Akaike N. Regulation of K+ conductance by histamine H1 and H2 receptors in neurones dissociated from rat neostriatum. J Physiol. 1994;480 ( Pt 2):233–245. doi: 10.1113/jphysiol.1994.sp020356. [DOI] [PMC free article] [PubMed] [Google Scholar]
- Nakamura Y, Nakamura K, Morrison SF. Different populations of prostaglandin EP3 receptor-expressing preoptic neurons projectto two fever-mediating sympathoexcitatory brain regions. Neuroscience. 2009;161:614–620. doi: 10.1016/j.neuroscience.2009.03.041. [DOI] [PMC free article] [PubMed] [Google Scholar]
- Paxinos G, Franklin BJ. The mouse brain in stereotaxic coordinates. Academic; San Diego: 2001. [Google Scholar]
- Tabarean IV, Behrens MM, Bartfai T, Korn H. Prostaglandin E2-increased thermosensitivity of anterior hypothalamic neurons is associated with depressed inhibition. Proc Natl Acad Sci U S A. 2004;101:2590–2595. doi: 10.1073/pnas.0308718101. [DOI] [PMC free article] [PubMed] [Google Scholar]
- Tabarean IV, Korn H, Bartfai T. Interleukin-1beta induces hyperpolarization and modulates synaptic inhibition in preoptic and anterior hypothalamic neurons. Neuroscience. 2006;141:1685–1695. doi: 10.1016/j.neuroscience.2006.05.007. [DOI] [PubMed] [Google Scholar]
- Tanaka M, McKinley MJ, McAllen RM. Preoptic-raphe connections for thermoregulatory vasomotor control. J Neurosci. 2011;31:5078–5088. doi: 10.1523/JNEUROSCI.6433-10.2011. [DOI] [PMC free article] [PubMed] [Google Scholar]
- Wada H. From biochemistry to pharmacology: the histaminergic neuron system in the brain. Nippon Yakurigaku Zasshi. 1992;99:63–81. doi: 10.1254/fpj.99.63. [DOI] [PubMed] [Google Scholar]
- Yoshida K, Li X, Cano G, Lazarus M, Saper CB. Parallel preoptic pathways for thermoregulation. J Neurosci. 2009;29:11954–11964. doi: 10.1523/JNEUROSCI.2643-09.2009. [DOI] [PMC free article] [PubMed] [Google Scholar]