

Summary
Although studied extensively, designing highly accurate protein energy potential is still challenging. A lot of knowledge-based statistical potentials are derived from the inverse of the Boltzmann law and consist of two major components: observed atomic interacting probability and reference state. These potentials mainly distinguish themselves in the reference state and use a similar simple counting method to estimate the observed probability, which is usually assumed to correlate with only atom types. This paper takes a rather different view on the observed probability and parameterizes it by the protein sequence profile context of the atoms and the radius of the gyration, in addition to atom types. Experiments confirm that our position-specific statistical potential outperforms currently the popular ones in several decoy discrimination tests. Our results imply that in addition to reference state, the observed probability also makes energy potentials different and evolutionary information greatly boost performance of energy potentials.
Introduction
Millions of protein sequences are publicly available, but a large percentage of them are lack of solved structures, which are essential to the understanding of their molecular mechanisms and to many important applications. To elucidate the structure and function of a protein, it often requires an accurate physics-based or knowledge-based potential to quantify interactions among residues or atoms. Previous studies(Bradley et al., 2005; Skolnick, 2006) indicate that knowledge-based statistical potentials(Lu et al., 2008; Miyazawa and Jernigan, 1985; Shen and Sali, 2006; Simons et al., 1997; Sippl, 1990; Tanaka and Scheraga, 1976; Zhang and Zhang, 2010; Zhou and Zhou, 2002) compare favorably to physics-based potentials(Brooks et al., 2009; Bryngelson et al., 1995; Case et al., 2005; Dill, 1985, 1997; Dobson et al., 1998; Schuler et al., 2001; Shakhnovich, 2006) in many applications including ab initio folding(Jones and Thirup, 1986; Kihara et al., 2001 Levitt, 1992; Simons et al., 1997; Wu et al., 2007a; Zhao et al., 2008; Zhao et al., 2010), docking(Zhang et al., 1997), binding(Kortemme and Baker, 2002; Laurie and Jackson, 2005), mutation study(Gilis and Rooman, 1996, 1997), decoy ranking(Bauer and Beyer, 1994; Casari and Sippl, 1992; Gatchell et al., 2000; Hendlich et al., 1990; Samudrala and Moult, 1998; Simons et al., 1999; Vendruscolo et al., 2000) and protein model quality assessment(Jones and Thornton, 1996; Panchenko et al., 2000; Peng and Xu, 2010; Reva et al., 1997; Sippl, 1993). Knowledge-based statistical potentials extract interactions directly from the solved protein structures in PDB(Kouranov et al., 2006) and are simpler and easier to use than physics-based potentials. A lot of statistical potentials have been developed including the widely-used DOPE(Shen and Sali, 2006) and DFIRE(Zhou and Zhou, 2002). Some statistical potential quantify local atomic interactions (e.g., torsion angle potential) while others capture non-local atomic interactions (e.g., distance-dependent potential).
A lot of statistical potentials are derived from the inverse of the Boltzman law. In the traditional position-independent distance-dependent statistical potentials (e.g., DOPE and DFIRE), the interaction potential of two atom types a and b can be estimated as follows.
| (1) |
Where k is the Boltzman constant, T is the temperature, and d represents the inter-atom distance shell [d,d + Δd]. Meanwhile, P(d | a,b) is the observed probability of two atoms interacting within the distance shell and q(d) is the reference state (i.e., the expected probability of two noninteracting atoms within the distance shell). The reference state is used to rule out the average and generic correlation of two atoms not due to atomic interactions. Most statistical potentials parameterize the observed atomic interacting probability by (residue-specific) atom types and use a simple counting method to estimate it. For example, P(d | a,b) in Eq. (1) is often calculated by where count(d,a,b) is the number of observed occurrences of two atoms a and b within a distance shell [d,d + Δd]. The distance-dependent statistical potentials developed so far mainly differ from one another in estimating the reference state(Shen and Sali, 2006; Wu et al., 2007b; Zhang and Zhang, 2010; Zhou and Zhou, 2002). Some (e.g., DFIRE and DOPE) use analytical methods to estimate the reference state while others use statistical methods (e.g., KBP(Lu and Skolnick, 2001) and RAPDF(Samudrala and Moult, 1998)). Although using different reference states, these potentials do not have very different energy curves (see Figure 2 in the RW paper(Zhang and Zhang, 2010) and Figure 4 in the DOPE paper(Shen and Sali, 2006)). These traditional position-independent potentials share a couple of common properties: 1) once the atom distance and types are given, the atomic interaction potential is fixed across all proteins and residues; and 2) the atomic interaction potentials approach to 0 when the distance is larger than 8Å.
Figure 2.

An example probabilistic neural network, in which Si and Sj are the sequence profile contexts centered at the ith and jth residues, respectively. and are the neurons in the 1st and 2nd hidden layers.
This paper presents a novel protein-specific and position-specific statistical potential EPAD. We parameterize the observed probability in EPAD by the evolutionary information and radius of gyration of the protein under consideration, in addition to atom types. EPAD distinguishes itself from others in that it may have different energy profiles for two atoms of given types, depending on the protein under consideration and the sequence profile context of the atoms (i.e., evolutionary information). Evolutionary information has been extensively used in protein secondary structure prediction(Jones, 1999; Wang et al., 2011), fold recognition(Maiorov and Crippen, 1992; Panchenko et al., 2000; Peng and Xu, 2009, 2010; Sippl and Weitckus, 1992; Skolnick et al., 2000), protein alignment(Notredame et al., 2000; Pei et al., 2008; Wu and Zhang, 2008b; Xu, 2005; Zhang and Skolnick, 2005), model quality assessment(Jones and Thornton, 1996; Panchenko et al., 2000; Peng and Xu, 2010; Reva et al., 1997; Sippl, 1993) and even protein conformation sampling(Bystroff et al., 2000; Simons et al., 1997; Zhao et al., 2008; Zhao et al., 2010). However, evolutionary information is rarely used to design a statistical potential suitable for ab initio protein folding. Panjkovich et al have developed a structure-specific statistical potential using evolutionary information for the assessment of comparative models(Panjkovich et al., 2008). Nevertheless, this potential is not position-specific and subject to a couple of restrictions: 1) it requires the knowledge of at least one native structure in a protein family, so it cannot be applied to ab initio folding a protein with novel fold or to the assessment of models built from distantly-related templates; and 2) it requires at least 50 sequence homologs for sufficient statistics. By contrast, our statistical potential is not subject to such restrictions and thus, is more widely applicable. We term our statistical potential as evolutionary pairwise distance-dependent potential (EPAD).
Experimental results show that our position-specific statistical potential outperforms currently many popular ones in several decoy discrimination tests. These results imply that in addition to reference state, the observed atomic interacting probability is also critical to statistical potentials and can be estimated much more accurately using context-specific evolutionary information.
Results and Discussion
Overview
Let ai and aj denote two atoms of two residues at positions i and j, respectively. Let Si and Sj denote position-specific sequence profile contexts at positions i and j, respectively (see section Method for the definition of sequence profile contexts). Our distance-dependent statistical potential is defined as follows.
| (2) |
where k is the Boltzman constant and T is the temperature, q(d | rg) is the reference state, and P(d | ai,aj,Si,Sj,rg) is the observed probability of two atoms ai and aj interacting within a distance shell [d,d + Δd] conditioned on atom types, residue sequence profile contexts and rg (the estimated radius of gyration of the protein under consideration). We use rg = 2.2N0.38 to estimate the radius of gyration where N is the protein sequence length. Comparing to Eq. (1), our statistical potential differs from the traditional position-independent potentials (e.g., DOPE and DFIRE) in a couple of aspects. First, the interaction potential of two atoms is protein-specific since it depends on the evolutionary information and radius of gyration of the protein under consideration. Second, our potential is position-specific since it is parameterized by sequence profile contexts in addition to atom types. We use the same reference state as DOPE(Shen and Sali, 2006), which is a finite sphere of uniform density with appropriate radius. That is, the reference state depends on only the size of a sample protein structure (see SI Methods for more details).
We cannot use the simple counting method to calculate P(d | ai,aj,Si,Sj,rg) since there are insufficient number of solved protein structures in PDB for reliable simple counting of sequence profile contexts Si and Sj. Instead, we apply a probabilistic neural network (PNN) (Specht, 1990) to estimating P(d | ai,aj,Si,Sj,rg) when both ai and aj and Cα atoms. PNN will effectively learn the sophisticated relationship between inter-atom distance and sequence profiles and yield accurate distance probability distribution. We then estimate P(d | ai,aj,Si,Sj,rg) for non-Cα atoms conditioned upon Cα distance distribution.
Distance dependence of the statistical potentials
To examine the difference between our potential EPAD and the popular DOPE, we plot the potentials as a function of inter-atom distance for two atom pairs, as shown in Fig. 1. Fig. 1(a) shows the DOPE interaction potential for the atom pair ALA Cα and LEU Cα and also the EPAD interaction potential for this pair in three different positions of protein 1gvp. DOPE has the same energy curve for this atom pair regardless of its sequence positions. In particular, DOPE always has a favorable potential when the distance of this pair of atoms is between 5 and 7Å and has an interaction potential close to 0 when the distance is larger than 8.0Å. By contrast, EPAD has one unique energy curve for this atom pair for each position. The figure legend indicates the corresponding native distances (Å) between atom ALA Cα and atom LEU Cα at the three different sequence positions. For example, the bottom curve in Fig. 1(a) visualizes the EPAD interaction potential for the ALA Cα and LEU Cα pair with native distance 8.31Å. This curve shows that when the distance between ALA Cα and LEU Cα is close to the native, their EPAD interaction potential is favorable. In fact, EPAD always has a favorable potential for these three ALA Cα and LEU Cα pairs when their distances are close to the natives.
Figure 1.

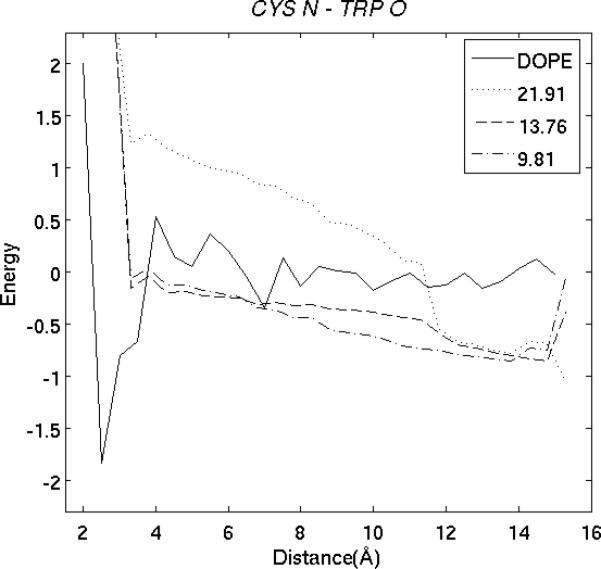
Distance dependence of DOPE and our potential EPAD. (A) The solid curve shows the DOPE interaction potential for atom Cα in ALA and atom Cα in LEU. The other 3 curves show the EPAD potentials for the same atom pair in three different positions of protein 1gvp. The legend shows the native distances of this atom pair in these positions. (B) The curves show the DOPE and EPAD potential for atom N in Cys and atom O in Trp in three different proteins of 1b3a, 1bkr and 1ptq.
Fig. 1(b) compares the EPAD and DOPE interaction potentials for another atom pair Cys N and Trp O in three different proteins of 1b3a, 1bkr and 1ptq. Similar to Fig. 1(a), EPAD has different interaction potentials for the same atom pair in three different proteins while DOPE has the same potential across all proteins. In particular, EPAD has a favorable potential when the distance between Cys N and Trp O is close to the native. Nevertheless, DOPE has a favorable potential when their distance is between 2 and 4Å and a potential close to 0 when the distance is >8.0Å.
In summary, our statistical potential EPAD is significantly different from currently popular potentials such as DOPE and DFIRE. DOPE, DFIRE, RAPDF and RW have more or less similar energy profiles for atom pairs of the same type. The difference between EPAD and any of DOPE, DFIRE, RAPDF and RW is much larger than that among DOPE(Shen and Sali, 2006), DFIRE(Zhou and Zhou, 2002), RAPDF(Samudrala and Moult, 1998) and RW(Zhang and Zhang, 2010).
Performance on decoy discrimination
We test our backbone-based potential EPAD on several decoy sets including the Rosetta set(Qian et al., 2007), the CASP9 models, the I-TASSER dataset(Zhang and Zhang, 2010), the CASP5-8 dataset(Rykunov and Fiser, 2010) and the Decoy ‘R’ Us (Samudrala and Levitt, 2000) set as well as an in-house large set of template-based models. We evaluate EPAD and several others DOPE, DFIRE, OPUS(Lu et al., 2008) and RW(Zhang and Zhang, 2010) using five performance metrics including the number of correctly-identified natives, the ranking of the native structures, the Z-score of the native energy, the model quality of the first-ranked decoys and the Pearson correlation coefficient (Pearson CC) between the energy and the model quality. The first three metrics evaluate how well a statistical potential can differentiate natives from decoys. The Pearson CC is more important when we want to apply the potentials to folding a protein sequence. We evaluate the model quality of a decoy using the widely-used GDT (Zemla, 2003; Zemla et al., 1999, 2001), which compares a decoy with its native and generates a quality value between 0 and 100. The higher the GDT, the better quality the decoy has.
Performance on the 2007 Rosetta dataset
The set contains decoys generated and refined by the popular fragment assembly ab initio folding program Rosetta(Qian et al., 2007) for 58 proteins. To evaluate our potential in a more realistic setting, for each protein we use only the 100 low-quality decoys in the set, excluding the high-quality decoys. The average GDT of the best decoys is about 60. As shown in Table 1, our EPAD, which currently considers only backbone atoms, correctly identifies 34 native structures with the lowest Z-score (-2.46), while two full-atom potentials DOPE and DFIRE can identify only 21 natives. EPAD also exceeds DFIRE and DOPE in terms of the average ranking of the native structures (15.70 vs. 23.71 and 21.59). In terms of the average per-target Pearson correlation coefficient (CC) between the energy and GDT, EPAD (-0.42) is significantly better than DOPE (-0.32) and DFIRE (-0.25). EPAD also exceeds RW by all the 5 metrics.
Table 1.
Performance of EPAD and several popular full-atom statistical potentials on the Rosetta decoy set.
| EPAD | DOPE | DFIRE | OPUS | RW | EPAD2 | |
|---|---|---|---|---|---|---|
| #natives identified | 34 | 21 | 21 | 39 | 21 | 46 |
| ranking of native | 15.7 | 23.7 | 21.6 | 9.8 | 23.9 | 13.4 |
| first-ranked GDT | 51.6 | 49.7 | 49.4 | 49.7 | 48.5 | 52.4 |
| Pearson CC | -0.42 | -0.32 | -0.25 | -0.20 | -0.32 | -0.39 |
| Z-score | -2.46 | -1.61 | -1.67 | -3.27 | -1.51 | -3.28 |
Numbers in bold indicate the best performance. The per-target Pearson CC is calculated between the energy and GDT and then the average value is reported in the table.
EPAD compares favorably to OPUS-PSP, a full-atom statistical potential. OPUS can correctly identify many more native structures than EPAD, but it has a very low Pearson CC to decoy quality, which indicates that OPUS-PSP may not be good for ab initio folding. Since EPAD does not contain side-chain atoms, we simply build a full-atom potential EPAD2 by linearly combining EPAD with the side-chain component in OPUS-PSP (with equal weight). EPAD2 significantly outperforms DOPE, DFIRE, RW and OPUS-PSP by all the 5 metrics. EPAD2 greatly outperforms EPAD in correctly recognizing the native structures, which may imply that side-chain information is very helpful for the identification of the native structures. This trend is also observed on other datasets (e.g., I-TASSER and CASP5-8).
Table 2 compares the performance of several statistical potentials when only Cα atoms are considered in scoring a decoy. Again, EPAD significantly outperforms DOPE, DFIRE and OPUS. EPAD even performs as well as the full-atom potentials DOPE, DFIRE and RW. To excluding the impact of the different datasets used to build EPAD and DOPE, we rebuild a DOPE using the EPAD training data, denoted as MyDope. MyDope performs slightly worse than DOPE, possibly because we do not fine-tune MyDope. However, EPAD performs significantly better than both DOPE and MyDope. This indicates that EPAD outperforms DOPE not due to the training data, but due to the novel methodology.
Table 2.
Performance of EPAD and several popular statistical potentials on the Rosetta decoy sets when only Cα atoms are considered.
| EPAD | DOPE | DFIRE | MyDope | OPUS | |
|---|---|---|---|---|---|
| #natives identified | 33 | 11 | 12 | 10 | 6 |
| Ranking of native | 15.8 | 18. 7 | 30.7 | 21.7 | 55.3 |
| first-ranked GDT | 51.2 | 47.0 | 47.8 | 48.2 | 45.9 |
| Pearson CC | -0.40 | -0.24 | -0.20 | -0.21 | -0.15 |
| Z-score | -2.45 | -1.51 | -0.66 | -1.23 | 0.25 |
Numbers in bold indicate the best performance. MyDope is a re-compiled DOPE using the EPAD training data.
Performance on template-based models
To examine the performance of EPAD on template-based models, we constructed a large set of 3600 protein pairs, denoted as InHouse, with the following properties: 1) any two proteins in a pair share less than 25% sequence identity; 2) all protein classes (i.e., alpha, beta and alpha-beta proteins) are covered by this set; 3) the protein lengths are widely distributed; 4) the structure similarity of two proteins in a pair, measured by TM-score, ranges from 0.5 to 0.8 and is almost uniformly distributed; and 5) within each protein pair, one protein is designated as the target protein and the other as the template protein. Any two target proteins share less than 25% sequence identity. We generated four different target-template alignments for each protein pair using our in-house protein structure alignment program DeepAlign, our two threading programs BoostThreader(Peng and Xu, 2009) and CNFpred and HHpred (Soding, 2005). CNFpred is an improved version of BoostThreader, replacing regression trees in the latter with neural networks and making use of more protein features. Then we used MODELLER (N. Eswar, 2006) to build four different 3D models for each target protein based upon the four alignments, respectively. MODELLER also builds models for the unaligned regions. To remove overlap with the training data, we constructed 4 subsets Set1, Set2, Set3 and Set4 of InHouse as follows. Set1 contains no target proteins sharing >25% sequence identity with the EPAD training proteins. Set2 is a subset of Set1, containing no target proteins sharing >25% sequence identity with the EPAD validation proteins. Set3 contains no target proteins with a BLAST E-value<0.01 with the EPAD training proteins. Set4 is a subset ofSet3, containing no target proteins with a BLAST E-value<0.01 with the EPAD training and proteins. In total, Set1, Set2, Set3 andSet4 contain 1139, 331, 965, and 266 protein pairs, respectively. Table 3 lists the performance of several statistical potentials in identifying the 3D models with the best GDT in the five datasets: InHouse, Set1, Set2, Set3 and Set4. As shown in Table 3, EPAD is able to recognize many more the best template-based models than the others, which are no better than random guess. Further, EPAD has similar performance on the 5 sets, which confirms that our probabilistic neural network (PNN) model is not over-trained. For over 95% of protein pairs in InHouse, the 3D models built from the structure alignments have the best GDT. This implies that except EPAD, the other potentials are not able to differentiate structure alignments from threading-generated alignments.
Table 3.
Performance of EPAD and several popular statistical potentials on the template-based models.
| InHouse | Set1 | Set2 | Set3 | Set4 | |
|---|---|---|---|---|---|
| EPAD | 1903 (53%) | 617 (54%) | 178 (54%) | 514 (53%) | 143 (54%) |
| DOPE | 900 (25%) | 288 (25%) | 82 (25%) | 252 (26%) | 74 (28%) |
| DFIRE | 936 (26%) | 286 (25%) | 86 (26%) | 253 (26%) | 74 (28%) |
| OPUS | 900 (25%) | 289 (25%) | 73 (22%) | 251 (26%) | 69 (26%) |
| RW | 762 (21%) | 248 (22%) | 68 (21%) | 218 (23%) | 60 (22%) |
Only EPAD is a backbone-based potential while the others are full-atom potentials. In each cell, the numbers in and out parenthesis are the number and percentage of correctly-identified models (i.e., models with the lowest energy and the best GDT). Bold numbers indicate the best performance.
Performance on the CASP9 models
To further examine the performance of EPAD, we compile a test set from the CASP9 models submitted by the top 18 servers. We exclude the CASP9 targets with many domains since some servers do not place the models of all the domains in a single coordinate system. These 18 servers are BAKER-ROSETTASERVER(Raman et al., 2009), chunk-TASSER(Zhou et al., 2009), chuo-fams(Kanou et al., 2009), CLEF-Server(Shao et al., 2011), FAMSD(Kanou et al., 2009), gws(Joo et al., 2009), HHpredA(Hildebrand et al., 2009), Jiang_Assembly(Hu et al., 2011), MULTICOM-CLUSTER(Tegge et al., 2009), MULTICOM-NOVEL(Tegge et al., 2009), Pcomb(Larsson et al., 2008), Phyre2(Kelley and Sternberg, 2009), pro-sp3-TASSER(Zhou and Skolnick, 2009), QUARK(Xu et al., 2011), RaptorX(Peng and Xu, 2011), Seok-server(Lee et al., 2010), Zhang-Server(Xu et al., 2011), ZHOU-SPARKS-X(Yang et al., 2011). We do not include the models from RaptorX-MSA, RaptorX-Boost, HHpredB, HHpredC, MULTICOM-REFINE, MULTICOM-CONSTRUCT and Jiang_THREADER since they are not very different from some of the 18 servers. In summary, this CASP9 dataset contains the first models submitted by 18 servers for 92 targets. This set is very challenging for any energy potentials because the models submitted by these top servers have similar quality especially for those not-so-hard targets. The first-ranked models by EPAD, DOPE, DFIRE and RW have an average GDT of 58.6, 55.7, 56.0, and 57.4, respectively. The average Pearson correlation coefficient (between GDT and energy values) for EPAD is -0.364, which is significantly better than DOPE (-0.25), DFIRE (-0.23) and RW (-0.28). Note that RW parameters are fine-tuned using the CASP8 and CASP9 models while EPAD, DOPE and DFIRE are independent of any decoy sets. In addition, EPAD is only a backbone-based potential while the other three are full-atom potentials.
Table 4 shows the performance of EPAD, DOPE, DFIRE and RW with respect to the hardness of the targets, which is judged based upon the average GDT of all the models of this target. We divide the targets into four groups according to the average GDT: <30, 30-50, 50-70, >70. EPAD performs very well across all difficulty levels and has particularly good correlation coefficient for the targets with average GDT less than 30. Even for easy targets EPAD also outperforms the others although it is believed that sequence profiles are not very effective in dealing with easy targets. The only exception is that EPAD has a worse average GDT of the first-ranked models than RW for the targets with average GDT between 30 and 50. This is because RW performs exceptionally well on a single target T0576. The best model identified by RW has GDT 53.3 while EPAD, DOPE and DFIRE can only identify a model with GDT 17.0.
Table 4.
Performance of statistical potentials with respect to the hardness of the CASP9 targets.
| GDT of the first-ranked models | Correlation Coefficient | |||||||
|---|---|---|---|---|---|---|---|---|
| EPAD | DP | DF | RW | EPAD | DP | DF | RW | |
| <30 | 27.4 | 23.1 | 24.1 | 25.8 | 0.44 | 0.28 | 0.23 | 0.33 |
| 30-50 | 42.0 | 40.0 | 40.6 | 42.7 | 0.31 | 0.26 | 0.24 | 0.27 |
| 50-70 | 64.4 | 61.6 | 61.5 | 63.4 | 0.37 | 0.24 | 0.22 | 0.27 |
| >70 | 80.0 | 77.1 | 77.1 | 77.1 | 0.35 | 0.26 | 0.26 | 0.26 |
To save space, DOPE and DFIRE are denoted as “DP” and “DF”, respectively, and we also omit the negative sign of the correlation coefficient. The first column indicates the hardness of the targets, judged by the average GDT of all the models of the target.
Performance on the Decoy ‘R’ Us dataset
The set is taken from http://dd.compbio.washington.edu/, containing decoys for some very small proteins. In terms of the average rank of the native structures EPAD significantly exceeds the others, but EPAD correctly identifies slightly fewer native structures than DOPE and OPUS_PSP, in part because EPAD does not include side-chain atoms. See SI Results for the details.
Performance on the I-TASSER dataset
This set contains decoys for 56 proteins generated by I-TASSER (http://zhanglab.ccmb.med.umich.edu/). The average TMscore of the decoys in this set ranges from 0.346 to 0.678. EPAD outperforms DFIRE and DOPE by 5 measures. EPAD is slightly better than RW in terms of the first-ranked TMscore and the correlation, but slightly worse than RW in terms of the Z-score of the natives. EPAD2 (i.e., the combination of the OPUS-PSP side-chain potential and EPAD) can obtain much better Z-score of the natives although the correlation is slightly decreased. This is consistent with what is observed on the Rosetta set. See SI Results (Table S2) for the details.
Performance on the CASP5-8 dataset
(Rykunov and Fiser, 2010). EPAD is only second to QMEAN6, RW and RWplus in ranking the best models in the absence of the native structures. When the native structures are included, EPAD does not perform as well as when the native structures are not included. EPAD2 outperforms all the others in terms of the average ranking of the best models in the absence of the native structures or the average ranking of the native structures. EPAD2 also performs very well in terms of the number of correctly-identified models (or native structures). These results may further indicate that side-chain information is needed for the accurate identification of the native structures. See SI Results (Table S3) for the details.
Is our probabilistic neural network (PNN) model overtrained?
Our PNN model has 60,000-70,000 parameters to be trained. A natural question to ask is if our PNN model is biased towards some specific patterns in the training data? Can our PNN model be generalized well to proteins of novel folds or sequences? According to our experimental results on contact prediction (see “Window size and the number of neurons in the Supplemental”), our PNN model is not over-trained. In this experiment, we used a training set built before CASP8 started, which are unlikely to have similar folds and sequence profiles with our test set (i.e., the CASP8 and CASP9 free modeling targets). Experimental results indicate that our PNN method compares favorably to the best CASP8 and CASP9 server predictors, which implies that our PNN model is not biased towards the training data. Note that our PNN model for statistical potential uses exactly the same architecture (2 hidden layers with 100 and 40 hidden neurons, respectively) as our PNN model for contact prediction. Considering that much more training data (~73 millions of residue pairs) is used for the derivation of our statistical potential than for contact prediction, it is less likely that our PNN model for statistical potential is biased towards some specific patterns in the training set. The result in Table 3 further confirms this. We use the 25% sequence identify or an E-value 0.01 as the cutoff to exclude proteins in InHouse with similar sequences to the training set and generate two subsets Set2 and Set4. Even if Set2 (Set4) contains some sequence profiles similar to the training set, the similarity between the whole InHouse set and the training set is still much larger than that between Set2 (Set4) and the training set, but the performance on the whole InHouse set is even slightly worse than that on Set2 (Set4).
Conclusion
This paper presents a novel protein-specific and position-specific knowledge-based statistical potential EPAD for protein structure and functional study. EPAD is unique in that it may have different energy profiles for two atoms of given types, depending on the protein under consideration and the sequence profile contexts of the residues containing them, while other potentials have the same energy profile for a given atom pair across all proteins. We achieve this by parameterizing EPAD using evolutionary information and radius of gyration of the protein under consideration in addition to atom types, which enables us to obtain a much more accurate statistical potential.
This paper also makes a novel technical contribution to estimating the observed atomic interacting probability by introducing a probabilistic neural network to calculate the inter-atom distance probability distribution from sequence profiles and the radius of gyration. This is very different from the simple counting method widely used to derive the position-independent statistical potentials such as DOPE and DFIRE. The simple counting method does not work for our potential simply because there is not enough number of solved protein structures in PDB for reliable counting of sequence profile contexts.
Experimental results indicate that EPAD significantly outperforms several popular higher-resolution full-atom potentials in several decoy discrimination tests even if only backbone atoms are considered in EPAD. If we combine EPAD with the side-chain component in OPUS-PSP, we can achieve much better decoy discrimination performance especially in the presence of native structures. As opposed to the RW potential and many others, EPAD is not trained by any decoys, so in principal it is not restricted to any decoy generation method. Currently EPAD uses only 1Å resolution for the Cα-Cα distance discretization. We will further improve EPAD by using a 0.5Å resolution, but this will take a very long time to train a neural network model for accurate estimation of the extremely unbalanced distance probability distribution.
We will continue to extend our statistical potential as follows. Currently EPAD considers only backbone atoms and is also orientation-independent. In the future, we will extend it to side-chain atoms and also make it orientation-dependent. Second, in estimating the distance probability distribution of two positions, we use only sequence profile contexts relevant to only these two positions. We shall also use information in the sequence segment connecting the two residues, which contains important information in determining the relative orientation of the two residues. Thirdly, we may also estimate the distance probability distribution more accurately by adding some physical constraints. For example, given any three atoms in a protein, their pairwise distances must satisfy the triangle inequality. Further, for any three residues which are close to one another along the primary sequence, their Cα distances are also subject to the restriction of local atomic interaction. If we assume that there is a contact between two residues if their Cα or Cβ atoms are within 8Å, then the number of contacts for any given residue is limited by a constant (~13) due to geometric restraint. By enforcing these constraints, we shall be able to estimate the inter-atom distance probability distribution much more accurately and thus, design a much better statistical potential.
Experimental Procedures
Estimating pairwise Cα distance distribution using probabilistic neural network (PNN)
We discretize all the Cα-Cα distance into 13 bins (3~4Å, 4-5Å, 5-6Å, ..., 14-15Å, and >15Å). Given a protein and its kth residue pair of two residues i and j, let dk denote the bin into which the distance of the kth residue pair falls into, and xk the position-specific feature vector, which contains sequence profile contexts Si and Sj centered at the two residues i and j under consideration and the estimated radius of gyration of the protein under consideration.
Let S denote the sequence profile of the protein under consideration. It is generated by running PSI-BLAST on the NR database with at most 8 iterations and E-value 0.001. S is a position-specific scoring matrix with dimension 20×N where N is the sequence length. Each column in S is a vector of 20 elements, containing the mutation potential to the 20 amino acids at the corresponding sequence position. The sequence profile context of the residue at sequence position i is a 20×15 submatrix of S, consisting of 15 columns i-7, i-6, ..., i, i+1, ..., i+7. In case that one column does not exist in S (when i≤7 or i+7>N), the zero vector is used.
We always use rg = 2.2N0.38 to estimate the radius of gyration for one protein where N is the protein sequence length. That is, rg is independent of any 3D models including the native structure. We do not use rg specific to a decoy because our training set does not contain any decoys. We do not use rg calculated from the native structures either because in the realistic settings they are unavailable.
Let pθ (dk|xk) be the probability of the distance label dk conditioned on the feature vector xk. Meanwhile, θ is the model parameter vector. We estimate pθ (dk|xk) as follows.
| (3) |
where is the partition function and ϕθ (x, d) is a two-layer neural network. Figure 2 shows an example of the neural network with three and five neurons in the first and second hidden layers, respectively. Each neuron represents a sigmoid function h(x) = 1/(1 + exp(x)). Therefore, we have
| (4) |
Where G1 and G2 are the number of gates in the two hidden layers, < .,. > denotes the inner product of two vectors, is the weight vector of the neuron (also known as gate) in the 2nd layer; is the weight connecting the neuron in the 2nd to the neuron in the 1st layer; and is the weight connecting the neuron in the 1st layer to the label dk.
In the implementation, our neural network consists of two hidden layers. The first hidden layer (i.e., the layer connecting to the input layer) contains 100 neurons and the second hidden layer (i.e., the layer connecting to the output layer) has 40 neurons. This neural network is similar to what is used by the Zhou group for inter-residue contact prediction(Xue et al., 2009), which uses 100 and 30 neurons in the two hidden layers, respectively. The Zhou group has shown that using two hidden layers can obtain slightly better performance than using a single hidden layer. The input layer of our network has about 600 neurons, so in total our neural network has between 60,000 and 70,000 parameters to be trained.
Model parameter training
We use the maximum likelihood method to train the model parameter θ and to determine the window size and the number of neurons in each hidden layer, by maximizing the occurring probability of the native Cα-Cα distance in a set of training proteins. Given a training protein t with solved experimental structure, let Dt denote the set of pairwise residue distances and Xt the set of all feature vectors. By assuming any two residue pairs to be independent of one another, we have
| (5) |
where mt is the number of residue pairs in the protein t.
Given T training proteins, we need to maximize , which is equivalent to the following optimization problem.
| (6) |
Meanwhile, is a L2 -norm regularization item to avoid overfitting and λ is a hyper-parameter to be determined. This optimization problem can be solved by LBFGS(Liu and Nocedal, 1989).
It is very challenging to solve this non-convex optimization problem due to the huge amount of training data. We generate an initial solution randomly and then run the training algorithm on a supercomputer for about a couple of weeks. Our training algorithm terminates when the probability of either the training set or the validation set does not improve any more. Note that all the model parameters are learned from the training set, but not the validation set. The validation set, combined with the training set, is only used to determine when our training algorithm shall terminate. Our training algorithm usually terminates after 3000 iterations. We also reran our training algorithm starting from 9 initial solutions and did not observe explicit performance difference among these runs.
Training and validation data
We use the PDB25 set of the PISCES server (Wang and Dunbrack, 2003) early in 2011 as the training and validation data. Any two proteins in PDB25 share no more than 25% sequence identity. Such a set in total includes more than 6000 proteins. We randomly chose about 5000 proteins from this PDB25 set as the training and validation proteins and also make sure that they have no overlap (i.e., > 25% sequence identity) with the Rosetta set (Qian et al., 2007) and the Decoy ‘R’ Us set (Samudrala and Levitt, 2000). We randomly choose 3/4 of the 5000 proteins as the training data and the remaining 1/4 as the validation data, which contain ~73 million training and ~19 million validation residue pairs, respectively. It is challenging to train our neural network model because 1) the number of training residue pairs is huge; and 2) the distance distribution is extremely unbalanced. As shown in Fig. S3, 90% of residue pairs have Cα distance larger than 15Å and only 1% of them have Cα distance less than 4Å. It takes a couple of weeks to train a single neural network model using 1296 CPUs on a Cray supercomputer.
Estimating inter-atom distance distribution for non-Cα main chain atoms
We discretize the inter-atom distance of non-Cα atoms into 26 equal-width bins, each with 0.5Å. Due to limited computation resources, instead of training neural network models for each pair of atom types, which will take months or even a year to finish, we use a different approach to estimate the pairwise distance probability distribution for non-Cα main chain atoms. In particular, we calculate the inter-atom distance probability distribution for non-Cα main chain atoms conditioned upon Cα-Cα distance probability distribution. Let Pαα (dαα | Si,Sj,rg) denote the Cα-Cα distance probability distribution for residues i and j, which can be estimated by our probabilistic neural network. Let a and b denote the amino acid types of the residues at i and j, respectively. For the purpose of simplicity, we use N and O atoms as an example to show how to calculate the observed atomic interacting probability. Let P(d | N,O,Si,Sj,rg) denote the distance probability distribution for the nitrogen atom in residue i and the oxygen atom in residue j. We calculate P(d | N,O,Si,Sj,rg) as follows.
| (7) |
where is the conditional distance probability distribution for atom N in amino acid a and O in amino acid b when the Cα distance of these two amino acids is dαα. Since is position-independent, it can be estimated by simple counting.
Window size and the number of neurons in the hidden layers
The window size for a sequence profile context and the number of neurons in the hidden layers are important hyper-parameters of our probabilistic neural network. Because it is time-consuming to train even a single neural network model for the estimation of distance probability distribution, we determine these hyper-parameters by training a neural network for inter-residue contact prediction, which obtains the best performance when the window size is 15 and the numbers of neurons in the first and second hidden layers are 40 and 100, respectively. Details are shown in SI Methods. The window size used by us is consistent with what is used by the Zhang group (Wu and Zhang, 2008a) and the numbers of hidden neurons are not very different from what is used by the Zhou group (Xue et al., 2009).
Supplementary Material
Highlights.
 Protein and position-specific statistical potentials are more powerful
 Evolutionary information greatly boost performance of statistical potentials
 Observed probability is critical to energy potentials, in addition to reference state
 Observed probability can be estimated better using context-specific information
Acknowledgements
We thank Jianzhu Ma and Sheng Wang for helping generate the in-house template-based models. This work is supported by National Institutes of Health grants R01GM0897532 and National Science Foundation DBI-0960390. The authors are grateful to the University of Chicago Beagle team, TeraGrid and Canadian SHARCNet for their support of computational resources.
Footnotes
Publisher's Disclaimer: This is a PDF file of an unedited manuscript that has been accepted for publication. As a service to our customers we are providing this early version of the manuscript. The manuscript will undergo copyediting, typesetting, and review of the resulting proof before it is published in its final citable form. Please note that during the production process errors may be discovered which could affect the content, and all legal disclaimers that apply to the journal pertain.
References
- Bauer A, Beyer A. An Improved Pair Potential to Recognize Native Protein Folds. Proteins-Structure. Function and Genetics. 1994;18:254–261. doi: 10.1002/prot.340180306. [DOI] [PubMed] [Google Scholar]
- Bradley P, Malmstrom L, Qian B, Schonbrun J, Chivian D, Kim DE, Meiler K, Misura KMS, Baker D. Free modeling with Rosetta in CASP6. Proteins. 2005;61:128–134. doi: 10.1002/prot.20729. [DOI] [PubMed] [Google Scholar]
- Brooks BR, Brooks CL, Mackerell AD, Nilsson L, Petrella RJ, Roux B, Won Y, Archontis G, Bartels C, Boresch S, et al. CHARMM: The Biomolecular Simulation Program. J Comput Chem. 2009;30:1545–1614. doi: 10.1002/jcc.21287. [DOI] [PMC free article] [PubMed] [Google Scholar]
- Bryngelson JD, Onuchic JN, Socci ND, Wolynes PG. Funnels, Pathways, and the Energy Landscape of Protein-Folding - a Synthesis. Proteins-Structure Function and Genetics. 1995;21:167–195. doi: 10.1002/prot.340210302. [DOI] [PubMed] [Google Scholar]
- Bystroff C, Thorsson V, Baker D. HMMSTR: a hidden Markov model for local sequence-structure correlations in proteins. J Mol Biol. 2000;301:173–190. doi: 10.1006/jmbi.2000.3837. [DOI] [PubMed] [Google Scholar]
- Casari G, Sippl MJ. Structure-Derived Hydrophobic Potential - Hydrophobic Potential Derived from X-Ray Structures of Globular-Proteins Is Able to Identify Native Folds. J Mol Biol. 1992;224:725–732. doi: 10.1016/0022-2836(92)90556-y. [DOI] [PubMed] [Google Scholar]
- Case DA, Cheatham TE, Darden T, Gohlke H, Luo R, Merz KM, Onufriev A, Simmerling C, Wang B, Woods RJ. The Amber biomolecular simulation programs. J Comput Chem. 2005;26:1668–1688. doi: 10.1002/jcc.20290. [DOI] [PMC free article] [PubMed] [Google Scholar]
- Dill KA. Theory for the Folding and Stability of Globular-Proteins. Biochemistry-Us. 1985;24:1501–1509. doi: 10.1021/bi00327a032. [DOI] [PubMed] [Google Scholar]
- Dill KA. Additivity principles in biochemistry. J Biol Chem. 1997;272:701–704. doi: 10.1074/jbc.272.2.701. [DOI] [PubMed] [Google Scholar]
- Dobson CM, Sali A, Karplus M. Protein folding: A perspective from theory and experiment. Angew Chem Int Edit. 1998;37:868–893. doi: 10.1002/(SICI)1521-3773(19980420)37:7<868::AID-ANIE868>3.0.CO;2-H. [DOI] [PubMed] [Google Scholar]
- Gatchell DW, Dennis S, Vajda S. Discrimination of near-native protein structures from misfolded models by empirical free energy functions. Proteins-Structure Function and Genetics. 2000;41:518–534. [PubMed] [Google Scholar]
- Gilis D, Rooman M. Stability changes upon mutation of solvent-accessible residues in proteins evaluated by database-derived potentials. J Mol Biol. 1996;257:1112–1126. doi: 10.1006/jmbi.1996.0226. [DOI] [PubMed] [Google Scholar]
- Gilis D, Rooman M. Predicting protein stability changes upon mutation using database-derived potentials: Solvent accessibility determines the importance of local versus non-local interactions along the sequence. J Mol Biol. 1997;272:276–290. doi: 10.1006/jmbi.1997.1237. [DOI] [PubMed] [Google Scholar]
- Hendlich M, Lackner P, Weitckus S, Floeckner H, Froschauer R, Gottsbacher K, Casari G, Sippl MJ. Identification of Native Protein Folds Amongst a Large Number of Incorrect Models - the Calculation of Low-Energy Conformations from Potentials of Mean Force. J Mol Biol. 1990;216:167–180. doi: 10.1016/S0022-2836(05)80068-3. [DOI] [PubMed] [Google Scholar]
- Hildebrand A, Remmert M, Biegert A, Soding J. Fast and accurate automatic structure prediction with HHpred. Proteins. 2009;77(Suppl 9):128–132. doi: 10.1002/prot.22499. [DOI] [PubMed] [Google Scholar]
- Hu Y, Dong X, Wu A, Cao Y, Tian L, Jiang T. Incorporation of Local Structural Preference Potential Improves Fold Recognition. Plos One. 2011;6 doi: 10.1371/journal.pone.0017215. [DOI] [PMC free article] [PubMed] [Google Scholar]
- Jones D. Protein secondary structure prediction based on position-specific scoring matrices. J Mol Biol. 1999;292:195–202. doi: 10.1006/jmbi.1999.3091. [DOI] [PubMed] [Google Scholar]
- Jones DT, Thornton JM. Potential energy functions for threading. Curr Opin Struc Biol. 1996;6:210–216. doi: 10.1016/s0959-440x(96)80076-5. [DOI] [PubMed] [Google Scholar]
- Jones TA, Thirup S. Using Known Substructures in Protein Model-Building and Crystallography. Embo J. 1986;5:819–822. doi: 10.1002/j.1460-2075.1986.tb04287.x. [DOI] [PMC free article] [PubMed] [Google Scholar]
- Joo K, Lee J, Seo JH, Lee K, Kim BG, Lee J. All-atom chain-building by optimizing MODELLER energy function using conformational space annealing. Proteins. 2009;75:1010–1023. doi: 10.1002/prot.22312. [DOI] [PubMed] [Google Scholar]
- Kanou K, Iwadate M, Hirata T, Terashi G, Umeyama H, Takeda-Shitaka M. FAMSD: A powerful protein modeling platform that combines alignment methods, homology modeling, 3D structure quality estimation and molecular dynamics. Chem Pharm Bull (Tokyo) 2009;57:1335–1342. doi: 10.1248/cpb.57.1335. [DOI] [PubMed] [Google Scholar]
- Kelley LA, Sternberg MJE. Protein structure prediction on the Web: a case study using the Phyre server. Nat Protoc. 2009;4:363–371. doi: 10.1038/nprot.2009.2. [DOI] [PubMed] [Google Scholar]
- Kihara D, Lu H, Kolinski A, Skolnick J. TOUCHSTONE: An ab initio protein structure prediction method that uses threading-based tertiary restraints. P Natl Acad Sci USA. 2001;98:10125–10130. doi: 10.1073/pnas.181328398. [DOI] [PMC free article] [PubMed] [Google Scholar]
- Kortemme T, Baker D. A simple physical model for binding energy hot spots in protein-protein complexes. P Natl Acad Sci USA. 2002;99:14116–14121. doi: 10.1073/pnas.202485799. [DOI] [PMC free article] [PubMed] [Google Scholar]
- Kouranov A, Xie L, de la Cruz J, Chen L, Westbrook J, Bourne P, Berman H. The RCSB PDB information portal for structural genomics. Nucleic Acids Research. 2006;34:D302–305. doi: 10.1093/nar/gkj120. [DOI] [PMC free article] [PubMed] [Google Scholar]
- Larsson P, Wallner B, Lindahl E, Elofsson A. Using multiple templates to improve quality of homology models in automated homology modeling. Protein Sci. 2008;17:990–1002. doi: 10.1110/ps.073344908. [DOI] [PMC free article] [PubMed] [Google Scholar]
- Laurie ATR, Jackson RM. Q-SiteFinder: an energy-based method for the prediction of protein-ligand binding sites. Bioinformatics. 2005;21:1908–1916. doi: 10.1093/bioinformatics/bti315. [DOI] [PubMed] [Google Scholar]
- Lee J, Lee D, Park H, Coutsias EA, Seok C. Protein loop modeling by using fragment assembly and analytical loop closure. Proteins. 2010;78:3428–3436. doi: 10.1002/prot.22849. [DOI] [PMC free article] [PubMed] [Google Scholar]
- Levitt M. Accurate modeling of protein conformation by automatic segment matching. J Mol Biol. 1992;226:507–533. doi: 10.1016/0022-2836(92)90964-l. [DOI] [PubMed] [Google Scholar]
- Liu D, Nocedal J. On the Limited Memory Bfgs Method for Large-Scale Optimization. Math Program. 1989;45:503–528. [Google Scholar]
- Lu H, Skolnick J. A distance-dependent atomic knowledge-based potential for improved protein structure selection. Proteins-Structure Function and Genetics. 2001;44:223–232. doi: 10.1002/prot.1087. [DOI] [PubMed] [Google Scholar]
- Lu M, Dousis A, Ma J. OPUS-PSP: An orientation-dependent statistical all-atom potential derived from side-chain packing. J Mol Biol. 2008;376:288–301. doi: 10.1016/j.jmb.2007.11.033. [DOI] [PMC free article] [PubMed] [Google Scholar]
- Maiorov VN, Crippen GM. Contact Potential That Recognizes the Correct Folding of Globular-Proteins. J Mol Biol. 1992;227:876–888. doi: 10.1016/0022-2836(92)90228-c. [DOI] [PubMed] [Google Scholar]
- Miyazawa S, Jernigan RL. Estimation of Effective Interresidue Contact Energies from Protein Crystal-Structures - Quasi-Chemical Approximation. Macromolecules. 1985;18:534–552. [Google Scholar]
- Eswar N, M.A.M.-R., Webb B, Madhusudhan MS, Eramian D, Shen M, Pieper U, Sali A. Comparative Protein Structure Modeling With MODELLER. Current Protocols in Bioinformatics Supplement. 2006;15:5.6.1–5.6.30. doi: 10.1002/0471250953.bi0506s15. [DOI] [PMC free article] [PubMed] [Google Scholar]
- Notredame C, Higgins DG, Heringa J. T-Coffee: A novel method for fast and accurate multiple sequence alignment. J Mol Biol. 2000;302:205–217. doi: 10.1006/jmbi.2000.4042. [DOI] [PubMed] [Google Scholar]
- Panchenko AR, Marchler-Bauer A, Bryant SH. Combination of threading potentials and sequence profiles improves fold recognition. J Mol Biol. 2000;296:1319–1331. doi: 10.1006/jmbi.2000.3541. [DOI] [PubMed] [Google Scholar]
- Panjkovich A, Melo F, Marti-Renom M. Evolutionary potentials: structure specific knowledge-based potentials exploiting the evolutionary record of sequence homologs. Genome Biol. 2008;9 doi: 10.1186/gb-2008-9-4-r68. [DOI] [PMC free article] [PubMed] [Google Scholar]
- Pei J, Kim B, Grishin N. PROMALS3D: a tool for multiple protein sequence and structure alignments. Nucleic Acids Research. 2008;36:2295–2300. doi: 10.1093/nar/gkn072. [DOI] [PMC free article] [PubMed] [Google Scholar]
- Peng J, Xu J. Boosting Protein Threading Accuracy. Lect Notes Comput Sci. 2009;5541:31. doi: 10.1007/978-3-642-02008-7_3. [DOI] [PMC free article] [PubMed] [Google Scholar]
- Peng J, Xu J. Low-homology protein threading. Bioinformatics. 2010;26:i294–i300. doi: 10.1093/bioinformatics/btq192. [DOI] [PMC free article] [PubMed] [Google Scholar]
- Peng J, Xu J. RaptorX: exploiting structure information for protein alignment by statistical inference. Proteins. 2011;79(Suppl 10):161–171. doi: 10.1002/prot.23175. [DOI] [PMC free article] [PubMed] [Google Scholar]
- Qian B, Raman S, Das R, Bradley P, McCoy A, Read R, Baker D. High-resolution structure prediction and the crystallographic phase problem. Nature. 2007;450:259–U257. doi: 10.1038/nature06249. [DOI] [PMC free article] [PubMed] [Google Scholar]
- Raman S, Vernon R, Thompson J, Tyka M, Sadreyev R, Pei JM, Kim D, Kellogg E, DiMaio F, Lange O, et al. Structure prediction for CASP8 with all-atom refinement using Rosetta. Proteins. 2009;77:89–99. doi: 10.1002/prot.22540. [DOI] [PMC free article] [PubMed] [Google Scholar]
- Reva BA, Finkelstein AV, Sanner MF, Olson AJ. Residue-residue mean-force potentials for protein structure recognition. Protein Eng. 1997;10:865–876. doi: 10.1093/protein/10.8.865. [DOI] [PubMed] [Google Scholar]
- Rykunov D, Fiser A. New statistical potential for quality assessment of protein models and a survey of energy functions. BMC Bioinformatics. 2010;11:128. doi: 10.1186/1471-2105-11-128. [DOI] [PMC free article] [PubMed] [Google Scholar]
- Samudrala R, Levitt M. Decoys ‘R’ Us: A database of incorrect conformations to improve protein structure prediction. Protein Sci. 2000;9:1399–1401. doi: 10.1110/ps.9.7.1399. [DOI] [PMC free article] [PubMed] [Google Scholar]
- Samudrala R, Moult J. An all-atom distance-dependent conditional probability discriminatory function for protein structure prediction. J Mol Biol. 1998;275:895–916. doi: 10.1006/jmbi.1997.1479. [DOI] [PubMed] [Google Scholar]
- Schuler LD, Daura X, Van Gunsteren WF. An improved GROMOS96 force field for aliphatic hydrocarbons in the condensed phase. J Comput Chem. 2001;22:1205–1218. [Google Scholar]
- Shakhnovich E. Protein folding thermodynamics and dynamics: Where physics, chemistry, and biology meet. Chem Rev. 2006;106:1559–1588. doi: 10.1021/cr040425u. [DOI] [PMC free article] [PubMed] [Google Scholar]
- Shao MF, Wang S, Wang C, Yuan XY, Li SC, Zheng WM, Bu DB. Incorporating Ab Initio energy into threading approaches for protein structure prediction. BMC Bioinformatics. 2011;12 doi: 10.1186/1471-2105-12-S1-S54. [DOI] [PMC free article] [PubMed] [Google Scholar]
- Shen M, Sali A. Statistical potential for assessment and prediction of protein structures. Protein Sci. 2006;15:2507–2524. doi: 10.1110/ps.062416606. [DOI] [PMC free article] [PubMed] [Google Scholar]
- Simons KT, Kooperberg C, Huang E, Baker D. Assembly of protein tertiary structures from fragments with similar local sequences using simulated annealing and Bayesian scoring functions. J Mol Biol. 1997;268:209–225. doi: 10.1006/jmbi.1997.0959. [DOI] [PubMed] [Google Scholar]
- Simons KT, Ruczinski I, Kooperberg C, Fox BA, Bystroff C, Baker D. Improved recognition of native-like protein structures using a combination of sequence-dependent and sequence-independent features of proteins. Proteins-Structure Function and Genetics. 1999;34:82–95. doi: 10.1002/(sici)1097-0134(19990101)34:1<82::aid-prot7>3.0.co;2-a. [DOI] [PubMed] [Google Scholar]
- Sippl MJ. Calculation of Conformational Ensembles from Potentials of Mean Force - an Approach to the Knowledge-Based Prediction of Local Structures in Globular-Proteins. J Mol Biol. 1990;213:859–883. doi: 10.1016/s0022-2836(05)80269-4. [DOI] [PubMed] [Google Scholar]
- Sippl MJ. Recognition of errors in three-dimensional structures of proteins. Proteins. 1993;17:355–362. doi: 10.1002/prot.340170404. [DOI] [PubMed] [Google Scholar]
- Sippl MJ, Weitckus S. Detection of native-like models for amino acid sequences of unknown three-dimensional structure in a data base of known protein conformations. Proteins. 1992;13:258–271. doi: 10.1002/prot.340130308. [DOI] [PubMed] [Google Scholar]
- Skolnick J. In quest of an empirical potential for protein structure prediction. Curr Opin Struc Biol. 2006;16:166–171. doi: 10.1016/j.sbi.2006.02.004. [DOI] [PubMed] [Google Scholar]
- Skolnick J, Kolinski A, Ortiz A. Derivation of protein-specific pair potentials based on weak sequence fragment similarity. Proteins-Structure Function and Genetics. 2000;38:3–16. [PubMed] [Google Scholar]
- Soding J. Protein homology detection by HMM-HMM comparison. Bioinformatics. 2005;21:951–960. doi: 10.1093/bioinformatics/bti125. [DOI] [PubMed] [Google Scholar]
- Specht DF. Probabilistic Neural Networks. Neural Networks. 1990;3:109–118. doi: 10.1109/72.80210. [DOI] [PubMed] [Google Scholar]
- Tanaka S, Scheraga HA. Medium- and long-range interaction parameters between amino acids for predicting three-dimensional structures of proteins. Macromolecules. 1976;9:945–950. doi: 10.1021/ma60054a013. [DOI] [PubMed] [Google Scholar]
- Tegge A, Wang Z, Eickholt J, Cheng J. NNcon: improved protein contact map prediction using 2D-recursive neural networks. Nucleic Acids Research. 2009;37:W515–W518. doi: 10.1093/nar/gkp305. [DOI] [PMC free article] [PubMed] [Google Scholar]
- Vendruscolo M, Najmanovich R, Domany E. Can a pairwise contact potential stabilize native protein folds against decoys obtained by threading? Proteins-Structure Function and Genetics. 2000;38:134–148. doi: 10.1002/(sici)1097-0134(20000201)38:2<134::aid-prot3>3.0.co;2-a. [DOI] [PubMed] [Google Scholar]
- Wang G, Dunbrack R. PISCES: a protein sequence culling server. Bioinformatics. 2003;19:1589–1591. doi: 10.1093/bioinformatics/btg224. [DOI] [PubMed] [Google Scholar]
- Wang Z, Zhao F, Peng J, Xu J. Protein 8-class secondary structure prediction using conditional neural fields. Proteomics. 2011;11:3786–3792. doi: 10.1002/pmic.201100196. [DOI] [PMC free article] [PubMed] [Google Scholar]
- Wu S, Skolnick J, Zhang Y. Ab initio modeling of small proteins by iterative TASSER simulations. Bmc Biol. 2007a;5 doi: 10.1186/1741-7007-5-17. [DOI] [PMC free article] [PubMed] [Google Scholar]
- Wu S, Zhang Y. A comprehensive assessment of sequence-based and template-based methods for protein contact prediction. Bioinformatics. 2008a;24:924–931. doi: 10.1093/bioinformatics/btn069. [DOI] [PMC free article] [PubMed] [Google Scholar]
- Wu S, Zhang Y. MUSTER: Improving protein sequence profile-profile alignments by using multiple sources of structure information. Proteins. 2008b;72:547–556. doi: 10.1002/prot.21945. [DOI] [PMC free article] [PubMed] [Google Scholar]
- Wu Y, Lu M, Chen M, Li J, Ma J. OPUS-Ca: A knowledge-based potential function requiring only C alpha positions. Protein Sci. 2007b;16:1449–1463. doi: 10.1110/ps.072796107. [DOI] [PMC free article] [PubMed] [Google Scholar]
- Xu D, Zhang J, Roy A, Zhang Y. Automated protein structure modeling in CASP9 by I-TASSER pipeline combined with QUARK-based ab initio folding and FG-MD-based structure refinement. Proteins. 2011;79(Suppl 10):147–160. doi: 10.1002/prot.23111. [DOI] [PMC free article] [PubMed] [Google Scholar]
- Xu J. Fold recognition by predicted alignment accuracy. Ieee Acm T Comput Bi. 2005;2:157–165. doi: 10.1109/TCBB.2005.24. [DOI] [PubMed] [Google Scholar]
- Xue B, Faraggi E, Zhou Y. Predicting residue-residue contact maps by a two-layer, integrated neural-network method. Proteins. 2009;76:176–183. doi: 10.1002/prot.22329. [DOI] [PMC free article] [PubMed] [Google Scholar]
- Yang Y, Faraggi E, Zhao H, Zhou Y. Improving protein fold recognition and template-based modeling by employing probabilistic-based matching between predicted one-dimensional structural properties of query and corresponding native properties of templates. Bioinformatics. 2011;27:2076–2082. doi: 10.1093/bioinformatics/btr350. [DOI] [PMC free article] [PubMed] [Google Scholar]
- Zemla A. LGA: a method for finding 3D similarities in protein structures. Nucleic Acids Research. 2003;31:3370–3374. doi: 10.1093/nar/gkg571. [DOI] [PMC free article] [PubMed] [Google Scholar]
- Zemla A, Venclovas C, Moult J, Fidelis K. Processing and analysis of CASP3 protein structure predictions. Proteins-Structure Function and Genetics. 1999:22–29. doi: 10.1002/(sici)1097-0134(1999)37:3+<22::aid-prot5>3.3.co;2-n. [DOI] [PubMed] [Google Scholar]
- Zemla A, Venclovas C, Moult J, Fidelis K. Processing and evaluation of predictions in CASP4. Proteins. 2001:13–21. doi: 10.1002/prot.10052. [DOI] [PubMed] [Google Scholar]
- Zhang C, Vasmatzis G, Cornette JL, DeLisi C. Determination of atomic desolvation energies from the structures of crystallized proteins. J Mol Biol. 1997;267:707–726. doi: 10.1006/jmbi.1996.0859. [DOI] [PubMed] [Google Scholar]
- Zhang J, Zhang Y. A Novel Side-Chain Orientation Dependent Potential Derived from Random-Walk Reference State for Protein Fold Selection and Structure Prediction. Plos One. 2010;5 doi: 10.1371/journal.pone.0015386. [DOI] [PMC free article] [PubMed] [Google Scholar]
- Zhang Y, Skolnick J. TM-align: a protein structure alignment algorithm based on the TM-score. Nucleic Acids Research. 2005;33:2302–2309. doi: 10.1093/nar/gki524. [DOI] [PMC free article] [PubMed] [Google Scholar]
- Zhao F, Li S, Sterner B, Xu J. Discriminative learning for protein conformation sampling. Proteins. 2008;73:228–240. doi: 10.1002/prot.22057. [DOI] [PMC free article] [PubMed] [Google Scholar]
- Zhao F, Peng J, Xu J. Fragment-free approach to protein folding using conditional neural fields. Bioinformatics. 2010;26:i310–i317. doi: 10.1093/bioinformatics/btq193. [DOI] [PMC free article] [PubMed] [Google Scholar]
- Zhou H, Pandit SB, Skolnick J. Performance of the Pro-sp3-TASSER server in CASP8. Proteins. 2009;77(Suppl 9):123–127. doi: 10.1002/prot.22501. [DOI] [PMC free article] [PubMed] [Google Scholar]
- Zhou H, Skolnick J. Protein structure prediction by pro-Sp3-TASSER. Biophys J. 2009;96:2119–2127. doi: 10.1016/j.bpj.2008.12.3898. [DOI] [PMC free article] [PubMed] [Google Scholar]
- Zhou H, Zhou Y. Distance-scaled, finite ideal-gas reference state improves structure-derived potentials of mean force for structure selection and stability prediction. Protein Sci. 2002;11:2714–2726. doi: 10.1110/ps.0217002. [DOI] [PMC free article] [PubMed] [Google Scholar]
Associated Data
This section collects any data citations, data availability statements, or supplementary materials included in this article.