

Abstract
BACKGROUND AND PURPOSE
Naringenin and its derivatives have been assessed in bone health for their oestrogen-‘like’ effects but low bioavailability impedes clinical potential. This study was aimed at finding a potent form of naringenin with osteogenic action.
EXPERIMENTAL APPROACH
Osteoblast cultures were harvested from mouse calvaria to study differentiation by naringenin, isosakuranetin, poncirin, phloretin and naringenin-6-C-glucoside (NCG). Balb/cByJ ovariectomized (OVx) mice without or with osteopenia were given naringenin, NCG, 17β-oestradiol (E2) or parathyroid hormone (PTH). Efficacy was evaluated by bone microarchitecture using microcomputed tomography and determination of new bone formation by fluorescent labelling of bone. Plasma levels of NCG and naringenin were determined by HPLC.
KEY RESULTS
NCG stimulated osteoblast differentiation more potently than naringenin, while isosakuranetin, poncirin or phloretin had no effect. NCG had better oral bioavailability than naringenin. NCG increased the mRNA levels of oestrogen receptors (ERs) and bone morphogenetic protein (an ER responsive gene) in vivo, more than naringenin. In OVx mice, NCG treatment in a preventive protocol increased bone formation rate (BFR) and improved trabecular microarchitecture more than naringenin or E2. In osteopenic mice, NCG but not naringenin, in a therapeutic protocol, increased BFR and improved trabecular microarchitecture, comparable with effects of PTH treatment. Stimulatory effects of NCG on osteoblasts were abolished by an ER antagonist. NCG transactivated ERβ but not ERα. NCG exhibited no uterine oestrogenicity unlike naringenin.
CONCLUSIONS AND IMPLICATIONS
NCG is a potent derivative of naringenin that has bone anabolic action through the activation of osteoblast ERs and exhibited substantial oral bioavailability.
Keywords: flavanones, oestrogen deficiency, osteoblast differentiation, mineralization, bone marrow, bone microarchitecture, bioavailability, preclinical development, osteoporosis, parathyroid hormone
Introduction
Oestrogen (as 17β-oestradiol; E2) deficiency elicits a series of immunological and metabolic alterations leading to lack of adequate new bone formation or augmented resorption of bone mass, or both. Net bone loss is a direct consequence of these alterations in post-menopausal women that culminates in osteoporosis, characterized by low bone mass and deterioration of trabecular microarchitecture (Turner et al., 1994; Tyagi et al., 2011). Signalling by E2 is mediated through two oestrogen receptors (ERs) – ERα and ERβ– both belonging to the nuclear receptor family of transcription factors (Nilsson et al., 2001). Osteoblasts are known to express both ERs and E2 stimulated the differentiation and activity of osteoblasts in cultures (Ernst et al., 1988; Komm et al., 1988). In addition, E2 increased bone formation and bone mass in animal models (Takano-Yamamoto and Rodan, 1990; Chow et al., 1992). In humans, an anabolic effect of E2 before skeletal maturation has been suggested by the low peak bone mass achievement in E2-deficient adolescent girls and in males with rare genetic syndromes of E2 deficiency (Smith et al., 1994; Morishima et al., 1995). Furthermore, the restorative effect of E2 in osteoporotic bones of post-menopausal women has been demonstrated by bone mineral density and histomorphometric assessments, suggesting an anabolic effect of this hormone (Studd et al., 1990; 1994; Garnett et al., 1991; Vedi et al., 1999). However, the benefits of E2 replacement therapy (ERT) against post-menopausal osteopenia are offset by the increased risk of breast and uterine cancers (Maggio, 1980; Steinberg et al., 1991; Lobo, 1995; Langer et al., 2003). Consequently, there is a growing interest in assessing the role of phytoestrogens in the prevention of post-menopausal osteoporosis because of their apparent lack of the adverse effects commonly associated with ERT (Hillard et al., 1991; Lien and Lien, 1996; Delmas, 1999; Carusi, 2000; Arjmandi, 2001; Ishimi, 2006; Coxam, 2008; Sharan et al., 2009).
Phytoestrogens are non-steroidal compounds present in a variety of botanical and dietary products. A number of preclinical studies have confirmed a positive effect of flavanones on bone functions. Indeed, after isoflavones, the flavanones are the subgroup of polyphenols with the most in vivo preclinical evidence for improved bone health (Sharan et al., 2009). There was significant inhibition of bone resorption in young male rats on a semi-purified diet to which oranges were added at 1 g·day−1 (Muhlbauer et al., 2003). Among the citrus flavanones, hesperidin (a flavanone glycoside) decreased femoral bone loss in ovariectomized (OVx) mice (Chiba et al., 2003). Supplementation of young male rats with nutrients rich in naringenin (Fig 1), a major flavanone present in grapefruit, enhanced bone formation during development of alveolar bone (containing tooth sockets) (Wood, 2005). Furthermore, naringin, a disaccharide derivative of naringenin which is hydrolyzed to naringenin by gut flora before being absorbed, exerts bone conserving effects in OVx mice. However, the doses of naringin used were 0.2 and 0.4 mg·g−1·day−1 (equivalent to 200–400 mg·kg−1·day−1) and would correspond to very high doses in humans (Pang et al., 2010). Nevertheless, these reports importantly point to naringenin as a compound containing a promising pharmacophore and a potential source of more potent osteogenic derivatives.
Figure 1.
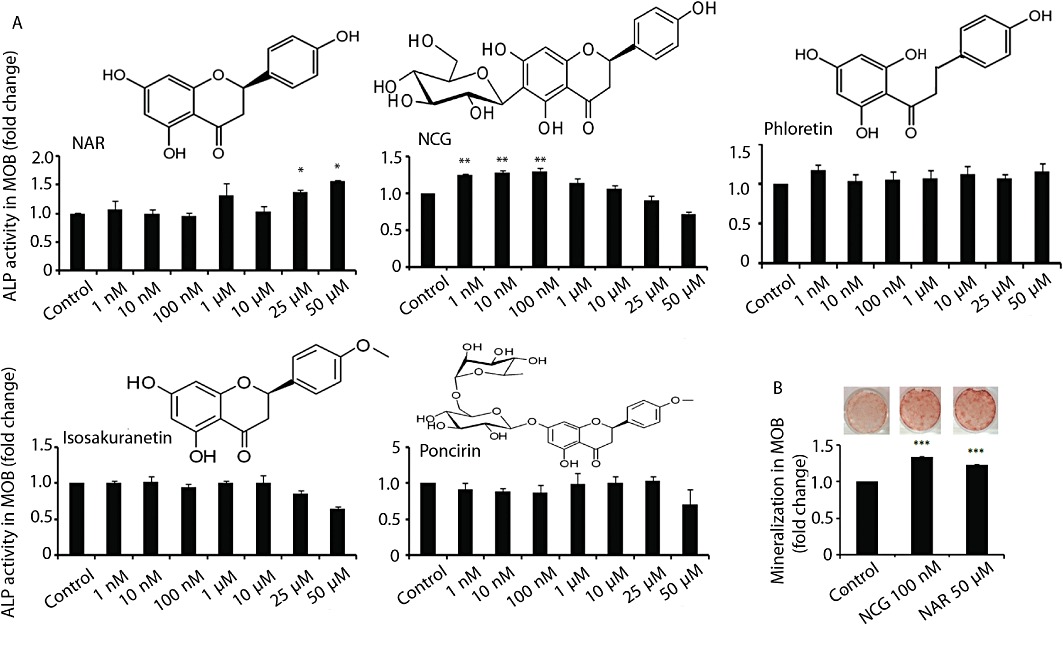
Naringenin (NAR) and its derivative NCG stimulate osteoblast differentiation in vitro. (A) MOBs (2 × 10³ cells·well−1) were seeded in 96-well plates. Cells were treated with or without various compounds at indicated concentrations for 48 h in osteoblast differentiation medium. ALP production was measured as described in Methods. (B) MOBs (2.5 × 10³ cells·well−1) in 12-well plates were treated as described in panel A. Cultures were continued for 21 days and stained with Alizarin red-S for calcium deposition. Representative photomicrographs show mineralized nodules in various groups (upper panel). Dye was extracted and quantified colorimetrically (lower panel). Results were obtained from three independent experiments in triplicate and are expressed as mean ± SEM; *P < 0.05, **P < 0.01, ***P < 0.001 versus control.
In the course of our search for more potent derivatives of naringenin with positive skeletal effects, we first screened various naturally occurring derivatives of naringenin in an assay for osteoblast differentiation. This assay led to the identification of naringenin-C-glucoside (NCG), isolated from an Indian medicinal plant, Ulmus wallichiana (Himalayan Elm) (Rawat et al., 2009), as the most potent member of the naringenin derivatives, in inducing osteoblast differentiation. Because good bioavailability is essential for any compound to exert biological effects in vivo, we determined the oral bioavailability of NCG and naringenin. The effects of NCG on bone properties of OVx mice and in primary osteoblast cultures were studied and compared with those of naringenin. Orally doses of E2 or intermittent injections of parathyroid hormone (PTH) were used as reference treatments for evaluating bone anabolic action in preventive or therapeutic protocols. The involvement of ERs in mediating the osteogenic actions of NCG was investigated in vivo and in vitro.
Methods
Animals
All animal care and experimental procedures were approved by the Institutional Animal Ethics Committee (IAEC). Female Balb/cByJ mice (18 ± 5 g) and male Wistar rats (150 ± 20 g) were obtained from the National Laboratory Animal Centre. Animals were kept in a 12h light-dark cycle, with controlled temperature (22–24°C) and humidity (50–60%) and free access to standard rodent food and water.
In vitro studies
Culture of calvarial osteoblasts
Mouse calvarial osteoblasts (MOBs) were obtained using the previously published protocol of sequential digestion (Wong et al., 1978; Trivedi et al., 2009). Briefly, calvaria from 10 to 12 1- to 2-day-old Balb/cByJ mice were pooled. Following surgical isolation from the skull and the removal of sutures and adherent mesenchymal tissues, the calvaria was subjected to five sequential (15 min each) digestions at 37°C in a solution containing 0.1% dispase and 0.1% collagenase P. The cells from the second to fifth digestions were collected, centrifuged, resuspended and plated in T-25 cm2 flask in α-MEM containing 10% fetal bovine serum (FBS) and 1% penicillin/streptomycin.
Osteoblast differentiation and mineralization
For determination of alkaline phosphatase (ALP) activity, 2 × 10³ cells·per well were seeded in 96-well plates. Cells were treated with different concentrations of naringenin, NCG, isosakuranetin, phloretin and ponicirin (1 nM to 50 µM) for 48 h in osteoblast differentiation medium (α-MEM supplemented with 5% charcoal-treated FBS, 10 mM β-glycerophosphate, 50 µg·mL−1 ascorbic acid and 1% penicillin/streptomycin). At the end of the incubation period, total ALP activity was measured using p-nitrophenylphosphate as a substrate and quantitated colorimetrically at 405 nm (Trivedi et al., 2008; 2009; Bhargavan et al., 2009; Gautam et al., 2010; Swarnkar et al., 2011).
To study the possible mediation of ERs in NCG-induced ALP production, osteoblasts were treated with ICI 182 780 (10 nM) for 30 min prior to NCG treatment and ALP production was determined as described previously. E2 (1 nM) was taken as reference treatment.
For mineralization studies, 2 × 10³ cells·per well were seeded in 12-well plates in differentiation media with 10% charcoal-treated FBS. Cells were cultured in osteoblast differentiation medium with or without naringenin (50 µM) or NCG (100 nM) for 21 days at 37°C in a humidified atmosphere of 5% CO2, and the medium was changed every 48 h. At the end of the experiment, cells were washed with PBS and fixed with 4% paraformaldehyde in PBS for 15 min. Alizarin red-S stain was used for staining mineralized nodules followed by extraction of the stain for colorimetric quantification at 550 nm (Gregory et al., 2004; Bhargavan et al., 2009; Maurya et al., 2009; Gautam et al., 2010).
Quantitative real-time polymerase chain reaction (qPCR)
SYBR green chemistry was for quantitative determination of various genes following an optimized protocol described before (Siddiqui et al., 2010; Swarnkar et al., 2011). The design of sense and antisense oligonucleotide primers was based on published cDNA sequences using the Universal ProbeLibrary (Roche Applied Sciences). Primer sequences are listed in Table 1. cDNA was synthesized with the RevertAid cDNA synthesis kit (Fermentas, Austin, TX, USA) using 2 µg total RNA in 20 µL reaction volume. For qPCR, the cDNA was amplified using Light Cycler 480 (Roche Molecular Biochemicals, Indianapolis, IA, USA).
Table 1.
Primer sequences of various mouse genes used for qPCR
| Gene name | Primer sequence | Accession number |
|---|---|---|
| Bone morphogenetic protein-2 | F- CGGACTGCGGTCTCCTAA | NM_007553.2 |
| R- GGGGAAGCAGCAACACTAGA | ||
| Osteocalcin | F- TGAGGACCATCTTCTGCTCA | NM_001032298 |
| R- TGGACATGAAGGCTTTGTCA | ||
| Collagen 1 | F- CATGTTCAGCTTTGTGGACCT | NM_007742.3 |
| R- GCAGCTGACTTCAGGGATGT | ||
| Runt related transcription factor2 | F- CCCGGGAACCAAGAAATC | AF053956.1 |
| R- CAGATAGGAGGGGTAAGACTGG | ||
| Osteoprotegerin | F: AGCCATTGCACACCTCAC | NM_011613 |
| R: CGTGGTACCAAGAGGACAGAGT | ||
| Receptor activator of nuclear factor κ-B ligand | F- AGCCATTTGCACACCTCAC | NM_011613 |
| R- CGTGGTACCAAGAGGACAGAGT | ||
| Oestrogen receptor-α | F-GCTCCTAACTTGCTCCTGGAC | NM_007956.4 |
| R-CAGCAACATGTCAAAGATCTCC | ||
| Oestrogen receptor-β | F- CCTCAGAAGACCCTCACTGG | NM_207707.1 |
| R- CACGCACTTCCCCTCATC | ||
| Glyceraldehyde 3-phosphate dehydrogenase | F: AGCTTGTCATCAACGGGAAG | DQ403054.1 |
| R: TTTGATGTTAGTGGGGTCTCG |
Oral bioavailability studies in rats
Adult male Wistar rats were used for this study. The animals were given a 5.0 mg·kg−1 bolus dose of NCG or naringenin by oral gavage and killed at 0.5, 1, 1.5, 2, 3, 4, 6, 8 and 24 h after treatment. Three animals were taken at each time point. Plasma was collected for the determination of NCG or naringenin levels. Data that represent the concentration–drug profile at 0 h time point were obtained from animals without any prior treatment. Sample processing was performed as described by Siddiqui et al. (2011).
Preparation of standard and quality control samples
Stock solutions of naringenin and NCG were prepared in methanol to give a final concentration of 208 µg·mL−1 and 260 µg·mL−1. A series of standard solutions with concentrations in the range of 1.04–10.40 µg·mL−1 for naringenin and 1.30–13.00 µg·mL−1 for NCG were obtained by serial dilution with methanol. All the solutions were stored at −20°C and were brought to room temperature before use. To prepare the standard calibration samples, different concentrations of the compounds were added to 200 µL serum, leaving two serum samples without any added compound. Serum samples were incubated for 30 min at 37°C. Then all serum samples were treated by adding 2× volumes of methanol and the resulting mixtures were vortexed for 5 min and centrifuged for 10 min at 1006 g at room temperature. Supernatants were decanted into fresh test tubes and solvent evaporated under reduced pressure with the HETO system (HETO Lab Equipment, Heto-Holtan A/S, Allered, Denmark) and reconstituted in 50 µL methanol (recovery >75%). The final standard serum concentrations were 104–1040 ng·mL−1 (naringenin) and 130–1300 ng·mL−1 (NCG).
Sampling procedure and HPLC analysis
Samples were analysed by a Shimadzu HPLC system (Chromatography Technology Services, Burnsville, MN, USA), equipped with a binary gradient pump (10 ATVP), Rheodyne (Cotati, CA, USA) model 7125 injector with a 20 µL loop and diode array detector (10 ATVP). HPLC separation was achieved on a Lichrosphere Lichrocart C18 column (250 mm, 4 mm, 5 µm, Merck, Rahway, NJ, USA). For analysis, 20 µL of each serum sample was injected into an HPLC column. Elution was performed using a mixture of 0.5% phosphoric acid in triple distilled water and acetonitrile (75:25). Both the solutions were filtered and degassed before use. Chromatography was performed at 25 ± 30°C at a flow rate of 1.5 mL·min−1. Naringenin and NCG were quantified with isocratic conditions, with absorbance monitored at 290 nm and 325 nm.
Studies on mice
Newborn mice
Fifteen 1- to 2-day-old mice were divided into five equal groups and given subcutaneous injection of naringenin at two doses (1 and 5 mg·kg−1·day−1 in 25 µL), NCG at two doses (1 and 5 mg·kg−1·day−1 in 25 µL) or equal volume of vehicle (normal saline) for three consecutive days. At the end of the treatment, pups were killed and individual calvaria was harvested and cleaned of adherent tissue by gentle scraping. Total RNA was isolated and qPCR for ERα, ERβ and BMP-2 was performed as described previously.
Preventive protocol
Sixty adult female Balb/cByJ mice (18 ± 5 g) were bilaterally ovariectomised (OVx) as described previously (Siddiqui et al., 2010). After 24 h, OVx mice were divided into six equal groups as follows: sham + vehicle (gum acacia in distilled water), OVx + vehicle, OVx + E2 (5 µg·kg−1·day−1), OVx + naringenin (5 mg·kg−1·day−1) and OVx + NCG (1 and 5 mg·kg−1·day−1) and treament started. Treatments were continued for 5 weeks. For dynamic histomorphometry, each animal received intraperitoneal injections of calcein (5 mg·kg−1) on day 2 and day 34 from the start of the various treatments including the vehicle-treated control groups. At the end of all treatments, mice were killed and bones (tibia, femur) and uteri collected for the measurement of various parameters as described below.
Therapeutic protocol
Thirty adult female Balb/cByJ mice were bilaterally OVx and left untreated for 6 weeks before being randomly divided into five equal groups as follows: OVx + vehicle (gum acacia in distilled water), Ovx + 40 µg·kg−1·day−1 human 1–34 PTH (five times a week, i.p. injection), OVx + naringenin (5 mg·kg−1·day−1) and OVx + NCG (1 and 5 mg·kg−1·day−1). In addition, six adult female mice were sham operated (ovary intact group) and given vehicle (control group). Treatments were continued for 6 weeks. For dynamic histomorphometry, each animal received intraperitoneal injections of calcein (5 mg·kg−1) on day 2 and day 40 from the start of the various treatments including the vehicle-treated control groups (Siddiqui et al., 2011). At the end of all treatments, mice were killed and femora collected to measure new bone formation parameters, as described below.
Microcomputed tomography (µCT)
µCT scanning of excised bones was carried out using the Sky Scan 1076 µCT scanner (Aartselaar, Belgium) as described before (Sharan et al., 2011; Siddiqui et al., 2010). The bone samples were scanned at a resolution of 9 µm. Reconstruction was carried out using the Sky Scan Nrecon software. The X-ray source was set at 50 kV and 200 mA, with a pixel size of 9 µm. A hundred projections were acquired over an angular range of 180°. The trabecular bone was selected by drawing ellipsoid contours with the CT analyser (CTAn, Skyscan) software. Trabecular bone volume, trabecular number (Tb.N), and trabecular separation (TB.sp) of the distal femoral epiphysis (covering secondary spongiosa and the secondary ossification center) and proximal tibial metaphysis were calculated by the mean intercept length method (Gupta et al., 2009; Siddiqui et al., 2010; Verdelis et al., 2011). Trabecular thickness (Tb.th) was calculated according to the method of Hildebrand and Rüegsegger. 3D parameters were based on analysis of a Marching cubes-type model with a rendered surface. CTvol software (Skyscan™ CT-analyser software, Aartselaar, Belgium) has been used to create 3D model of the bones.
Body weight, uterine histology and histomorphometry
Body weight of each animal was taken before the start and end of the experiment. The uterus of each mouse was weighed and then fixed in 2% paraformaldehyde. A sample (about 6 mm) from the middle segment of each uterus was dehydrated in ascending grades of isopropanol, cleared in xylene and embedded in paraffin wax using standard procedures. Transverse sections (5 µm) were stained with haematoxylin and eosin and representative images were captured. Total uterine area, luminal area and luminal epithelial height were measured using Leica Qwin-Semiautomatic Image Analysis software (Sharan et al., 2010; Siddiqui et al., 2011).
Ex vivo culture of bone marrow cells
At the end of the different treatments, mice were killed and bone marow cells from the femora were flushed out in osteoblast differentiation medium containing 10−7 M dexamethasone (bone marrow differentiation medium). Cells were seeded (2 × 10⁶ cells·well−1) onto 12-well plates in bone marrow differentiation medium. Bone marrow cells were cultured for 21 days with a change of medium every 48 h. At the end of the experiment, mineralized nodules were stained and quantified as described for the MOBs (Swarnkar et al., 2011).
Studies on the expression of osteogenic genes in the femur
The collected femur was pulverized in liquid N2. The frozen powder was transferred into a tube containing Trizol and total RNA was isolated and qPCR were performed as described earlier (Siddiqui et al., 2011). qPCR analysis of runt-related transcription factor 2 (RUNX2) and type I collagen were performed as described before. Primer sequences are listed in Table 1.
Fluorochrome labelling and bone histomorphometry
Cross-sections (50 µm thickness) of terminal periosteal regions of undecalcified femoral and tibial diaphysis of each mouse were obtained using an Isomet-Slow Speed Bone Cutter (Buehler, Lake Bluff, IL, USA). Images were captured using Leica-Qwin software (Leica Microsystems Inc., Buffalo Grove, IL, USA), and bone forming rate/bone surface (BFR/BS) and mineral appositional rate (MAR) were calculated (Sharan et al., 2010).
Expression of osteogenic genes in MOBs
mRNA levels of various genes including BMP-2, RUNX2, osteoprotegerin (OPG) and receptor activator of nuclear factor kappa B ligand (RANKL) from MOBs were measured by qPCR as described before and the primers used are listed in Table 1 (Sharan et al., 2011).
Western blotting
MOBs were grown to 60–70% confluence and then they were exposed to NCG (100 nM) or E2 (10 nM) for 48 h. The cells were then homogenized with lysis buffer (50 mM Tris–HCl, pH 8 containing 150 mM NaCl, 1% Triton X-100, 0.02% sodium azide, 10 mM EDTA, 10 mg·mL−1 aprotinin and 1 mg·mL−1 aminoethylbenzenesulphonyl fluoride). Protein samples were loaded onto 10% SDS-PAGE gel. After electrophoresis, proteins were transferred to a PVDF membrane. The membranes were incubated with ERα and ERβ antibodies. The bands were developed using ECL kit (Millipore, Billerica, MA, USA). Data were normalized by β-actin expression (Bhargavan et al., 2011).
Transactivation assay
For transient transfection and oestrogen response element (ERE)-mediated luciferase activity assay, HuH7 cells were seeded in a 12-well plate at a density of 3 × 10⁴ cells·per well and cultured in Dulbecco's modified Eagle's medium supplemented with 10% FBS for 48 h. Cell were co-transfected with 50 ng ERα or ERβ plasmid, 200 ng oestrogen response element (ERE)-containing luciferase reporter plasmid and 50 ng of pEGFPC1 (Clontech) internal reporter plasmid using the Lipofectamine LTS reagent according to the manufacturer's instructions. Transfected cells were treated with vehicle, E2 (10 nM) or NCG (100 nM) for 24 h. The ERE firefly luciferase activities were normalized for pEGFP values (Bhargavan et al., 2011).
Data analysis
All results are presented as the mean ± SEM of results from three cultures and the significance of differences was analyzed by Student's t-test. Groups were analysed via t-tests or anova for experiments with more than two subgroups. Probability values of P < 0.05 were considered to be statistically significant.
Materials
Cell culture media and supplements were purchased from Invitrogen (Carlsbad, CA, USA). All fine chemicals including naringenin, isosakuranetin, poncirin, phloretin, 17β-estradiol (E2) and ICI 182780 were purchased from Sigma-Aldrich (St. Louis, MO, USA). Human PTH (1–34) was purchased from Calbiochem (La Jolla, CA, USA). NCG was purified from the total extract of the stem-bark of U. wallichiana, as described before (Rawat et al., 2009).
Results
Evaluation of naringenin and its derivatives in osteoblast differentiation assay
Naringenin and four natural derivatives, namely isosakuranetin, poncirin, phloretin and NCG (Figure 1A), were screened for stimulation of ALP production in primary cultures of osteoblasts from neonatal mice calvariae. Naringenin and NCG, but not isosakuranetin, poncirin or phloretin, stimulated osteoblastic ALP production (Figure 1A). Naringenin (P < 0.05) stimulated ALP production at micromolar (25 and 50 µM) but NCG (P < 0.01) at nanomolar concentrations (1, 10 and 100 nM) compared with control (cells receiving vehicle). Induction of osteoblast differentiation was further confirmed by the formation of mineralized nodules in calvarial cultures. As shown in Figure 1B, NCG at 100 nM induced higher (P < 0.001) nodule formation than in the control calvarial cultures and this effect was not different from that of naringenin at 50 µM. At concentrations lower than 50 µM, naringenin did not stimulate nodule formation (data not shown).
In vivo studies
Effects of NCG and naringenin on ER and ER target gene expression in calvaria
One- to two-day-old mice were given s.c. injections of either NCG or naringenin at 1 and 5 mg·kg−1·day−1 doses for three consecutive days. NCG but not naringenin increased the mRNA levels of ERα, ERβ and BMP-2 in the calvaria compared with the vehicle-treated group (Figure 2).
Figure 2.
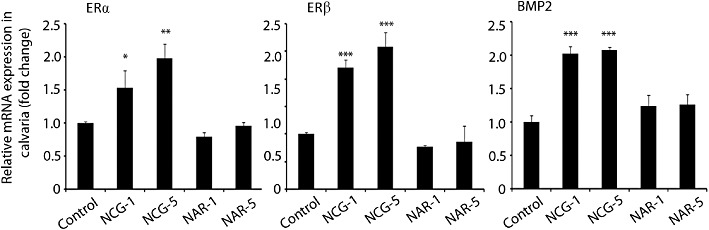
NCG increases expression of oestrogen receptors and their target gene in calvaria. Newborn mice were given subcutaneous injection of naringenin (NAR) or NCG (1 and 5 mg·kg−1·day−1 in 25 µL saline) or vehicle (25 µL saline) for three consecutive days. qPCR data of the indicated genes from calvaria are presented. n = 3 mice per group; data expressed as mean ± SEM; *P < 0.05, **P < 0.01, ***P < 0.001 versus control. NCG-1, NCG-5, NCG at 1 or 5 mg·kg−1·day−1. NAR-1, NAR-5, naringenin at 1 or 5 mg·kg−1·day−1.
Evaluation of oral bio-availabilities of NCG and naringenin
In rats given a single oral dose of 5 mg·kg−1, the rate of appearance of naringenin and NCG in plasma differed. The plasma concentrations of naringenin were significantly higher after 2 h and lower after 24 h. The highest plasma concentration of naringenin was recorded at 4 h (Tmax) post-dosing and Cmax was 1584 ± 439 ng·mL−1, followed by a marked decrease between 6 and 24 h (Figure 3A). NCG had a Tmax of 3 h and Cmax of 738 ± 300 ng·mL−1 (Figure 3B). On the basis of Tmax values, absorption of naringenin and NCG occurred early in the digestive tract (stomach or small intestine), as reported before for other flavonoids (Choudhury et al., 1999). The AUC0→∞ were 46 247 ng·mL−1 and 71 557 ng·mL−1, respectively, for naringenin and NCG. These data indicate that NCG was 1.5-fold more bioavailable than naringenin.
Figure 3.
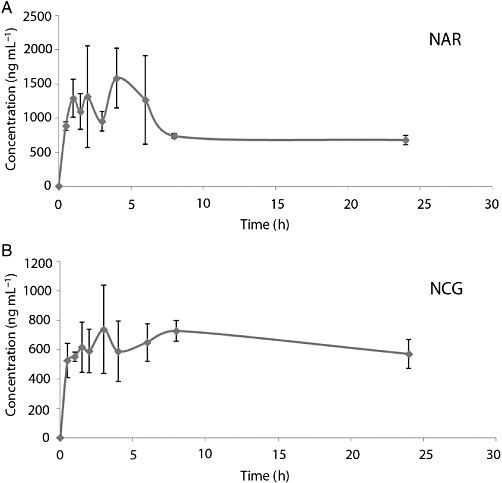
NCG has greater plasma bioavailability than naringenin (NAR). Determination of plasma levels of naringenin and NCG in adult male Wistar rats. (A) Plasma-concentration time profiles of naringenin following single oral dose of 5 mg·kg−1. (B) Plasma concentration time profiles of NCG following single oral dose of 5 mg·kg−1; n = 3 rats per time point, 24 h study. For derived data, refer to the Results section.
Effects of NCG or naringenin on uterine morphometry and body weight in OVx mice
We next studied the effect of NCG on the bone loss in mice rendered deficient in E2, by bilateral OVx. First, the efficacy of OVx was confirmed by studying uterine parameters. As expected, OVx group had reduced uterine weight (P < 0.001), total uterine area P < 0.001), luminal area (P < 0.001) and luminal epithelial cell height (P < 0.001) compared with the sham group (Figure 4A, Table 2). E2 administration increased all of these uterine parameters in OVx mice (P < 0.001). OVx mice treated with NCG at all doses had uterine parameters that were comparable with OVx group. However, mice treated with naringenin showed an increase in uterine weight (P < 0.01 compared with OVx and P < 0.001 compared with NCG group), uterine area (P < 0.001) and luminal cells height (P < 0.001) in comparison with OVx- or NCG-treated group.
Figure 4.
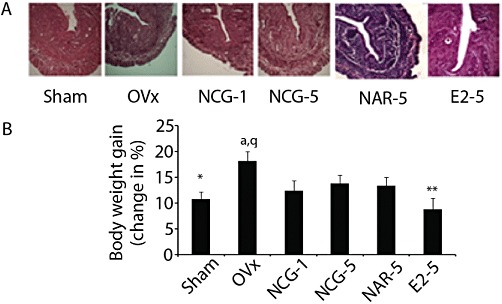
NCG is devoid of E2-like effects while naringenin (NAR) is oestrogenic. (A) Transverse sections of uterus (5 µm) were stained with haematoxylin and eosin stain and representative images were captured. Representative photomicrographs (40× magnifications) of different experimental groups are shown. These photomicrographs were used for the measurement of various histomorphometric parameters. Refer to Table 3 for data. (B) Body weights of mice were recorded at the start and end of various treatments. *P < 0.05, **P < 0.01 versus OVx; aP < 0.05 versus sham; qP < 0.001 versus E2. Results are mean ± SEM, n = 10 mice per group. NCG-1, NCG-5, NCG at 1 or 5 mg·kg−1·day−1. NAR-1, NAR-5, naringenin at 1 or 5 mg·kg−1·day−1. E2-5, E2 at 5 µg·kg−1·day−1.
Table 2.
Effects of naringenin-6-C-glucoside (NCG), naringenin (NAR) and 17β-oestradiol (E2) on uterine parameters in OVx mice
| Parameter | Sham | OVx | NCG-1 | NCG-5 mg·kg−1·d−1 | NAR-5 | E2-5 µg·kg−1·d−1 |
|---|---|---|---|---|---|---|
| Uterine weight (mg) | 28.8 ± 1.157***,c | 7.84 ± 0.191c,z,r | 6.9 ± 0.620c,z,r | 6.92 ± 0.566c,z,r | 10.88 ± 0.815**,c,r | 23.55 ± 0.305***,c,z |
| Total uterine area (µm2) | 160.88 ± 3.01***,c | 82.39 ± 3.46c,z,r | 75.69 ± 3.60c,z,r | 82.43 ± 3.95c,z,r | 108.59 ± 1.52***,c,r | 51.23 ± 4.24***,c,z |
| Luminal area (µm2) | 8.33 ± 0.77***,c | 3.04 ± 0.35c,r | 3.03 ± 0.31c,r | 3.28 ± 0.33c,r | 3.63 ± 0.11c,r | 7.54 ± 0.39***,c,z |
| Luminal epithelium height (µm) | 0.45 ± 0.02***,c | 0.16 ± 0.01c,z,r | 0.18 ± 0.27c,z,r | 0.17 ± 0.02c,z,r | 0.31 ± 0.01***,c,r | 0.40 ± 0.02***,c,r |
P < 0.01
P < 0.001 versus OVx
P < 0.001 versus sham
P < 0.001 versus N
P < 0.001 versus E2.
Results are mean ± SEM, n = 10 mice per group.
NCG-1, NCG-5, NCG at 1 or 5 mg·kg−1·day−1; NAR-5, naringenin at 5 mg·kg−1·day−1; E2-5 = E2 at 5 µg·kg−1·day−1.
OVx mice showed increased weight gain, compared with sham treated mice (P < 0.05). E2 treatment reduced weight gain in OVx mice compared with vehicle-treated OVx mice (P < 0.01). Treating OVx mice with NCG or naringenin had no effect on weight gain (Figure 4B).
Effect of NCG or naringenin on trabecular microarchitecture in OVx mice
Analysis of reconstructed 3D µCT data of trabecular bones including distal femoral epiphysis and tibia metaphysis showed differences in trabecular microarchitecture among the various treatment groups as presented in Figure 5. In the preventive protocol, at the femur epiphysis (Figure 5A), there were decreases in the ratio of bone volume fraction bone volume: trabecular volume (BV/TV) (P < 0.001), trabecular number (Tb.N) (P < 0.001) and connectivity density (CD) (P < 0.001) in OVx group, compared with the sham group. Trabecular separation (Tb.sp.) (P < 0.001), trabecular pattern factor (Tb.pf) (P < 0.001) and structure model index (SMI) (P < 0.001) were increased in OVx group compared with the sham group. As expected, E2 significantly increased BV/TV (P < 0.001), Tb.N (P < 0.05) and CD (P < 0.01); and decreased Tb.sp. (P < 0.001), Tb.pf (P < 0.001) and SMI (P < 0.001) compared with OVx + vehicle group. NCG dose-dependently increased BV/TV, Tb.N and CD, and decreased Tb.pf compared with OVx + vehicle group and at 5 mg·kg−1 dose, and these values were comparable with sham. Tb.sp. (P < 0.001) and SMI (P < 0.001) were decreased by NCG at both doses compared with OVx + vehicle and at 5 mg·kg−1, these values were comparable with sham. Mice given naringenin at 5 mg·kg−1·day−1 prevented OVx-induced changes in BV/TV (P < 0.01), Tb.N (P < 0.05), CD (P < 0.05), Tb.sp. (P < 0.001), Tb.pf (P < 0.001) and SMI (P < 0.001). However, at 5 mg·kg−1, NCG induced a better trabecular response, as shown by the increased BV/TV (P < 0.01), Tb.N (P < 0.05), Tb.sp. (P < 0.01) and CD (P < 0.05), compared with naringenin at the same dose.
Figure 5.
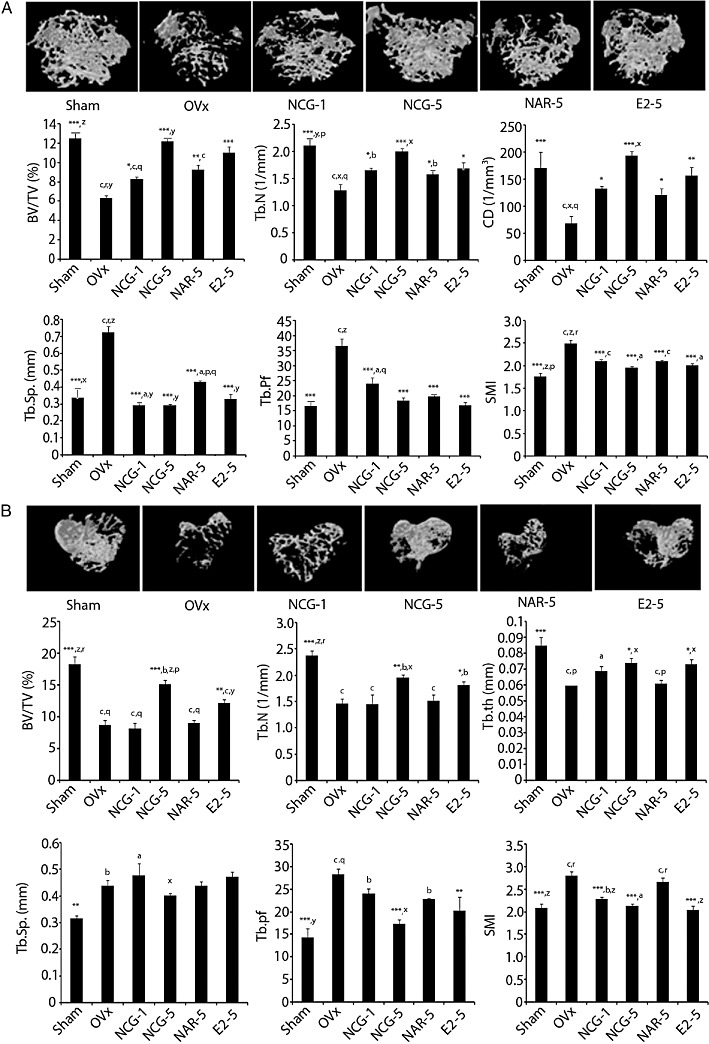
NCG is better than naringenin (NAR) in preserving trabecular microarchitecture in OVx mice. (A) Representative µCT images of femur distal femoral epiphysis of various experimental group (upper panel). µCT analysis of several trabecular parameters (BV/TV, Tb.N, CD, Tb.sp., Tb.pf and SMI) is presented in the lower two panels. (B) NCG supplementation has bone-conserving effect on trabecular microarchitecture of tibia metaphysis. Representative µCT images (upper panel) and quantification of trabecular parameters (BV/TV, Tb.N, Tb.th, Tb.sp., Tb.pf and SMI) are shown in the lower two panels. All values are expressed as mean ± SEM (n = 10 mice/group); *P < 0.05, **P < 0.01, ***P < 0.001 versus OVx + vehicle; aP < 0.05, bP < 0.01, cP < 0.001 versus sham; xP < 0.05, yP < 0.01, zP < 0.001 versus NAR; pP < 0.05, qP < 0.01, rP < 0.001 versus E2; NCG-1, NCG-5, NCG at 1 or 5 mg·kg−1·day−1. NAR-1, NAR-5, naringenin at 1 or 5 mg·kg−1·day−1. E2-5, E2 at 5 µg·kg−1·day−1.
Tibial trabecular data (Figure 5B) in the preventive protocol showed that, compared with the sham group, the OVx group had significantly reduced BV/TV (P < 0.001), Tb.N (P < 0.001) and Tb.th (trabecular thickness, P < 0.001); and increased Tb.sp. (P < 0.01), Tb.pf (P < 0.001) and SMI (P < 0.001). Treatment with E2 significantly increased BV/TV (P < 0.01), Tb.N (P < 0.05) and Tb.th (P < 0.05); and decreased Tb.pf (P < 0.01) and SMI (P < 0.001) compared with the OVx + vehicle group. NCG dose-dependently increased BV/TV, and Tb.N, and decreased Tb.pf compared to the OVx + vehicle group. SMI (P < 0.001) was decreased by NCG at both doses compared with OVx + vehicle, and at 5 mg·kg−1 NCG was comparable with sham. Naringenin treatment was ineffective in preventing OVx-induced changes in tibial microarchitectural parameters.
The therapeutic mode of NCG or naringenin treatment in osteopenic OVx mice on the trabecular response was quantified in the distal femoral epiphysis and tibial proximal metaphysis, and the values were compared with that of PTH treatment (Figure 6). Femoral data (Figure 6A) showed that, compared with the sham group, the OVx + vehicle group had reduced BV/TV (P < 0.001) and Tb.N (P < 0.001); and increased Tb.sp. (P < 0.01) and Tb.pf (P < 0.01). Comparison of the NCG or PTH treatment groups with the sham group revealed no significant differences in BV/TV, Tb.N, Tb.sp. and SMI. CD was higher (P < 0.05) in the PTH group compared with the sham. Tb.pf (P < 0.05) was reduced in both NCG and PTH groups when compared with the sham group. All femoral parameters except Tb.pf were comparable between the naringenin and OVx + vehicle groups. Tb.pf (P < 0.05) was reduced after naringenin treatment, compared with the OVx + vehicle group.
Figure 6.

NCG is better than naringenin (NAR) in restoring trabecular microarchitecture in osteopenic OVx mice bones. (A) µCT analysis of various trabecular parameters (BV/TV, Tb.N, CD, Tb.sp., Tb.pf and SMI) in distal femoral epiphysis. (B) µCT quantification of trabecular parameters (BV/TV, Tb.N, Tb.th, Tb.sp., Tb.pf and SMI) in tibia metaphysis is shown. All values are expressed as mean ± SEM (n = 10 mice/group); *P < 0.05, **P < 0.01, ***P < 0.001 compared with OVx + vehicle; aP < 0.05, bP < 0.01, cP < 0.001 versus sham; xP < 0.05, yP < 0.01, zP < 0.001 versus NAR; NCG-1, NCG-5, NCG at 1 or 5 mg·kg−1·day−1. NAR-1, NAR-5, naringenin at 1 or 5 mg·kg−1·day−1. iPTH, PTH at 40 µg·kg−1·day−1 injected 5 days in a week.
Tibial trabecular data (Figure 6B) in the therapeutic mode of treatment showed that osteopenic OVx mice had reduced BV/TV (P < 0.001), Tb.N (P < 0.001), Tb.th (P < 0.01); and increased Tb.pf (P < 0.001) and SMI (P < 0.05) when compared with the sham group. Comparison of the NCG or PTH treatment group with the sham group revealed no significant differences in BV/TV and Tb.pf. The PTH group showed increased Tb.N (P < 0.05) and Tb.th (P < 0.01); and reduced Tb.sp. (P < 0.05) when compared with the sham group. SMI was not different between the iPTH and sham groups. Tb.sp. (P < 0.05) and SMI (P < 0.001) were reduced in NCG group compared with the sham group. Tb.N was comparable between the NCG and sham groups. No difference was observed in any of the tibial parameters between the naringenin and OVx + vehicle groups.
Effects of NCG on mineralization, expression of osteogenic genes and new bone formation in OVx mice
At the end of the various treatments, bone marrow cells collected from the long bones, showed dose-dependent increase in mineralized nodules in the NCG-treated OVx mice, compared with the OVx + vehicle (P < 0.001) group, and at 5 mg·kg−1, NCG data were comparable with sham data. Naringenin (P < 0.001) or E2 (P < 0.01) treatment significantly increased mineralized nodules compared with OVx + vehicle group. However, both treatments were significantly less effective (P < 0.05) than NCG at 5 mg·kg−1 in inducing nodule formation (Figure 7A).
Figure 7.
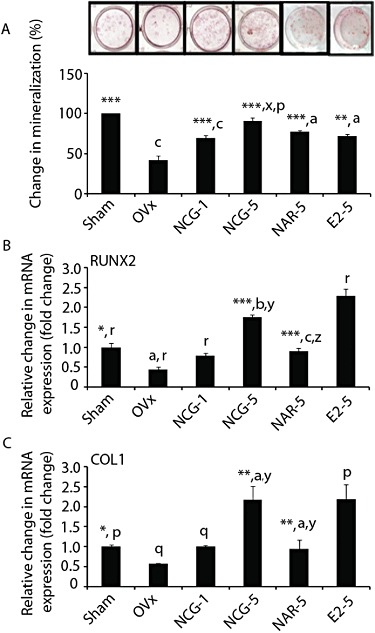
NCG treatment has osteogenic effects in OVx mice. (A) Bone marrow cells were harvested from the femora of different experimental groups. 2 × 10⁶ cells were plated in 6-well plates and cultures were treated, maintained and stained according the protocol described in Figure 1B. Upper panel shows representative micrographs of Alizarin staining. Lower panel shows quantification of Alizarin dye. Total RNA was isolated from femur and qPCR was performed to determine the mRNA levels of RUNX2 (B) and type I collagen (Col1) (C), and data were expressed after normalizing with GAPDH. Results were expressed as mean ± SEM. n = 6. *P < 0.05, **P < 0.01, ***P < 0.001 versus OVx; aP < 0.05, bP < 0.01, cP < 0.001 versus sham; xP < 0.05, yP < 0.01, zP < 0.001 versus NAR; pP < 0.05, qP < 0.01, rP < 0.001 versus E2. NCG-1, NCG-5, NCG at 1 or 5 mg·kg−1·day−1. NAR-1, NAR-5, naringenin at 1 or 5 mg·kg−1·day−1. E2-5, E2 at 5 µg·kg−1·day−1.
Femoral bones from OVx + vehicle mice exhibited reduced mRNA levels of osteoblast-specific genes including those for RUNX2 (Figure 7B) and type I collagen (Figure 7C), compared with the sham group (P < 0.05) (Figure 7B,C). NCG treatment to OVx mice resulted in dose-dependent increase in the mRNA levels of both genes. At 5 mg·kg−1 NCG, the induction of these two osteogenic genes was comparable with E2 treatment and significantly higher than the sham group. At 5 mg·kg−1, naringenin, mRNA levels of RUNX2 (P < 0.001) and type I collagen (P < 0.01) were increased compared with the OVx group but were still lower than the corresponding values in the OVx + NCG group at the same dose (P < 0.01) (Figure 7B,C).
Next we measured new bone formation by dynamic histomorphometry in the femur. As expected, the parameters of new bone formation, MAR (P < 0.001) and BFR/BS (P < 0.001), were reduced in OVx mice compared with the sham group (Table 3). New bone formation parameters were not different between the OVx rats treated with E2 and the sham group. NCG dose-dependently increased the bone formation parameters in OVx mice and at 5 mg·kg−1 exhibited greater effects than both the sham and OVx + E2 groups. Naringenin at 5 mg·kg−1 increased MAR (P < 0.001) and BFR/BS (P < 0.01) compared with OVx + vehicle, but both parameters were less (P < 0.001) than those after NCG at the same dose.
Table 3.
Dynamic bone histomorphometric measurements from femur mid-diaphysis of naringenin-6-C-glucoside (NCG), naringenin (NAR), 17β-oestradiol (E2) and parathyroid hormone [(1–34) PTH] treated OVx mice
| Preventive protocol | ||||||
|---|---|---|---|---|---|---|
| Parameter | Sham | OVx | NCG-1 | NCG-5 mg·kg−1·d−1 | NAR-5 | E2-5 5 µg·kg−1·d−1 |
| MAR (µm·day−1) | 2.13 ± 0.02***,y,r | 1.50 ± 0.08c,z,r | 1.60 ± 0.02***,c,z,r | 2.40 ± 0.03***,c,z,r | 1.83 ± 0.03***,c,r | 2.10 ± 0.02***,z |
| BFR/BS (µm3·µm−2·year−1) | 667.89 ± 11.22***,z | 472 ± 19.35c,z,r | 661.34 ± 11.43***,z | 761.42 ± 12.72***,c,z,r | 574.62 ± 4.44**,c,r | 644.70 ± 5.12***,z |
| Therapeutic protocol | |||||
|---|---|---|---|---|---|
| Parameter | Sham | OVx | NCG-5 | NAR-5 mg·kg−1·d−1 | iPTH 40 µg·kg−1·d−1, 5d·week−1 |
| MAR (µm·day−1) | 1.325 ± 0.038*,z | 1.133 ± 0.031a,n | 1.371 ± 0.046**,y | 1.138 ± 0.04b,n | 1.469 ± 0.070***,z |
| BFR/BS (µm3·µm−2·year−1) | 407.78 ± 12.62*,y | 350.48 ± 7.87a,n | 403.21 ± 11.69**,y | 342.66 ± 7.06b,n | 436.77 ± 21.14***,z |
P < 0.05
P < 0.01
P < 0.001 versus OVx
P < 0.05
P < 0.01
P < 0.001 versus sham
P < 0.01
P < 0.001 versus NAR
P < 0.001 versus E2
P < 0.001 versus iPTH.
Results are mean ± SEM, n = 6 mice per group. NCG-1, NCG-5, NCG at 1 or 5 mg·kg−1·day−1 dose; NAR-5, NARINGENIN at 5 mg·kg−1·day−1 dose; E2-5 = 17β-oestradiol at 5 µg·kg−1·day−1 dose; iPTH, human PTH at 40 µg·kg−1 for 5 days in a week.
BFR/BS, bone forming rate/bone surface; MAR, mineral appositional rate.
To further evaluate the bone anabolic effect of NCG, we measured MAR and BFR/BS in osteopenic mice and compared those data with PTH treatment. With this therapeutic regimen, after NCG (5 mg·kg−1) treatment, the osteopenic OVx mice had MAR and BFR/BS values comparable with that of the sham group. PTH treatment also raised these parameters, compared with the OVx + Vehicle group (P < 0.001). However, the osteopenic OVx mice treated with naringenin at 5 mg·kg−1 showed MAR and BFR/BS values, not different from those of the OVx + vehicle group (Table 3).
Effect of NCG on ER regulation of osteoblast function, ER expression and ER transactivation
To investigate the mechanism by which NCG exerted bone anabolic effects in E2 deficient mice, we tested the involvement of the ERs in the action of NCG in osteoblasts. As shown in Figure 8A, the anti-oestrogen compound, ICI-182780, abolished the effects of NCG on ALP activity, mRNA levels of BMP-2 and RUNX2 in MOBs.
Figure 8.
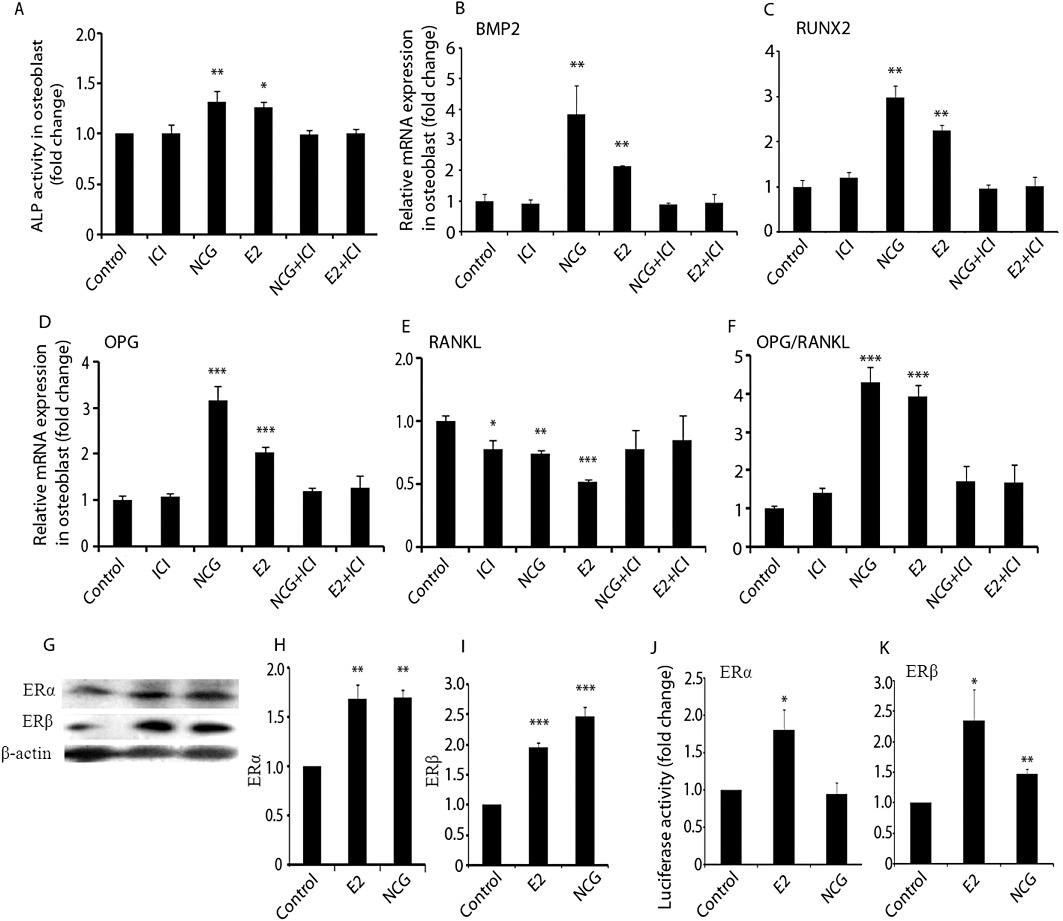
NCG stimulates osteoblast differentiation via ER signalling. (A) MOBs (2000 cells) in 96-well plates were treated with vehicle, E2 (10 nM) or NCG (100 nM) in the presence or absence of ICI 182780 (1 nM) for 48 h. ALP activity was determined as described in Figure 1A. RNA was isolated after 48 h of treatment in the presence or absence of ICI182780 and qPCR was performed for BMP2 (B), RUNX2 (C), OPG (D) and RANKL (E). (F) OPG-to-RANKL ratio based on their mRNA levels. (G) Protein blots of ERα and ERβ. Osteoblasts were treated with or without E2 (10 nM) or NCG (100 nM) for 24 h. Proteins extracted from cell lysates were transblotted onto a membrane and probed with anti-ERα and anti-ERβ primary antibodies followed by the corresponding secondary antibodies. (H and I) Relative intensity of chemiluminescence was measured and individual ER to β-actin ratio was calculated. (J and K) For measuring ERE dependent activity, Huh7 cells were co-transfected with 50 ng ERα or ERβ plasmid, 200 ng ERE-containing luciferase reporter plasmid, and 50 ng pEGFP internal reporter plasmid using the Lipofectamine LTS reagent according to the manufacturer's instructions. Transfected cells were treated with vehicle, E2 (10 nM) or NCG (100 nM) for 24 h. The ERE firefly luciferase activities were normalized for pEGFP values. Results were obtained from three independent experiments in triplicate and data were expressed as mean ± SEM. *P < 0.05; **P < 0.01; ***P < 0.001 versus control.
Osteoblasts also produce OPG and RANKL, which critically regulate osteoclastogenesis (Khosla, 2001). NCG or E2 enhanced mRNA levels of OPG and this inductive effect was abolished by ICI 182780 (Figure 8B). RANKL expression was robustly inhibited by E2 (P < 0.001) and, to a lesser extent, by NCG (P < 0.01) (Figure 8C). ICI 182780 alone modestly inhibited RANKL expression (P < 0.05). Co-treatment with ICI 182780 completely reversed the suppressive effect of E2 or NCG on RANKL expression. The ratio of mRNA for OPG to that for RANKL was increased in MOBs in response to treatment with E2 or NCG (Figure 8D, P < 0.001). Co-treatment of MOBs with ICI 182780 prevented the effects of E2 or NCG on this ratio.
Because E2 increases the production of ERα and ERβ in osteoblasts, we next assessed the effect of NCG on the expression of these two ER isoforms in MOBs. Figure 8E showed that, compared with control cells, NCG increased ERα (P < 0.01) and ERβ (P < 0.001) protein levels and the effect was comparable to that of E2. These data corroborated our in vivo data in Figure 2 showing increased ERα and ERβ mRNA levels in the calvariae of newborn rats after NCG treatment. We next assessed the possible transactivation of ERs by NCG in ER negative Huh7 cells. Figure 8F showed that whereas treatment with E2 augmented both ERα (P < 0.05) and ERβ (P < 0.05) activities on the respective ERE-driven luciferase reporter, NCG increased only ERβ (P < 0.01), but not ERα activity.
Discussion
Citrus and other fruits are rich sources of naringenin, isosakuranetin, poncirin and phloretin (Albach et al., 1981; Dunlap et al., 1962; Manach et al., 2004). NCG, however, is not present in fruits and has been isolated from the bark of an Indian medicinal plant, U. wallichiana, which is known for ethno-traditional use in fracture healing (Jain, 1991; Gaur, 1999). NCG was maximally enriched among the other bioactive compounds present in the most potent bone preserving fraction of the extract of U. wallichiana, assayed in rats (Rawat et al., 2009; Sharan et al.,2010). In the present work, NCG stimulated osteoblast differentiation with considerably higher potency (nM) than naringenin (µM), suggesting that the addition of a C-linked sugar to naringenin to yield NCG, contributed to the robust increase in osteogenic efficacy. Absence of a stimulatory effect of NCG at higher (micromolar) concentrations is consistent with other reports showing loss of biological activities of flavonoids at elevated concentrations (Dang et al., 2003; Kakai et al., 1992). Alternatively, NCG at higher concentrations could be rapidly metabolized due to the induction of a hitherto unknown drug metabolizing enzyme specific for NCG.
Isosakuranetin, poncirin or phloretin had no effect on osteoblast differentiation, whereas the disaccharide of naringenin, naringin, has been reported to stimulate osteoblast differentiation at nM concentrations (Wu et al., 2008). A structure-activity analysis based on our present and earlier results suggests that the naringenin ring per se is crucial for the osteogenic effect because chalconization as in phloretin (the dihydrochalcone derivative of naringenin) and 4’-methoxy substitution as in isosakuranetin and poncirin, abolished the osteoblast differentiation effect of naringenin. Glycosylation, regardless of its C- or O linkage to naringenin, appears to increase osteogenic function in vitro as NCG (this report) or naringin (Wu et al., 2008) stimulated osteoblast differentiation more potently than the aglycone, naringenin. However, despite its potent osteoblast promoting effect in vitro, a high dose of naringin (400mg.kg-1.day-1) was required for bone-sparing effects in OVx mice (Pang et al., 2010), which could be due to the conversion of naringin to naringenin in vivo, suggesting poor bioavailability of naringin.
By itself naringenin has low oral bioavailability due chiefly to its hydrophobic ring structure (Felgines et al., 2000). Given the numerous preclinical studies showing beneficial effects of naringenin in cancer (Guthrie et al., 1998), inflammation and obesity (Mulvihill et al., 2009; Mulvihill et al., 2010), efforts are underway to enhance its bioavailability to improve the therapeutic potential of naringenin (Shulman et al., 2011). Greater bioavailability of NCG compared to naringenin suggests that C-glycosylation may have improved the hydrophilicity of naringenin, leading to better absorption of NCG over naringenin. Moreover, an acid-resistant and largely enzyme-resistant C-glycoside (C-C) bond in NCG, in contrast to the O-glucoside (C-O) bond in naringin, the latter being more prone to cleavage by gut microflora, appears to confer a greater metabolic stability and a better oral bioavailability to naringenin (Prasain et al., 2007).
Based on our findings that NCG has greater osteoblast differentiation effects and oral bioavailability than naringenin, we subsequently studied the in vivo osteogenic effect of these two flavanones. Short term administration of NCG but not naringenin induced mRNA levels of ERα, ERβ and BMP-2 in calvaria from new-born mice, suggesting improved osteogenic efficacy over naringenin in vivo. We then provided several pieces of evidence of the greater osteogenic effect of NCG compared with naringenin. Firstly; in OVx mice NCG increased the differentiation of bone marrow progenitor cells to osteogenic lineage, as well as the mRNA for the key osteogenic genes for RUNX2 and type I collagen in the femur when given immediately after OVx (preventive regimen). The effect of NCG (5mg.kg-1) was equivalent to E2 and better than that of naringenin at the identical dose.
Secondly, the trabecular microarchitecture was adequately preserved in OVx mice that received NCG treatment in the preventive regimen. Erosion of trabecular bone and deterioration of its microarchitecture are hallmarks of osteoporosis induced by E2 deficiency (Sharan et al., 2010; Wronski et al., 1988). In the distal femoral epiphysis, NCG was on a par with E2 in mitigating microarchitectural loss. The stability of trabecular bone is importantly dependent on structural parameters, such as CD, SMI and Tb.pf (Siddiqui et al., 2011). In contrast to data from the OVx + vehicle group, the higher CD, preferred plate-like structure (lower SMI) and more concave trabecular surface (lower Tb.pf), presented a more compact and well connected spongy lattice in NCG treated mice, results that were comparable to the E2 group. These findings suggested a better geometric configuration of the trabecular bone after NCG treatment that would resist compression fracture. In the tibia metaphysis, NCG treatment had Tb.Th, Tb.N, Tb.Pf and SMI values comparable to those in the E2 group. However, NCG induced a better response in BV/TV and Tb.sp than E2 treatment. These results suggested that, generally, the effects of NCG treatment on trabecular structure (connectivity and hole size) and microarchitecture (bone geometry) was better than those of E2 treatment. Although naringenin had some positive effects in the femur epiphysis, it was completely ineffective in preserving trabecular microarchitecture of tibia metaphysis in OVx mice in the preventive protocol, which suggested that naringenin was generally less efficient than NCG. However, when compared to the reported bone conserving doses of naringin (200 and 400mg.kg-1) in OVx mice, naringenin showed better efficacy than naringin, in the femur.
Thirdly, the trabecular microarchitecture was restored in osteopenic OVx mice that received it in the therapeutic protocol. Because restoration of microarchitecture parameters is necessary to evaluate the true impact of anabolic treatment on the quality of trabecular bone, we used mice that were OVx 6 weeks before the start of the NCG treatment (therapeutic regimen). NCG or PTH (the clinically used bone anabolic agent) treatment of osteopenic OVx mice revealed comparable microarchitectural parameters with the sham in the distal femoral epiphysis and tibial metaphysis, suggesting a complete restoration of trabecular bone and geometry. Unlike NCG, naringenin treatment was ineffective in restoring the lost trabecular bones of osteopenic OVx mice, at either site, suggesting that naringenin had no anabolic effect in osteopenic bones.
Fourthly, the in situ dynamic determinants of new bone formation including MAR and BFS/BS at the femur mid-diaphysis during the treatment period were markedly increased by NCG in the preventive protocol, suggesting that NCG stimulated periosteal apposition and cortical thickness relative to the OVx + vehicle group. NCG was more effective than naringenin in terms of bone formation indices. Deposition of new bone under osteopenic condition constitutes the most valid assessment of the anabolic effect of a given agent and PTH is known to promote cortical thickness of long bones by increasing periosteal apposition in osteopenic mice (Alexander et al., 2001). NCG had comparable MAR and BFR/BS to iPTH in osteopenic mice, demonstrating its bone anabolic effects in vivo, which appeared to be mediated by its stimulation of osteoblast differentiation in vitro as well as ex vivo cultures of bone marrow cells from the NCG treated mice. MAR and BFR/BS in the naringenin treated group were comparable to the OVx group, suggesting a lack of bone anabolic effect of naringenin, when given in the therapeutic protocol.
Because NCG exhibited osteogenic effects in oestrogen deficient mice, direct evidence of ER involvement in NCG action was investigated in cell cultures. To start with, the stimulatory effect of NCG on osteoblast differentiation was abolished by co-treatment with ICI 182780, a specific ER antagonist (Osborne et al., 2004), suggesting that the ERs were involved in mediating the actions of NCG in osteoblast differentiation. Furthermore, NCG reciprocally regulated the expression of additional ER-responsive osteoblast genes, OPG and RANKL – stimulated OPG and suppressed RANKL transcripts – in MOBs, resulting in an increase in the OPG: RANKL mRNA ratio, an effect suppressed by ICI 182780. These results imply that NCG could mimic E2 to suppress the process of osteoclastogenesis through its direct actions on modulating the expression of OPG and RANKL in osteoblasts. Transfection studies showed that NCG induced ERE-dependent luciferase activity via ERβ but not ERα, suggesting a ERβ selective action of NCG in contrast to the equal activation of both ER types by naringin or naringenin, in similar assays. Attributing ERβ selectivity to C-glucosylation of naringenin would be premature given that NCG increased both ER isoforms in mouse calvaria in vivo. Selectivity of ERβ over ERα transactivation has been reported for some isoflavonoids, including genistein, daidzein and medicarpin (Bhargavan et al., 2010; Kuiper et al., 1998). To our knowledge, this is the first report showing selective ERβ transactivation by any flavanone. Although NCG transactivated ERβ, as did genistein or daidzein, NCG appeared to be more potent than these isoflavonoids given that they require µM concentrations to stimulate osteoblast differentiation.
Despite ER activation in osteoblasts, a key advantage of NCG in correcting OVx-induced bone loss was the absence of the uterotrophic effect associated with E2. Assessments of wet weight, luminal area and luminal epithelial cell height of uterus showed no E2-like effect of NCG, whereas naringenin exhibited significant uterotrophic effects at its osteoprotective dose. Because the in vitro anti-proliferative effect of naringenin in cancer cells appears to be an anti-oestrogenic effect because of the post translational down-modulation of ERα (Galluzzo et al., 2008), our data demonstrating in vivo uterine oestrogenicity of naringenin raises an important safety concern. However, NCG exhibited no uterine oestrogenicity suggesting that it would be safer than naringenin for use in postmenopausal osteoporosis.
In conclusion, the results of the present study demonstrate that NCG, a derivative of naringenin from U. wallichiana, was the most potent of several naturally occurring derivatives of naringenin in stimulating osteoblast function and exerting bone anabolic action during E2 deficiency in preventive as well as therapeutic regimens, through osteoblast ER signaling. Given its lack of uterine oestrogenicity, the low oral dose required for bone anabolic effect and the prolonged systemic biovailability, NCG could be an attractive alternative anabolic strategy for the development of new treatments for postmenopausal osteoporosis.
Acknowledgments
Authors gratefully acknowledge generous funding from Ministry of Health and Family Welfare (grant-in-aid), Council of Scientific and Industrial Research (NWP0034), Government of India; and Department of Biotechnology, Government of India (SS) and Indian Council of Medical Research, Government of India (NC).
Glossary
- ALP
alkaline phosphatase
- BFR
bone formation rate
- BFR/BS
bone forming rate/bone surface
- BMP2
bone morphogenetic protein
- BV/TV
bone volume/trabecular volume
- CD
connectivity density
- E2
17β-oestradiol
- ERE
oestrogen responsive element
- ER
oestrogen receptor
- ERT
oestrogen replacement therapy
- FBS
fetal bovine serum
- GAPDH
glyceraldehyde 3-phosphate dehydrogenase
- IAEC
Institutional Animal Ethics Committee
- MAR
mineral appositional rate
- MOBs
mouse calvarial osteoblasts
- NCG
naringenin-6-C-glucoside
- OPG
osteoprotegerin
- OVx
ovariectomized
- PNPP
p-nitrophenylphosphate
- PTH
parathyroid hormone
- qPCR
quantitative real-time polymerase chain reaction
- RANKL
receptor activator of nuclear factor kappa B ligand
- RUNX2
runt-related transcription factor 2
- SMI
structure model index
- Tb.N
trabecular number
- Tb.pf
trabecular pattern factor
- Tb.sp
trabecular separation
- Tb.th
trabecular thickness
- µCT
microcomputed tomography
Conflict of interest
All authors have no conflict of interest.
References
- Albach RF, Redman GH, Cruse RR, Petersen HD. Seasonal variation of bitterness components, pulp, and vitamin C in Texas commercial citrus juices. J Agric Food Chem. 1981;29:805–808. doi: 10.1021/jf00106a030. [DOI] [PubMed] [Google Scholar]
- Alexander JM, Bab I, Fish S, Muller R, Uchiyama T, Gronowicz G, et al. Human parathyroid hormone 1-34 reverses bone loss in ovariectomized mice. J Bone Miner Res. 2001;16:1665–1673. doi: 10.1359/jbmr.2001.16.9.1665. [DOI] [PubMed] [Google Scholar]
- Arjmandi BH. The role of phytoestrogens in the prevention and treatment of osteoporosis in ovarian hormone deficiency. J Am Coll Nutr. 2001;20(5 Suppl):398S–402S. doi: 10.1080/07315724.2001.10719175. discussion 417S–420S. [DOI] [PubMed] [Google Scholar]
- Bhargavan B, Gautam AK, Singh D, Kumar A, Chaurasia S, Tyagi AM, et al. Methoxylated isoflavones, cajanin and isoformononetin, have non-estrogenic bone forming effect via differential mitogen activated protein kinase (MAPK) signaling. J Cell Biochem. 2009;108:388–399. doi: 10.1002/jcb.22264. [DOI] [PubMed] [Google Scholar]
- Bhargavan B, Singh D, Gautam AK, Mishra JS, Kumar A, Goel A, et al. Medicarpin, a legume phytoalexin, stimulates osteoblast differentiation and promotes peak bone mass achievement in rats: evidence for estrogen receptor beta-mediated osteogenic action of medicarpin. J Nutr Biochem. 2011 doi: 10.1016/j.jnutbio.2010.11.002. PMID 21333515. [DOI] [PubMed] [Google Scholar]
- Carusi D. Phytoestrogens as hormone replacement therapy: an evidence-based approach. Prim Care Update Ob Gyns. 2000;7:253–259. doi: 10.1016/s1068-607x(00)00055-x. [DOI] [PubMed] [Google Scholar]
- Chiba H, Uehara M, Wu J, Wang X, Masuyama R, Suzuki K, et al. Hesperidin, a citrus flavonoid, inhibits bone loss and decreases serum and hepatic lipids in ovariectomized mice. J Nutr. 2003;133:1892–1897. doi: 10.1093/jn/133.6.1892. [DOI] [PubMed] [Google Scholar]
- Choudhury R, Chowrimootoo G, Srai K, Debnam E, Rice-Evans CA. Interactions of the flavonoid naringenin in the gastrointestinal tract and the influence of glycosylation. Biochem Biophys Res Commun. 1999;265:410–415. doi: 10.1006/bbrc.1999.1695. [DOI] [PubMed] [Google Scholar]
- Chow JW, Lean JM, Chambers TJ. 17 beta-estradiol stimulates cancellous bone formation in female rats. Endocrinology. 1992;130:3025–3032. doi: 10.1210/endo.130.5.1572310. [DOI] [PubMed] [Google Scholar]
- Coxam V. Phyto-oestrogens and bone health. Proc Nutr Soc. 2008;67:184–195. doi: 10.1017/S0029665108007027. [DOI] [PubMed] [Google Scholar]
- Dang ZC, Audinot V, Papapoulos SE, Boutin JA, Lowik CW. Peroxisome proliferator-activated receptor gamma (PPARgamma) as a molecular target for the soy phytoestrogen genistein. J Biol Chem. 2003;278:962–967. doi: 10.1074/jbc.M209483200. [DOI] [PubMed] [Google Scholar]
- Delmas PD. HRT in the prevention and treatment of osteoporosis. J Epidemiol Biostat. 1999;4:155–160. discussion 160–153. [PubMed] [Google Scholar]
- Dunlap WJ, Wender SH. Identification studies on some minor flavonoid constituents of the grapefruit. Anal Biochem. 1962;4:110–115. doi: 10.1016/0003-2697(62)90026-x. [DOI] [PubMed] [Google Scholar]
- Ernst M, Schmid C, Froesch ER. Enhanced osteoblast proliferation and collagen gene expression by estradiol. Proc Natl Acad Sci U S A. 1988;85:2307–2310. doi: 10.1073/pnas.85.7.2307. [DOI] [PMC free article] [PubMed] [Google Scholar]
- Felgines C, Texier O, Morand C, Manach C, Scalbert A, Regerat F, et al. Bioavailability of the flavanone naringenin and its glycosides in rats. Am J Physiol Gastrointest Liver Physiol. 2000;279:G1148–G1154. doi: 10.1152/ajpgi.2000.279.6.G1148. [DOI] [PubMed] [Google Scholar]
- Galluzzo P, Ascenzi P, Bulzomi P, Marino M. The nutritional flavanone naringenin triggers antiestrogenic effects by regulating estrogen receptor alpha-palmitoylation. Endocrinology. 2008;149:2567–2575. doi: 10.1210/en.2007-1173. [DOI] [PubMed] [Google Scholar]
- Garnett T, Studd J, Watson N, Savvas M. A cross-sectional study of the effects of long-term percutaneous hormone replacement therapy on bone density. Obstet Gynecol. 1991;78:1002–1007. [PubMed] [Google Scholar]
- Gautam AK, Bhargavan B, Tyagi AM, Srivastava K, Yadav DK, Kumar M, et al. Differential effects of formononetin and cladrin on osteoblast function, peak bone mass achievement and bioavailability in rats. J Nutr Biochem. 2010;22:318–327. doi: 10.1016/j.jnutbio.2010.02.010. [DOI] [PubMed] [Google Scholar]
- Gregory CA, Gunn WG, Peister A, Prockop DJ. An Alizarin red-based assay of mineralization by adherent cells in culture: comparison with cetylpyridinium chloride extraction. Anal Biochem. 2004;329:77–84. doi: 10.1016/j.ab.2004.02.002. [DOI] [PubMed] [Google Scholar]
- Gupta S, Kuhnisch J, Mustafa A, Lhotak S, Schlachterman A, Slifker MJ, et al. Mouse models of cystathionine beta-synthase deficiency reveal significant threshold effects of hyperhomocysteinemia. FASEB J. 2009;23:883–893. doi: 10.1096/fj.08-120584. [DOI] [PMC free article] [PubMed] [Google Scholar]
- Guthrie N, Carroll KK. Inhibition of mammary cancer by citrus flavonoids. Adv Exp Med Biol. 1998;439:227–236. doi: 10.1007/978-1-4615-5335-9_16. [DOI] [PubMed] [Google Scholar]
- Hildebrand T, Rüegsegger P. A new method for the model-independent assessment of thickness in three-dimensional images. J Microsc. 1997;185:67–75. [Google Scholar]
- Hillard TC, Whitcroft S, Ellerington MC, Whitehead MI. The long-term risks and benefits of hormone replacement therapy. J Clin Pharm Ther. 1991;16:231–245. doi: 10.1111/j.1365-2710.1991.tb00310.x. [DOI] [PubMed] [Google Scholar]
- Ishimi Y. [Prevention of osteoporosis by foods and dietary supplements. Soybean isoflavone and bone metabolism] Clin Calcium. 2006;16:1661–1667. [PubMed] [Google Scholar]
- Kakai Y, Kawase T, Nakano T, Mikuni-Takagaki Y, Saito S. Effect of ipriflavone and estrogen on the differentiation and proliferation of osteogenic cells. Calcif Tissue Int. 1992;51(Suppl. 1):S11–S15. doi: 10.1007/BF02180243. [DOI] [PubMed] [Google Scholar]
- Khosla S. Minireview: the OPG/RANKL/RANK system. Endocrinology. 2001;142:5050–5055. doi: 10.1210/endo.142.12.8536. [DOI] [PubMed] [Google Scholar]
- Komm BS, Terpening CM, Benz DJ, Graeme KA, Gallegos A, Korc M, et al. Estrogen binding, receptor mRNA, and biologic response in osteoblast-like osteosarcoma cells. Science. 1988;241:81–84. doi: 10.1126/science.3164526. [DOI] [PubMed] [Google Scholar]
- Kuiper GG, Lemmen JG, Carlsson B, Corton JC, Safe SH, van der Saag PT, et al. Interaction of estrogenic chemicals and phytoestrogens with estrogen receptor beta. Endocrinology. 1998;139:4252–4263. doi: 10.1210/endo.139.10.6216. [DOI] [PubMed] [Google Scholar]
- Langer RD, White E, Lewis CE, Kitchen JM, Hendrix SL, Trevisan M. The women's health initiative observational study: baseline characteristics of participants and reliability of baseline measures. Ann Epidemiol. 2003;13:S107–S121. doi: 10.1016/s1047-2797(03)00047-4. [DOI] [PubMed] [Google Scholar]
- Lien LL, Lien EJ. Hormone therapy and phytoestrogens. J Clin Pharm Ther. 1996;21:101–111. doi: 10.1111/j.1365-2710.1996.tb00008.x. [DOI] [PubMed] [Google Scholar]
- Lobo RA. Benefits and risks of estrogen replacement therapy. Am J Obstet Gynecol. 1995;173(3 Pt 2):982–989. doi: 10.1016/0002-9378(95)90247-3. [DOI] [PubMed] [Google Scholar]
- Maggio M. Estrogen replacement therapy and endometrial cancer: the elusive link. J Nurse Midwifery. 1980;25:19–21. doi: 10.1016/0091-2182(80)90126-3. [DOI] [PubMed] [Google Scholar]
- Manach C, Scalbert A, Morand C, Remesy C, Jimenez L. Polyphenols: food sources and bioavailability. Am J Clin Nutr. 2004;79:727–747. doi: 10.1093/ajcn/79.5.727. [DOI] [PubMed] [Google Scholar]
- Maurya R, Yadav DK, Singh G, Bhargavan B, Narayana Murthy PS, Sahai M, et al. Osteogenic activity of constituents from Butea monosperma. Bioorg Med Chem Lett. 2009;19:610–613. doi: 10.1016/j.bmcl.2008.12.064. [DOI] [PubMed] [Google Scholar]
- Morishima I, Sone T, Mokuno S, Taga S, Shimauchi A, Oki Y, et al. Clinical significance of no-reflow phenomenon observed on angiography after successful treatment of acute myocardial infarction with percutaneous transluminal coronary angioplasty. Am Heart J. 1995;130:239–243. doi: 10.1016/0002-8703(95)90434-4. [DOI] [PubMed] [Google Scholar]
- Muhlbauer RC, Lozano A, Reinli A, Wetli H. Various selected vegetables, fruits, mushrooms and red wine residue inhibit bone resorption in rats. J Nutr. 2003;133:3592–3597. doi: 10.1093/jn/133.11.3592. [DOI] [PubMed] [Google Scholar]
- Mulvihill EE, Huff MW. Antiatherogenic properties of flavonoids: implications for cardiovascular health. Can J Cardiol. 2010;26(Suppl. A):17A–21A. doi: 10.1016/s0828-282x(10)71056-4. [DOI] [PubMed] [Google Scholar]
- Mulvihill EE, Allister EM, Sutherland BG, Telford DE, Sawyez CG, Edwards JY, et al. Naringenin prevents dyslipidemia, apolipoprotein B overproduction, and hyperinsulinemia in LDL receptor-null mice with diet-induced insulin resistance. Diabetes. 2009;58:2198–2210. doi: 10.2337/db09-0634. [DOI] [PMC free article] [PubMed] [Google Scholar]
- Nilsson S, Makela S, Treuter E, Tujague M, Thomsen J, Andersson G, et al. Mechanisms of estrogen action. Physiol Rev. 2001;81:1535–1565. doi: 10.1152/physrev.2001.81.4.1535. [DOI] [PubMed] [Google Scholar]
- Osborne CK, Wakeling A, Nicholson RI. Fulvestrant: an oestrogen receptor antagonist with a novel mechanism of action. Br J Cancer. 2004;90(Suppl. 1):S2–S6. doi: 10.1038/sj.bjc.6601629. [DOI] [PMC free article] [PubMed] [Google Scholar]
- Pang WY, Wang XL, Mok SK, Lai WP, Chow HK, Leung PC, et al. Naringin improves bone properties in ovariectomized mice and exerts oestrogen-like activities in rat osteoblast-like (UMR-106) cells. Br J Pharmacol. 2010;159:1693–1703. doi: 10.1111/j.1476-5381.2010.00664.x. [DOI] [PMC free article] [PubMed] [Google Scholar]
- Prasain JK, Barnes S. Metabolism and bioavailability of flavonoids in chemoprevention: current analytical strategies and future prospectus. Mol Pharm. 2007;4:846–864. doi: 10.1021/mp700116u. [DOI] [PubMed] [Google Scholar]
- Rawat P, Kumar M, Sharan K, Chattopadhyay N, Maurya R. Ulmosides A and B: flavonoid 6-C-glycosides from Ulmus wallichiana, stimulating osteoblast differentiation assessed by alkaline phosphatase. Bioorg Med Chem Lett. 2009;19:4684–4687. doi: 10.1016/j.bmcl.2009.06.074. [DOI] [PubMed] [Google Scholar]
- Sharan K, Siddiqui JA, Swarnkar G, Maurya R, Chattopadhyay N. Role of phytochemicals in the prevention of menopausal bone loss: evidence from in vitro and in vivo, human interventional and pharma-cokinetic studies. Curr Med Chem. 2009;16:1138–1157. doi: 10.2174/092986709787581806. [DOI] [PubMed] [Google Scholar]
- Sharan K, Siddiqui JA, Swarnkar G, Tyagi AM, Kumar A, Rawat P, et al. Extract and fraction from Ulmus wallichiana Planchon promote peak bone achievement and have a nonestrogenic osteoprotective effect. Menopause. 2010a;17:393–402. doi: 10.1097/gme.0b013e3181bfae38. [DOI] [PubMed] [Google Scholar]
- Sharan K, Swarnkar G, Siddiqui JA, Kumar A, Rawat P, Kumar M, et al. A novel flavonoid, 6-C-beta-d-glucopyranosyl-(2S,3S)-(+)-3′,4′,5,7-tetrahydroxyflavanone, isolated from Ulmus wallichiana Planchon mitigates ovariectomy-induced osteoporosis in rats. Menopause. 2010b;17:577–586. doi: 10.1097/gme.0b013e3181d2ce7f. [DOI] [PubMed] [Google Scholar]
- Sharan K, Mishra JS, Swarnkar G, Siddiqui JA, Khan K, Kumari R, et al. A novel quercetin analog from an Indian medicinal plant promotes peak bone mass achievement, bone healing after injury and exerts anabolic effect on osteoporotic bone: evidence toward the role of arylydrocarbon receptor as a mediator of osteogenic action. JBMR. 2011;26:2096–2111. doi: 10.1002/jbmr.434. [DOI] [PubMed] [Google Scholar]
- Shulman M, Cohen M, Soto-Gutierrez A, Yagi H, Wang H, Goldwasser J, et al. Enhancement of naringenin bioavailability by complexation with hydroxypropoyl-beta-cyclodextrin. PLoS ONE. 2011;6:e18033. doi: 10.1371/journal.pone.0018033. [DOI] [PMC free article] [PubMed] [Google Scholar]
- Siddiqui JA, Swarnkar G, Sharan K, Chakravarti B, Sharma G, Rawat P, et al. 8,8″-Biapigeninyl stimulates osteoblast functions and inhibits osteoclast and adipocyte functions: osteoprotective action of 8,8″-biapigeninyl in ovariectomized mice. Mol Cell Endocrinol. 2010;323:256–267. doi: 10.1016/j.mce.2010.03.024. [DOI] [PubMed] [Google Scholar]
- Siddiqui JA, Sharan K, Swarnkar G, Rawat P, Kumar M, Manickavasagam L, et al. Quercetin-6-C-beta-D-glucopyranoside isolated from Ulmus wallichiana planchon is more potent than quercetin in inhibiting osteoclastogenesis and mitigating ovariectomy-induced bone loss in rats. Menopause. 2011a;18:198–207. doi: 10.1097/gme.0b013e3181e84e67. [DOI] [PubMed] [Google Scholar]
- Siddiqui JA, Swarnkar G, Sharan K, Chakravarti B, Gautam AK, Rawat P, et al. A naturally occurring rare analog of quercetin promotes peak bone mass achievement and exerts anabolic effect on osteoporotic bone. Osteoporos Int. 2011b doi: 10.1007/s00198-010-1519-4. PMID 21225417. [DOI] [PubMed] [Google Scholar]
- Smith EP, Boyd J, Frank GR, Takahashi H, Cohen RM, Specker B, et al. Estrogen resistance caused by a mutation in the estrogen-receptor gene in a man. N Engl J Med. 1994;331:1056–1061. doi: 10.1056/NEJM199410203311604. [DOI] [PubMed] [Google Scholar]
- Steinberg KK, Thacker SB, Smith SJ, Stroup DF, Zack MM, Flanders WD, et al. A meta-analysis of the effect of estrogen replacement therapy on the risk of breast cancer. JAMA. 1991;265:1985–1990. [PubMed] [Google Scholar]
- Studd J, Savvas M, Waston N, Garnett T, Fogelman I, Cooper D. The relationship between plasma estradiol and the increase in bone density in postmenopausal women after treatment with subcutaneous hormone implants. Am J Obstet Gynecol. 1990;163(5 Pt 1):1474–1479. doi: 10.1016/0002-9378(90)90608-a. [DOI] [PubMed] [Google Scholar]
- Studd JW, Holland EF, Leather AT, Smith RN. The dose-response of percutaneous oestradiol implants on the skeletons of postmenopausal women. Br J Obstet Gynaecol. 1994;101:787–791. doi: 10.1111/j.1471-0528.1994.tb11947.x. [DOI] [PubMed] [Google Scholar]
- Swarnkar G, Sharan K, Siddiqui JA, Chakravarti B, Rawat P, Kumar M, et al. A novel flavonoid isolated from the steam-bark of Ulmus Wallichiana Planchon stimulates osteoblast function and inhibits osteoclast and adipocyte differentiation. Eur J Pharmacol. 2011;658:65–73. doi: 10.1016/j.ejphar.2011.02.032. [DOI] [PubMed] [Google Scholar]
- Takano-Yamamoto T, Rodan GA. Direct effects of 17 beta-estradiol on trabecular bone in ovariectomized rats. Proc Natl Acad Sci USA. 1990;87:2172–2176. doi: 10.1073/pnas.87.6.2172. [DOI] [PMC free article] [PubMed] [Google Scholar]
- Trivedi R, Kumar S, Kumar A, Siddiqui JA, Swarnkar G, Gupta V, et al. Kaempferol has osteogenic effect in ovariectomized adult Sprague-Dawley rats. Mol Cell Endocrinol. 2008;289:85–93. doi: 10.1016/j.mce.2008.02.027. [DOI] [PubMed] [Google Scholar]
- Trivedi R, Kumar A, Gupta V, Kumar S, Nagar GK, Romero JR, et al. Effects of Egb 761 on bone mineral density, bone microstructure, and osteoblast function: possible roles of quercetin and kaempferol. Mol Cell Endocrinol. 2009;302:86–91. doi: 10.1016/j.mce.2009.01.011. [DOI] [PubMed] [Google Scholar]
- Turner RT, Riggs BL, Spelsberg TC. Skeletal effects of estrogen. Endocr Rev. 1994;15:275–300. doi: 10.1210/edrv-15-3-275. [DOI] [PubMed] [Google Scholar]
- Tyagi AM, Srivastava K, Kureel J, Kumar A, Raghuvanshi A, Yadav D, et al. Premature T cell senescence in Ovx mice is inhibited by repletion of estrogen and medicarpin: a possible mechanism for alleviating bone loss. Osteoporos Int. 2011 doi: 10.1007/s00198-011-1650-x. PMID 21562872. [DOI] [PubMed] [Google Scholar]
- Vedi S, Purdie DW, Ballard P, Bord S, Cooper AC, Compston JE. Bone remodeling and structure in postmenopausal women treated with long-term, high-dose estrogen therapy. Osteoporos Int. 1999;10:52–58. doi: 10.1007/s001980050194. [DOI] [PubMed] [Google Scholar]
- Verdelis K, Lukashova L, Atti E, Mayer-Kuckuk P, Peterson MG, Tetradis S, et al. MicroCT morphometry analysis of mouse cancellous bone: intra- and inter-system reproducibility. Bone. 2011;49:580–587. doi: 10.1016/j.bone.2011.05.013. [DOI] [PMC free article] [PubMed] [Google Scholar]
- Wong GL, Kent GN, Ku KY, Cohn DV. The interaction of parathormone and calcium on the hormone-regulated synthesis of hyaluronic acid and citrate decarboxylation in isolated bone cells. Endocrinology. 1978;103:2274–2282. doi: 10.1210/endo-103-6-2274. [DOI] [PubMed] [Google Scholar]
- Wood N. The effects of dietary naringenin supplementation on physiological changes in molar crestal alveolar bone-cemento-enamel junction distance in young rats. J Med Food. 2005;8:31–35. doi: 10.1089/jmf.2005.8.31. [DOI] [PubMed] [Google Scholar]
- Wronski TJ, Cintron M, Dann LM. Temporal relationship between bone loss and increased bone turnover in ovariectomized rats. Calcif Tissue Int. 1988;43:179–183. doi: 10.1007/BF02571317. [DOI] [PubMed] [Google Scholar]
- Wu JB, Fong YC, Tsai HY, Chen YF, Tsuzuki M, Tang CH. Naringin-induced bone morphogenetic protein-2 expression via PI3K, Akt, c-Fos/c-Jun and AP-1 pathway in osteoblasts. Eur J Pharmacol. 2008;588:333–341. doi: 10.1016/j.ejphar.2008.04.030. [DOI] [PubMed] [Google Scholar]