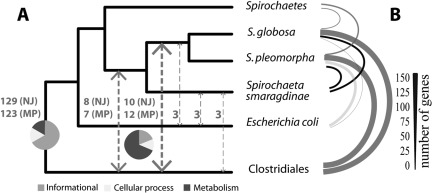
FIG 3 .
HGT between Sphaerochaeta spp. and Clostridiales. The cladogram depicts the 16S rRNA gene phylogeny. Arrows connecting branches represent cases of HGT (A); the values next to the arrows indicate the numbers of genes exchanged (out of a total of 178 genes examined). Pie charts show the distribution of the genes in major COG functional categories (the key at the bottom shows the category designations by color). Orthologous genes shared exclusively by Sphaerochaeta and other taxa are graphically represented by arcs in panel B. The thickness of each arc is proportional to the number of genes shared (see scale bar).

