

Abstract
The side chains of Lys-66, Asp-66, and Glu-66 in staphylococcal nuclease (SNase) are fully buried and surrounded mainly by hydrophobic matter, save for internal water molecules associated with carboxylic oxygen atoms. These ionizable side chains titrate with pKa values of 5.7, 8.8 and 8.9, respectively. To reproduce these pKa values with continuum electrostatics calculations the protein has to be treated with high dielectric constants. We have examined structural origins of these high apparent dielectric constants by using NMR spectroscopy to characterize the structural response to the ionization of these internal side chains. Substitution of Val-66 with Lys-66 and Asp-66 led to increased conformational fluctuations in the microenvironments surrounding these groups, even under conditions of pH where Lys-66 and Asp-66 are neutral. When Lys-66, Asp-66 and Glu-66 are charged the proteins remain almost fully folded but resonances for a few backbone amides adjacent to the internal ionizable residues are broadened. This suggests that the ionization of the internal groups promotes a local increase in dynamics on the intermediate timescale, consistent with either partial unfolding or increased backbone fluctuations in helix-1 near residue 66, or, less likely, with increased fluctuations of the charges side chains at position 66. These experiments confirm that the high apparent dielectric constants reported by the internal Lys-66, Asp-66 and Glu-66 reflect localized changes in conformational fluctuations without incurring detectable, global structural reorganization. To improve structure-based pKa calculations in proteins this coupling between ionization of internal groups and local changes in conformational fluctuations will have to be treated explicitly.
Keywords: dielectric constant, pKa values, electrostatics, NMR, conformational reorganization
Internal ionizable groups in proteins are essential for many biochemical processes1–7. With few exceptions8, the protein interior is typically neither as polar nor as polarizable as water; therefore, internal ionizable groups usually titrate with unusual pKa values that are shifted in the direction that favors the neutral state (i.e., the pKa of internal basic groups are depressed and those of internal acidic groups are elevated)9–14. Owing to their importance in energy transduction and other critical biochemical processes, it is of interest to examine in detail the molecular determinants of pKa value of internal groups.
Some of the factors that can influence the pKa of an internal group are its interactions with surface charges15–17 and with permanent and induced dipoles15,16,18, the reaction field of bulk water19, reorientation of protein permanent dipoles coupled to ionization18,20,21, and interactions with internal water molecules9–11,22,23. The importance of these factors is greatly diminished when the ionization of an internal group triggers significant conformational reorganization. The probability of conformational reorganization is governed partly by the global stability of the native state because this determines the energy gap between the fully folded state and partially or locally unfolded states in which previously buried charged groups can make contact with water. The main goal of this study was to use NMR spectroscopy to examine the type of structural reorganization and changes in conformational fluctuations that can be triggered by the ionization of internal groups.
Val-66 in staphylococcal nuclease (SNase) is embedded in the major hydrophobic core (Fig. 1). Previous studies have shown that the side chains of Lys-66, Asp-66 and Glu-66 engineered by replacement of Val-66 with site-directed mutagenesis are buried deeply in the core9–11,24,25. These groups titrate with pKa values that are shifted by almost 5 pKa units relative to their normal pKa in water9,10,24,25. In structure-based calculations with continuum electrostatics methods the protein has to be treated with dielectric constants near 10 to reproduce the experimental pKa values9,10,24. This dielectric constant is much greater than the values of 2 to 4 measured experimentally with highly dehydrated proteins in parallel plate capacitor experiments26–30, and more similar to the dielectric constants of highly polar and polarizable compounds such as liquid amides31.
Figure 1.
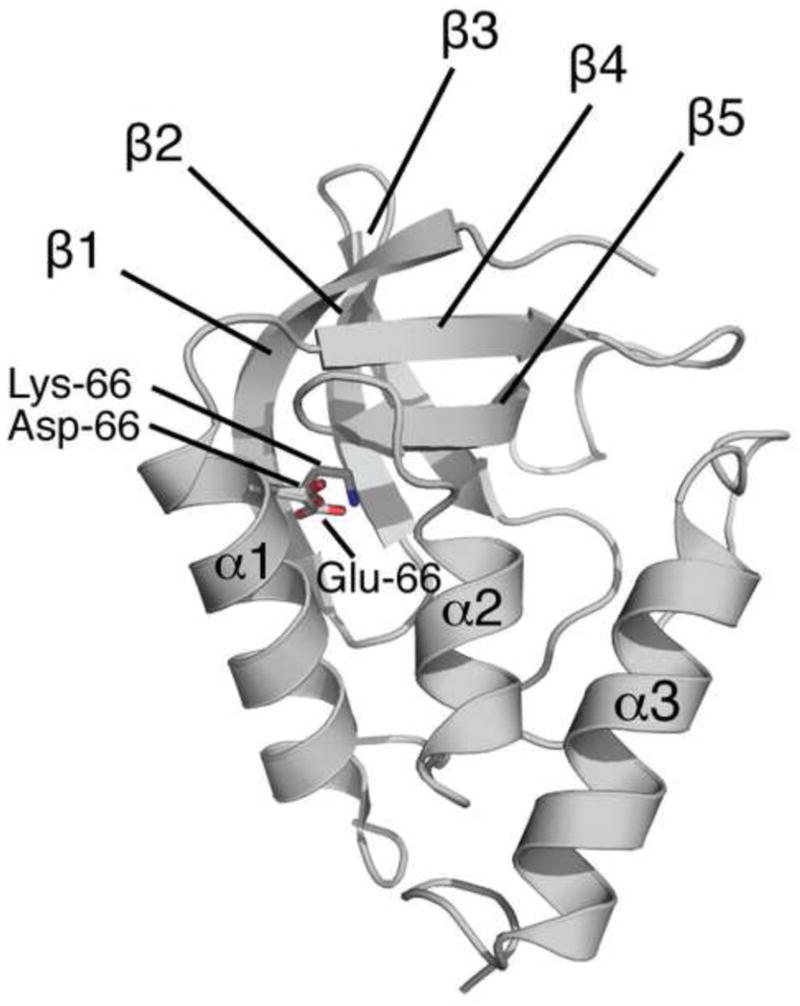
Structure of the Δ+PHS protein. Position 66 is at the interface of α helix-1 and the β-barrel. The side chains of Asp-66 (PDB accession code 2oxp), Glu-66 (PDB accession code 1u9r), and Lys-66 (PDB accession code 2snm), as observed in the crystal structures in which these groups are present, are shown.
The high apparent dielectric constant reported by Lys-66, Asp-66 and Glu-66 was rationalized initially in terms of internal water molecules that were observed near the carboxylic groups of Asp-66 and Glu-66 in crystal structures obtained under cryogenic conditions9,10,24. However, these internal water molecules are not observed in the variant with Lys-669,11,25 or in structures obtained at room temperature22. Furthermore, no internal water molecules with long residence times were found in magnetic resonance dispersion (MRD) studies with the V66K and V66E variants32.
Another hint of the likely structural origins of the high apparent dielectric constant reported by these ionizable groups came from the small changes observed in far UV-CD spectra when Asp-66 is ionized, which are consistent with the loss of a small amount of α-helix24. A similar response was observed with the ionization of Lys-66 and Glu-6633. The significance of these observations is that they suggest that the high apparent polarizability reported by Lys-66, Asp-66 and Glu-66 in SNase originates from conformational reorganization of the backbone when the internal residues become charged. This is also suggested by molecular dynamics calculations showing modest local unfolding and relaxation of the backbone in response to the ionization of these internal ionizable groups23,34–36. Other simulations have also attempted to rationalize the properties of some of these internal ionizable groups in SNase in terms of their ability to promote conformational change upon ionization37–39.
We present results of NMR spectroscopy studies designed to examine the structural response of SNase to the ionization of Lys-66, Asp-66, and Glu-66. One goal was to determine how the response of the protein depended on the type of side chain, its size, and its polarity. 1H, 15N HSQC spectra were acquired over a range of pH values to demonstrate that the proteins were folded both when the internal ionizable groups were neutral and also when they were charged. Backbone assignments were completed for the variants with Asp-66 and Lys-66 with standard three-dimensional methods. Chemical shift analysis was performed to examine structural changes related to the substitution of Val-66 with Lys, Asp, or Glu and to the ionization of these internal groups. Hydrogen exchange data were obtained to describe qualitatively the effects of the ionization of Lys-66 on the structure. The data show that the ionization of the internal groups can trigger subtle structural changes. These data demonstrate the essential role of conformational reorganization or relaxation as a determinant of the magnitude of electrostatic forces in proteins and as a determinant of pKa values of internal groups. Our results imply that the accuracy of computational methods for structure-based electrostatics calculations with proteins cannot improve unless conformational reorganization triggered by the ionization of internal groups is treated explicitly. These experimental data will guide the development of improved methods that attempt to solve this challenging problem37–45.
Results
Staphyloccocal nuclease consists of a small β-barrel and three α-helices46. Position 66 is near the C terminus of helix-1 (Fig. 1). Because the substitution of internal hydrophobic groups in SNase with ionizable residues is always destabilizing47, all studies were performed with a highly stable variant of SNase known as Δ+PHS. At pH 7 the stability of this protein is 11.8 kcal/mol24. This high stability ensured that pH titrations could be performed over a wide range of pH without inducing acid or base denaturation. The Δ+PHS/V66E variant was examined less extensively than the variants with V66D and V66K substitutions owing to its tendency to aggregate and precipitate at pH values above pH 8.0 at concentrations necessary for NMR spectroscopy. The pKa values of the ionizable groups of interest have been measured previously: Lys-66 titrates with a pKa of 5.725 and Glu-66 and Asp-66 titrate with pKa values of 8.8 and 8.9, respectively 10,24. These pKa values are very different from the normal values of 10.4, 4.0 and 4.5 for the titration of Lys, Asp, and Glu in water, respectively.
Spectral assignments
The 1H, 15N HSQC spectra of the Δ+PHS reference protein and of variants with V66D and V66E were similar at pH 7.8 (Fig. 2A) and pH 10.0 (Fig. 2B). In the spectra in Figure 2A the internal Asp-66 and Glu-66 are neutral whereas in the spectra in Figure 2B they are charged. The 1H, 15N HSQC spectra of the V66K variant were compared with those of the Δ+PHS background protein at pH 6.7, where Lys-66 is neutral, (Fig. 2C) and at pH 4.7, where Lys-66 is charged (Fig. 2D).
Figure 2.
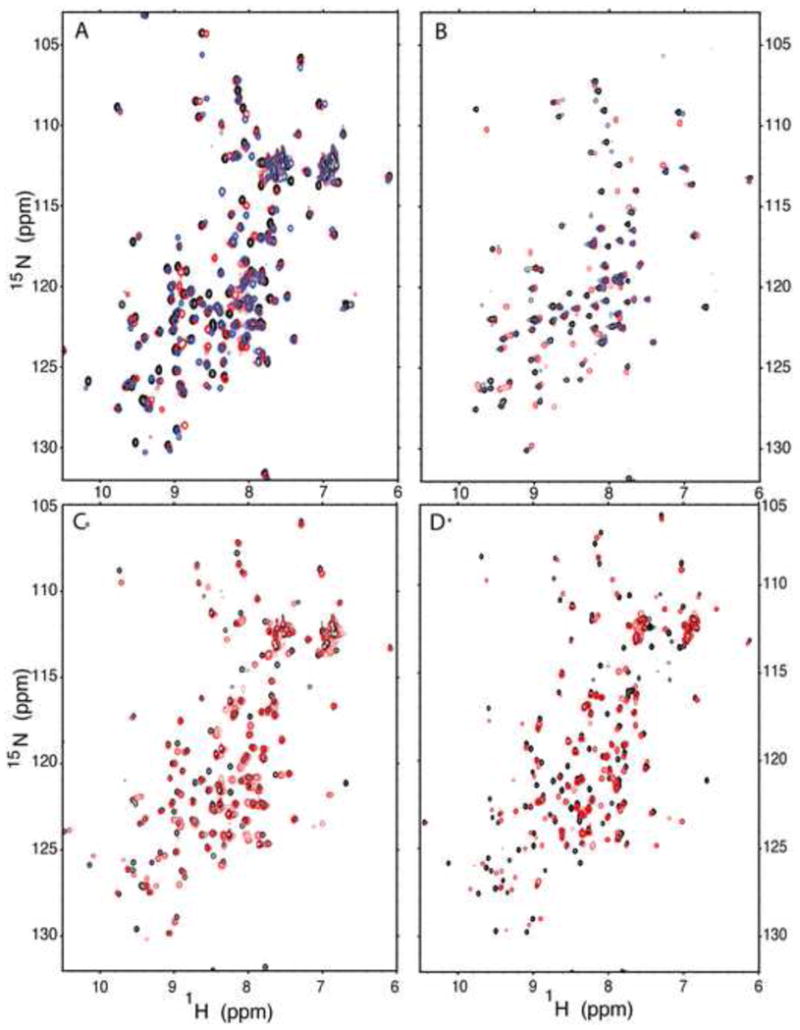
(A) Overlay of 1H, 15N HSQC spectra for Δ+PHS/V66D at pH 7.9 (red), Δ+PHS/V66E at pH 7.8 (blue), and Δ+PHS at pH 7.8 (black). (B) Overlay of 1H, 15N HSQC spectra for Δ+PHS/V66D at pH 10.1 (red), Δ+PHS/V66E at pH 9.7 (blue), and Δ+PHS at pH 10.0 (black). (C) Overlay of the 1H, 15N HSQC spectra of Δ+PHS/V66K at pH 6.7 (red) and Δ+PHS at pH 7 (black). (D) Overlay of the 1H, 15N HSQC spectra of Δ+PHS/V66K at pH 4.7 (red) and Δ+PHS at pH 4.7 (black). All spectra were acquired at 25°C and 100 mM NaCl. Contours have been set to normalize the spectra with respect to each other for ease of visualization.
Sequential backbone assignments of 13Cα, 13Cβ, 15N, and 1HN backbone resonances in the ⊗+PHS/V66K protein were obtained at pH 6.7 and 4.6 using the HNCACB48 and CBCA(CO)NH49 3D experiments at 25°C (assignments at pH 6.7 are available from the BMRB at www.bmrb.wisc.edu, accession #16123; assignments at pH 4.6 are reported in Table S1 in the supplementary information). At pH 6.7 in the ⊗+PHS/V66K variant it was possible to assign residues 12–41 and 52–145 (positions 44–49 are not present in the ⊗+PHS protein; prolines and a few severely overlapped resonances could not be assigned). At pH 4.6, it was possible to assign residues 2–40, 43, 51–61, and 71–149. In general, resonances were better resolved at pH 4.6. At this pH it was possible to assign many of the residues near the N- and C-termini. However, in the ⊗+PHS/V66K protein, residues 62–70 could not be assigned at this low pH, where Lys-66 is charged, owing to broadening of the 1HN signal below the observable threshold. This important observation is discussed ahead.
In the ⊗+PHS/V66D variant at pH 7.9 (where Asp-66 is neutral) it was possible to assign residues 7–27, 29–43, 50–62, 64, 68–69, 71–79, 82–83, 85–97, 99–112, 119–142 and 149 (the segment 44–49 correspond to the loop, which is deleted in the ⊗+PHS protein.) Assignments are listed in Table S2 of the supplementary material. Proline residues could not be assigned; many of the gaps in the assignments corresponded to loop regions (28, 80, 84, 113–118) or the N- and C- termini (1–6, 143–148), which were not observable at high pH owing to increased OH− catalyzed amide exchange. Resonances corresponding to residues near position 66 in the middle of helix-1 (63, 65, 66, and 67) were also not observed at pH 7.9 in the V66D protein. These same resonances are clearly observable in the Δ+PHS background at pH 7.9. Owing to broadening of many backbone resonances at high pH, the result of increased OH− catalyzed amide exchange, assignments for V66D were not performed at pH 10, where Asp-66 is charged.
Secondary structure identified through chemical shift analysis
Chemical shift index (CSI) analysis of the 13Cα chemical shift data was used to examine the distribution of secondary structure in variants with V66K and V66D substitutions. The analysis takes advantage of the strong correlation between the 13Cα chemical shift and backbone conformation (i.e., α-helix or β-sheet)50,51. The 13Cα CSI analysis was performed on the chemical shift data from Δ+PHS at pH 6.7 (Fig. 3A), Δ+PHS/V66K at both pH 6.7 (Fig. 3B) and 4.6 (data not shown), and Δ+PHS/V66D at pH 7.9 (Fig. 3C). The secondary structure identified in the Δ+PHS reference protein and in variants with V66K and V66D substitutions was comparable.
Figure 3.
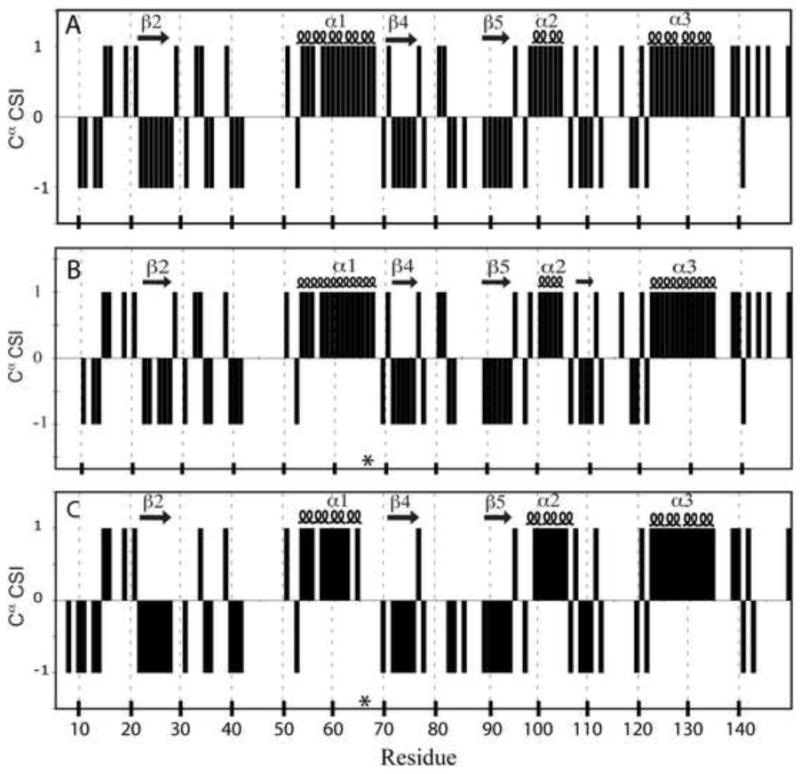
Chemical shift index (CSI) of 13Cα plotted by residue at for (A) Δ+PHS at pH 6.7, (B) Δ+PHS/V66K at pH 6.7, and (C) Δ+PHS/V66D at pH 7.9. Secondary structure elements identified by the analysis are shown above each plot. The asterisk indicates the site of the substitution.
The ⊗+PHS/V66K protein at pH 6.7 has β-sheet at positions 22–27, 39–41, 71–75, 88–94, and 108–110, and α-helix at 53–68, 98–105, and 122–135. At pH 4.6, β-sheet was found at 22–27, 39–43, 71–75, 88–94, and 108–110, and α-helix at 53–61, 98–105, and 122–135. Results for V66D at pH 7.9 were similar. β-strands 1 and 3 (shown in Fig. 1A at residues 10–17 and 30–36) were not identified by the CSI algorithm in either the ⊗+PHS reference protein or in the V66K or V66D variants thereof. The insensitivity of the analysis to β-sheet at these regions is likely due to the use of a single type of chemical shift, which limits identification rate to 80–85%51.
To extend the CSI predictions, the chemical shift data (13Cα, 13Cβ, 1HN, and 15N) were also analyzed with the TALOS (Torsion Angle Likelihood Obtained from Shift and Sequence Similarity) program52. In the ⊗+PHS reference protein at pH 7, TALOS analysis identified the secondary structure that is observed in crystal structures, including the presence of β-strands 1 and 3 in segments 10–17 and 30–36, respectively. The distribution of secondary structure predicted with TALOS in the ⊗+PHS/V66K protein was normal and consistent with the CSI results at both pH 6.7 and 4.6 (including the loss of signal at positions 62–70 at low pH, where Lys-66 is charged). In this protein, β-strand 1 was predicted to extend from 9–14 at pH 6.7 and from 9–17 at pH 4.7. β-strand 3 was predicted from 32–37 at both values of pH. Similarly, the distribution of secondary structure identified by TALOS analysis of ⊗+PHS/V66D at pH 7.9 was normal and identical to ⊗+PHS at pH 6.7. All elements of secondary structure detected by CSI and TALOS were comparable to the secondary structure observed in the crystal structures of ⊗+PHS46 and of ⊗+PHS/V66D and ⊗+PHS/V66K under conditions of pH where Asp-66 and Lys-66 are neutral10,11,24. The data show that the secondary structure of ⊗+PHS is not affected by substitution of Val-66 with Asp or with Lys.
Differences in 13Cα chemical (ΔΔδ(13Cα)) in the Δ+PHS/V66K protein between pH 6.7, where Lys-66 is neutral, and pH 4.6, where it is charged, were calculated as follows (Fig. 4A):
| (1) |
Figure 4.
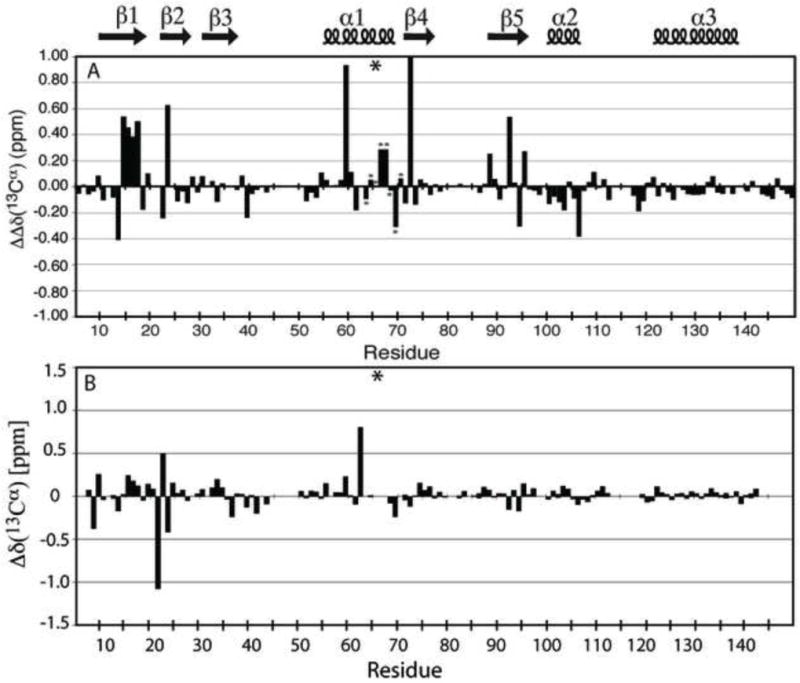
(A) ΔΔδ(13Cα) (ppm) chemical shift difference between Δ+PHS/V66K at pH 6.7 and pH 4.6. The asterisks within the plot identify chemical shift data at 32°C. The asterisk above the plot indicates the site of the V66K substitution. (B) Δδ(13Cα) (ppm) chemical shift difference between Δ+PHS/V66D at pH 6.7 and Δ+PHS at pH 6.8 plotted by residue. The asterisk indicates the site of the V66D substitution.
Several resonances, including 13–17, 59, 72, and 92, exhibited large shifts. The significance of these data are discussed ahead.
The Δδ(13Cα) chemical shift differences between Δ+PHS/V66D at pH 7.9, where Asp-66 is mostly neutral, and Δ+PHS at pH 6.8 (the pH at which 13Cα data were available) are shown in Figure 4B (the structure of Δ+PHS itself does not change significantly between pH 6.7 and 7.946). Figure 4B shows that at the vast majority of backbone positions there were only small differences in 13Cα chemical shift (Δδ < ± 0.5 ppm). Apparently, the structure of the Δ+PHS/V66D variant is unperturbed by the substitution of Val-66 with neutral Asp. Resonances for Asp-21 and Thr-22 showed slightly larger deviations in 13Cα chemical shifts. Asp-21 was found in previous work to have an unusually elevated pKa of 6.5 in Δ+PHS46. The Δδ(13Cα) values at positions 21 and 22 probably reflect differences in the charge state of Asp-21 between pH 6.8 and pH 7.9 in the Δ+PHS background. There was a large shift of 0.8 ppm at Thr-62, which likely represents an interaction with the Asp-66 side chain, as observed in crystal structures of variants with Asp-66 and Asn-6624. It should be noted that Δδ(13Cα) values could not be calculated for residues 63 and 65–67 because they are not observed at pH 7.9 in the variant with V66D.
pH titration of variants with Asp-66, Glu-66, and Lys-66 followed by 1H, 15N HSQC
To characterize structural changes in the Δ+PHS/V66D protein that are coupled to the ionization of Asp-66, 1H, 15N HSQC spectra were obtained at pH 7.9, 8.4, 9.0, 9.3, and 10.1, which bracket the pKa of 8.9 of Asp-66. Similarly, 1H, 15N HSQC spectra were acquired for the Δ+PHS/V66E protein at pH 7.8 to 9.7, which bracket the pKa of 8.8 for Glu-66. The data for the Δ+PHS/V66E protein were not analyzed quantitatively owing to severe line broadening and loss of signal at a majority of cross peaks in the spectra at high pH. This is likely due to the decreased stability of the V66E variant at high pH, where amide solvent exchange is enhanced.
Chemical shift differences between the Δ+PHS/V66D and Δ+PHS/V66K variant (var) proteins and the reference Δ+PHS protein, between high pH and low pH, were calculated as follows:
| (1) |
The experimental error of the ΔΔδ(1HN) measurement was ±0.04 ppm. Figure 5A shows the ΔΔδ(1HN) plotted by residue number for the protein with V66D. Most amides exhibited differences less than 0.05 ppm. Many resonances could not be followed all the way up to pH 10 in either the variant or the Δ+PHS reference protein owing to solvent exchange of the amide groups. Of those resonances that could be followed to the endpoint of the titration, there were several with ΔΔδ(1HN) values > 0.1 ppm. Those with the largest changes localized to the β-barrel, particularly in β-1 (resonances 13 and 16), β-2 (22), β-3 (34), and β-5 (89 and 92). Additionally, resonances 60–62 and 64–68 were found to become line broadened in both the 1H and 15N dimensions, resulting in a reduction of peak intensity below the detectable threshold at high pH in V66D but not in Δ+PHS (63 exchanged at high pH in both proteins). This group of residues in helix-1 are the same that enter intermediate exchange in the Δ+PHS/V66K variant under conditions of pH where Lys-66 becomes ionized (discussed ahead). Figure 5B shows the structural distribution of changes in chemical shift coupled to the ionization of Asp-66.
Figure 5.
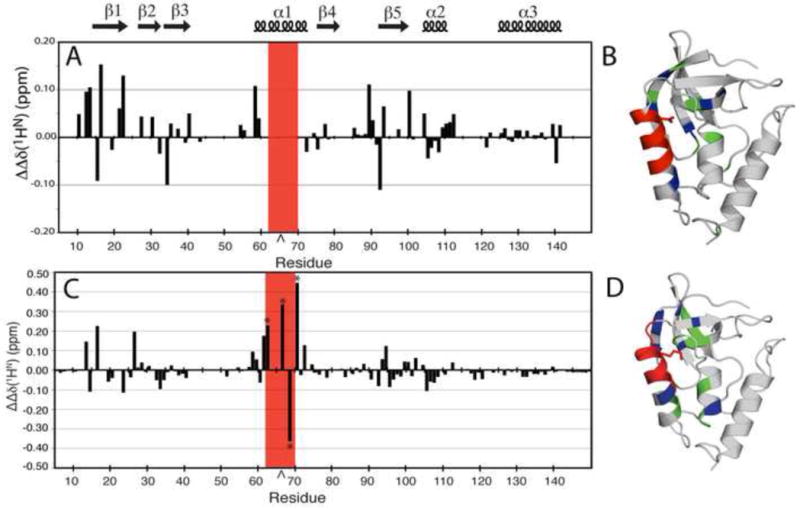
(A) ΔΔδ(1HN) plotted by residue for Δ+PHS/V66D at pH 7.9 and 9.9. This represents the difference in changes in the 1H, 15N HSQC spectrum of the reference protein, Δ+PHS, at pH 7.9 and 9.9, and the Δ+PHS/V66D variant. The caret indicates the site of the substitution. The red box indicates resonances that were broadened in the mutant but not in the background by increasing pH. (B) Structural distribution of the largest ΔΔδ(1HN) (≥ 0.1 ppm) (blue) and moderate ΔΔδ(1HN) (≥ 0.05 and < 0.1 ppm) (green). Exchange broadened resonances (red) in the Δ+PHS/V66D structure. (C) ΔΔδ(1HN) plotted by residue for Δ+PHS/V66K at pH 6.7 and 4.6. This represents the difference in changes in the 1H, 15N HSQC spectrum of the background protein, Δ+PHS and its V66K variant, between the two pH values. The asterisks identify resonances recorded at 32°C. The caret indicates the site of the substitution. (D) Structural distribution of the largest ΔΔδ(1HN) (≥ 0.1 ppm) (blue), and moderate ΔΔδ(1HN) (≥ 0.05 ppm and < 0.1 ppm) (green) in the Δ+PHS/V66K structure. Upon ionization of Lys-66, positions 62–70 exhibit extreme line-broadening (red). Within this broadened subset, very large ⊗⊗δ(1HN) values (> ±0.2 ppm) were measured at positions 62, 66, 68, and 70.
To characterize the effects of the ionization of Lys-66 on the structure of the ⊗+PHS/V66K variant, 1H, 15N HSQC spectra were similarly collected at five pH values (6.7, 6.3, 5.7, 5.3, 4.6), which bracket the pKa of 5.7 of Lys-66. As had been observed previously in the 3D experiments, the resonances of residues 62–70 were well resolved at pH 6.7, but broadened below the observable threshold by the midpoint of the pH titration of Lys-66. The 1H, 15N HSQC spectra were also collected at 32°C. This allowed identification of amides for residues 62, 66, 68, and 70 all the way down to pH 4.6, where Lys-66 is charged. The 1H, 15N HSQC spectra of ⊗+PHS/V66K at 25°C and 32°C overlaid well at both pH 6.7 and pH 4.6, with only minor temperature-induced shifts. Peak assignments were transferable by visual inspection after an overall reference shift was applied to correct for the shift induced by higher temperature (see Methods).
The amide proton chemical shift changes (ΔΔδ(1HN)) in ⊗+PHS/V66K between high and low pH, including those measured at 32°C, are plotted by residue number in Figure 5C. Very large ΔΔδ, some greater than ± 0.3 ppm, were detected when Lys-66 titrated. The largest ΔΔδ(1HN) belong to a subset of positions, distributed throughout several elements of secondary structure, but localized to regions near the side chain of Lys-66. The structural distribution of the chemical shift changes (ΔΔδ(1HN)) is shown in Figure 5D. The largest ΔΔδ(1HN) values (> ±0.2) are found within the subset of exchange-broadened residues at positions 62, 66, 68, and 70. The N-terminal end of helix-1, at residues 58–61, also shows large changes. In addition, residues in each of the five strands comprising the β-barrel exhibit large (> ±0.1 ppm) or moderate (±0.05 to 0.1 ppm) ΔΔδ(1HN) values. Positions 13, 14, 16 (β1); 23, 26 (β2); 32–34 (β3); 72 (β4); and 92–94 (β5) were identified as having large or moderate ΔΔδ(1HN) values.
2D CBCA(CO)NH of Δ+PHS/V66D and Δ+PHS/V66K
Because assignments of the variant with V66D at high pH were not feasible, a titration was carried out with two dimensional CBCA(CO)NH experiments to verify that global structural changes do not occur upon ionization of Asp-6646. The two dimensional version of this standard NMR experiment correlates the 1HN chemical shift of the ith residue in the backbone with the corresponding 13Cα and 13Cβ chemical shifts of the i-1 residue. The peaks are not separated in 15N, as in the 3D experiment. The spectra were obtained at pH 7.9, 8.4, and 8.9 (see Fig. S1 of the supplementary info). Some peaks were lost at high pH owing to line-broadening, as was the case in the 1H, 15N HSQC spectra at high pH. Of the ~65 peaks that remained well resolved (corresponding to those peaks visible in the 1H, 15N HSQC titration at pH 8.9), there were no significant changes in 13Cα or 13Cβ chemical shifts during titration with pH, further supporting the idea from previous studies of the V66D variant24 that the overall structure of the protein remains largely intact, native-like and comparable before and after the ionization of Asp-66.
To examine the variant with the V66K substitution further, a 2D 1H, 13C plane of the CBCA(CO)NH experiment was performed at 32°C to attempt to observe the exchange-broadened region of 62–70. Resonances corresponding to positions 62–64 and 66–70 in the 32°C spectrum could be assigned at pH 6.7. The 13Cα chemical shifts were monitored as a function of pH for these residues. Because the resonances in the region of 62–70 were either completely broadened or severely overlapped at pH values below 5.7, the ΔΔδ(13Cα) values were only measured between pH 6.7 and pH 5.6. Only residues 66, 67, and 69 showed significant shifts (> ±0.1 ppm) of 0.29, 0.29, and −0.31 ppm (±0.04 ppm), respectively. It was not possible to follow Thr-62 to the midpoint of the titration owing to loss of intensity at this resonance. These results are included in Figure 3A and indicated by an asterisk.
Unusual chemical shift of a neutral Asp in a hydrophobic environment
A 2D 1H, 13C carbon-detected pulse sequence (CBCGCO) has been used previously to measure pKa values of surface Asp and Glu residues in the Δ+PHS SNase46. This experiment was performed with the V66D variant in an attempt to observe directly the 13Cβ, 13Cγ resonance of the Asp-66 side chain to measure its pKa. Initially, two spectra were acquired at 25 °C and pH values of 7.0 and 9.7. These values were chosen to observe the Asp-66 resonance when the side chain was neutral (pH 7.0) and charged (pH 9.7). At both pH 7.0 and 9.7 the Asp and Glu resonances that were observed corresponded to resonances from surface Asp and Glu residues in the Δ+PHS spectrum assigned previously. No new peaks were observed. The experiment was repeated at pH 6.5 and pH 5.0. At pH 6.5, no new peaks were observed but at pH 5.0, almost four pH units below the pKa of Asp-66, a peak was observed that remained unaccounted for after assigning known peaks from Δ+PHS (Fig. 6). The peak was in an extremely unusual position. It exhibited an upfield chemical shift in 13Cγ, at ~170 ppm. For comparison, a typical solvent-exposed and charged Asp Cγ will have a chemical shift between 178–182 ppm. The chemical shift of the 13Cβ nucleus was similarly atypical, at ~38.5 ppm, whereas most Asp resonances are usually found between 39.5 and 43.5 ppm (the sole exception is Asp-21 13Cβ at ~38.5 ppm, which suggests that the active site Asp-21 may experience a hydrophobic microenvironment, though not to the same degree as Asp-66). The new resonance corresponds to Asp-66. Although it was impossible to use this signal to measure the pKa of Asp-66 as intended, we can report the observation of this new resonance corresponding to a carboxyl carbon in the neutral state and in a hydrophobic environment. The unusual spectral position of this resonance might allow its use as an indicator of the polarity of microenviornments of internal Asp and Glu residues.
Figure 6.
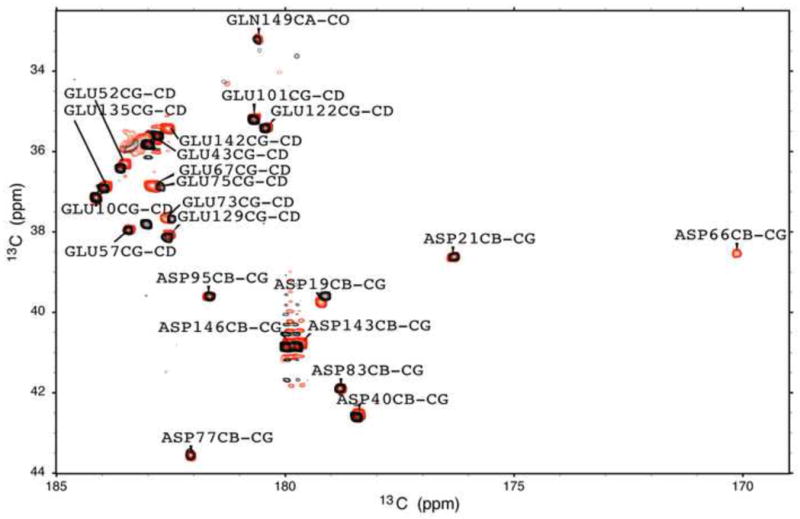
The two-dimensional [13C] CβCγ(CO) spectra of Δ+PHS (black) and Δ+PHS/V66D (red) at pH 5.0. Labels indicate peaks in the V66D spectrum.
Hydrogen exchange
Hydrogen exchange studies were performed to examine changes in structural fluctuations coupled to the presence and ionization of internal groups53–55. The variant with Lys-66 was selected for these studies because it titrates in the acidic range of pH, where problems related to base-catalyzed amide exchange are avoided. The thermodynamic stability of the ⊗+PHS and ⊗+PHS/V66K proteins are quite different (ΔG°H2O of ⊗+PHS at pH 7.5 is ~12 kcal/mol and for ⊗+PHS/V66K it is ~4.9 kcal/mol)9,11,24. Furthermore, the stability of the V66K variant is highly pH dependent whereas the stability of the ⊗+PHS reference protein is not. This precludes meaningful comparison of H/D exchange rates in these proteins. For this reason, only a qualitative comparison was performed to examine the effects of Lys-66 on structural fluctuations detectable through hydrogen exchange. The goal was simply to determine if the presence or ionization of Lys-66 changed the patterns of exchange. Experiments were performed with ⊗+PHS/V66K and with the ⊗+PHS background protein at pH* 6.9 and pH* 4.7, which brackets the pKa of Lys-66. Time points of 0, 24, and 72 hrs were obtained. The dead time of the experiment was approximately 1 hr.
A comparison of the completely exchanged residues in ⊗+PHS/V66K and ⊗+PHS at pH* 6.9 and time 0 showed significant differences in the behavior of helix-1 and β sheets-1, 2, and 3 (Fig. 7). Resonances 63–67 in the C-terminal end of helix-1 and residues 12, 13, 16, 22, 23, 24, 26, 34, 36, 88, and 89 in β-sheets 1, 2, 3, and 5 showed 100% loss of intensity in the ⊗+PHS/V66K spectrum within the dead time of the experiment (~1 hr). In contrast, resonances 63–67 were well resolved at time zero in ⊗+PHS with S/N ratios > 300. S/N ratios for resonances 12, 13, 16, 22, 23, 24, 26, 34, 36, and 89 were > 175 in the ⊗+PHS spectrum. Resonances corresponding to helix-2 and 3, β strand-4 and the C-terminal portion of β strand-5 showed normal intensities at time zero in both spectra. At 72 hrs, the intensity of the vast majority of resonances in the spectrum of the ⊗+PHS/V66K protein was reduced by more than 90%. In contrast, the spectrum of the ⊗+PHS protein at 72 hrs retained many peaks with intensities reduced by less than 25%, especially in helices, strands, and in the hydrophobic core. Results for ⊗+PHS/V66K at pH* 4.7 (where Lys-66 is charged) and time zero were qualitatively very similar to those described at pH* 6.9, with resonances 62–67 completely exchanged within the dead time of the experiment.
Figure 7.
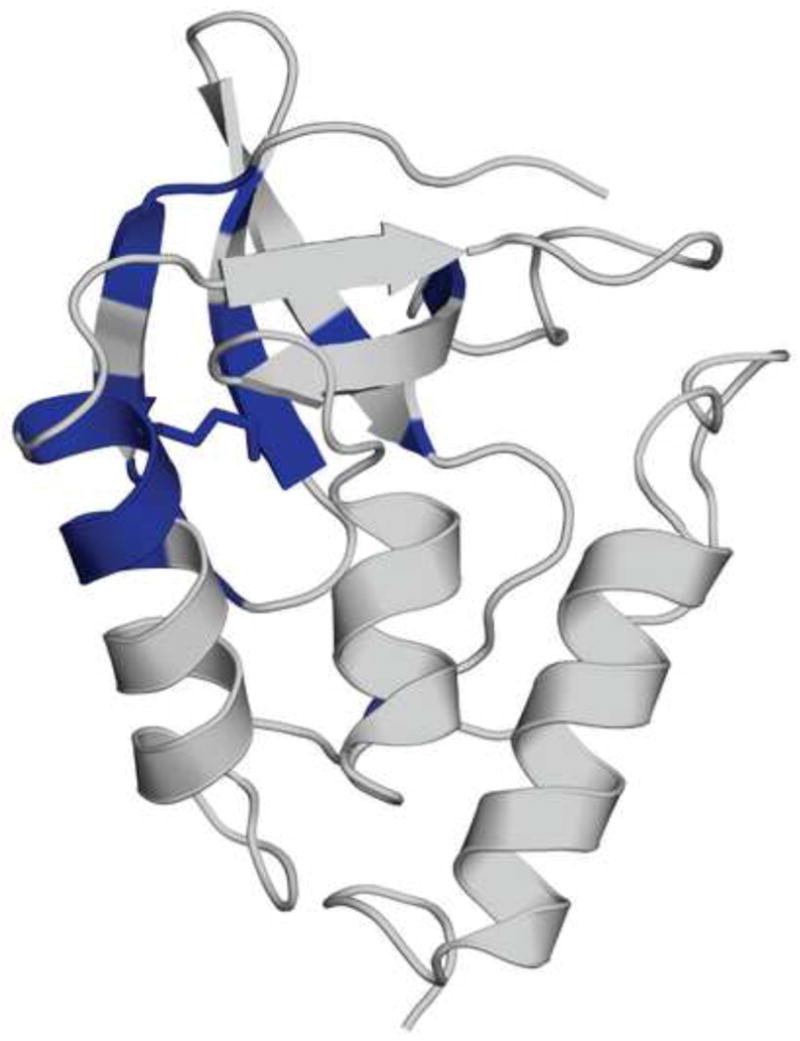
Summary of hydrogen exchange studies. Structural distribution of residues that are fully exchanged (blue) in ⊗+PHS/V66K at pH* 6.9 and time zero, but are not fully exchanged in ⊗+PHS under the same conditions.
Discussion
The substitution of the internal Val-66 in SNase with Lys, Asp or Glu is destabilizing9–11,24,25. The crystal structures of variants with V66K, V66D and V66E substitutions show that the introduction of these ionizable side chains has no measurable effect on the conformation of the protein when the side chains are neutral9,24,25. In fact, the crystal structures do not reveal anything obvious about structural origins of the high apparent dielectric constant reported by these internal ionizable groups. Consistent with the crystal structures, the 1H, 15N HSQC spectra of the variants with V66D, V66E, and V66K under conditions of pH where the ionizable groups are neutral (Fig. 2A and C) show that these proteins are folded and comparable to the reference protein. The 1H, 15N HSQC spectrum of the V66D protein when Asp-66 was neutral had cross peaks that overlapped with 75% of the corresponding assigned peaks in the spectrum of Δ+PHS. Similarly, more than 70% of the resonances of the Δ+PHS protein were present in the Δ+PHS/V66K protein when Lys-66 was neutral. The normal appearance of the HSQC spectra, the similarity with the spectrum of the reference protein, and the normal distribution of secondary structure predicted with TALOS analysis indicate that SNase tolerates the substitution of the core Val-66 with ionizable groups of differing length, volume, and polarity, without detectable changes in structure.
The CBCG(CO) experiment that was performed in an attempt to measure the pKa of Asp-66 directly did not achieve its intended goal. However, when this experiment was applied to Δ+PHS/V66D at pH 5.0 it led to the discovery of a new carbon resonance with a highly unusual chemical shift in the carbon spectrum. This resonance was observed only at pH 5.0 (Fig. 6); it was not observed at pH 6.5, 7.0, or 9.7. All other peaks in the pH 5.0 spectrum of the Δ+PHS/V66D protein could be assigned unambiguously through visual inspection to previously assigned resonances in the spectrum of Δ+PHS46. The additional resonance likely belongs to the carboxyl carbon of Asp-66. The most interesting feature of this resonance was the large upfield shift in Cγ = 170.1 ppm and in Cβ = 38.5 ppm. The putative Asp-66 resonance is not the only one observed at this unusual Cβ position. The resonance for Asp-21 is also in this region but has a more normal downfield shift in Cγ (Cγ=176.3 ppm, Cβ=38.6 ppm). As discussed previously, Asp-21 titrates with a pKa of 6.5 in the Δ+PHS reference protein46. At pH 5 both Asp-21 and Asp-66 are neutral. The resonances from both groups have the same Cβ chemical shift at pH 5.0 and were the only resonances with such shifts. All other Asp residues in the protein are charged at this pH and were found at Cβ chemical shifts > 39.5 ppm. The highly unusual upfield shift for the Cγ resonance of Asp-66 appears to be characteristic of a nucleus in a highly hydrophobic environment. A similar observation was made for Lys-66 in the neutral state56. This is fully consistent with the observation in the crystal structure of the Δ+PHS/V66D variant showing that when Asp-66 is neutral its side chain is buried completely in the hydrophobic core of the protein24.
When the Δ+PHS/V66D variant was titrated from acid to basic pH, the Asp-66 cross peak disappeared from the spectrum at pH 6.5, which is almost 2.5 pH units below its pKa. This effect is probably related to the ionization of the nearby Asp-21, which titrates with a pKa of 6.546. This suggests that as the global thermodynamic stability of the Δ+PHS/V66D protein decreases with increasing pH, a dynamic process sets in near pH 6 that governs the response of the protein, or of this region of the protein, to the ionization of Asp-66. What is significant about this result is that the V66D substitution appears to promote increased backbone fluctuations, even when Asp-66 is neutral. It is not clear whether these increased backbone fluctuations are due to ionization of Asp-21 or to the loss of stability related to the shift in the pKa of Asp-66. At pH 9.7, resonances corresponding to Asp-95 and Glu-67 in the Δ+PHS/V66D protein disappear; this was not observed for those residues in the Δ+PHS background. These residues are probably also affected by the dynamic process promoted by the ionization of Asp-66.
The most important finding of this study concerns the elucidation of the structural basis of the high apparent dielectric constants reported by the internal Lys-66, Asp-66 and Glu-66 in SNase. The pKa values of these residues are shifted significantly relative to the normal pKa of the ionizable groups in water9,11,24. This suggests that the protein cannot compensate fully for the loss of hydration experienced by the ionizable moieties when they are buried in the hydrophobic core. In structure-based calculations with a variety of electrostatics methods the experimental pKa values of these groups are only reproduced when the protein was treated arbitrarily with high dielectric constants9,11,25,38. Because all other possible contributions (e.g. interactions with permanent dipoles and with other charges, with internal water molecules, with the reaction field in bulk water, etc) are taken into consideration explicitly in the calculations, conformational reorganization coupled to the ionization event was the most likely origin of the high dielectric response.
Very modest structural reorganization was evident in the pH titrations of the ⊗+PHS/V66D24 and ⊗+PHS/V66K9 proteins monitored by far-UV CD spectroscopy. The changes were consistent with the loss of ~ 1.5 turns of helix. Recent studies of the effects of pH on the crystal structure of ⊗+PHS/V66K showed that the side chain of Lys-66 becomes increasingly disordered when Lys-66 becomes charged at low pH33. Furthermore, under these conditions the C-terminal end of helix-1 and β-1 have unusually high temperature factors relative to other regions in the structure. The fact that the ⊗+PHS/V66K protein is enzymatically active at both pH 7 and 5.547 suggests that the protein can achieve a folded and native-like state under conditions of pH where the internal Lys-66 is charged.
The present NMR studies have clarified things significantly. In the basic limit of the pH titration of Δ+PHS/V66D and Δ+PHS, many resonances in turns and loops are exchanged broadened. A subset of residues at positions 63, 65, 66, and 67 are also broadened at pH 7.9 in Δ+PHS/V66D, but are detectable in Δ+PHS. These residues flank position 66 and are located near the C-terminal end of helix-1 (which spans 54–68). The introduction of Asp-66 appears to have promoted increased local fluctuations, even at pH 7.9, where this group is mostly neutral. In the case of the Δ+PHS/V66K protein the loss of amide peaks for the segment 62 to 70 in the 1H, 15N HSQC spectra coincides perfectly with the titration of Lys-66. By extending the titration of Δ+PHS/V66D to pH 10.0, residues 60–68 were found to be in intermediate exchange, similar to what was observed for the completely ionized Lys-66 in Δ+PHS/V66K.
The effects of pH on chemical shift, as described in the ΔΔδ(1HN)pH values, were on the order of ~0.1 ppm for the variant with V66D. These relatively minor amide proton shifts were distributed throughout the β-barrel into which Asp-66 is packed. The ΔΔδ(1HN) values did not suggest any significant global conformational change upon ionization of Asp-66, consistent with previous data24. It was clear from the 1H, 15N HSQC spectrum at pH 10 that Δ+PHS/V66D remained mostly folded after the titration of Asp-66. It is difficult to ascertain whether the observed intermediate exchange behavior at residues 60–68 results from increased backbone fluctuations or from the rapidly fluctuating charge on the Asp-66 side chain. Five observations support the notion that the broadening of cross peaks in the segment 60 to 68 in these proteins is the result of increased fluctuations of the backbone. First, the loss of these cross peaks occurred at a pH where the side chain of Asp-66 was mostly neutral, so broadening need not be caused by the electrostatic field of a fluctuating internal charge. Second, the hydrogen exchange data on Δ+PHS/V66K showed a loss of protection at amides 62–70 at a pH where Lys-66 was also mostly neutral. Third, the broadening is observed mostly in helix-1 (red segments in Figs. 5B and 5D). If it were due to a fluctuating electrostatic field, this effect might have been observed also in the β-barrel against which Lys-66 or Asp-66 pack. Fourth, it is unlikely that both a negative and a positive electrostatic field would have exactly the same broadening effect on the HSQC spectra. Finally, we note that the pH titration of Δ+PHS/V66E in the 1H, 15N HSQC experiment was similar to that of V66D; increased dynamics manifested as line-broadening and loss of cross peak intensity from the spectrum when Glu-66 became ionized. Additionally, the V66E protein showed an increasing tendency to precipitate out of solution at pH ≥ 8 in concentrations suitable for NMR spectroscopy experiments. This suggests a conformational change that has exposed hydrophobic regions of the protein.
The NMR spectroscopy data are fully consistent with a structural response to the ionization of the internal Lys-66 in which the majority of the protein remains intact. The modest response to the ionization event is localized to the immediate vicinity of Lys-66. For example, the majority of the amide peaks in the 1H, 15N HSQC spectrum of ⊗+PHS/V66K remained well resolved and in fast exchange throughout the titration. Peaks corresponding to residues 62–70, however, were of special interest owing to their intermediate exchange behavior at the mid-point of the pH titration of Lys-66. The onset of intermediate exchange at these positions suggested that increased fluctuations drive exposure of the charged Lys-66 side chain to water. The smallest value of ΔΔδ(1HN) for residues in the range of 62–70 was ~0.22 ppm, suggesting an upper limit on the dynamics on the order of 10−2 seconds. At 32°C, amide peaks corresponding to residues 62, 66, 68, and 70 in the 1H, 15N HSQC spectra could be observed through the titration of Lys-66. These residues exhibited the largest ΔΔδ(1HN) values, on the order of ± 0.2–0.4 ppm. Three of these shifts were in the upfield direction, suggesting a potential weakening of hydrogen bonding at these positions as Lys-66 becomes ionized. The large magnitude of the ΔΔδ(1HN) values in the region of 62–70 may reflect the effects of a structural change in this region, but again, they could also originate from a fluctuating electrostatic field from fluctuations from the charged side chain of Lys-66. Contributions from both types of effects are possible although, as discussed for Asp-66, the local changes to the backbone are more likely. The peaks for 62–70 did not recover any intensity at the low pH endpoint, indicating that whatever processes (increased fluctuations or a dynamic process driving exposure of Lys-66 to water) cause line-broadening of residues around position 66 are not abated when Lys-66 is fully charged.
In addition to effects within helix-1, the data suggest that the relaxation process triggered by the ionization of Lys-66 also affects the local chemical environment of the β-barrel where Lys-66 is buried. Concomitant with the changes in the 1H, 15N HSQC spectrum at 62–70, amide resonances corresponding to residues 13, 14, 16, 23, 26, 33, and 34 located in strands 1, 2, and 3 of the β-barrel also exhibited large ΔΔδ(1HN), on the order of ± 0.1–0.2 ppm. They also showed intermediate exchange behavior at the mid-point of the titration of Lys-66 (though not as severe as resonances 62–70). Thus, it appears that β-1, β-2, and β-3 are also affected mildly by the ionization of Lys-66. Val-23 contacts the buried Lys-66 side chain and is located directly opposite the ionizable group. Val-23 and Phe-34 share a backbone hydrogen bond across strands 2 and 3 of the β-barrel; Thr-13 and Met-26 share a backbone hydrogen bond across strands 1 and 2. Interestingly, by the endpoint of the titration, residues 23, 26, and 34 recover most of their original linewidth and/or intensity present at the start of the titration, suggesting that the hydrophobic core of the β-barrel experiences less intermediate timescale fluctuations once Lys-66 is fully charged.
The ΔΔδ(13Cα) values are fully consistent with what is reported by the amides; however, they convey different information. As described above, changes in 13Cα chemical shifts can be interpreted in terms of perturbations to backbone dihedral angles. Residues 13–17, 23, 59, 72, 88, 92, and 94 show the largest ΔΔδ(13Cα). This suggests that these positions experience some structural perturbations when Lys-66 is charged. In particular, residues 14 to 17 exhibit values of similar magnitude and sign, suggesting a concerted transition in the backbone structure at β-1. Val-23 has a ΔΔδ(13Cα) ~0.6 ppm; the Val side chain contacts Lys-66 in the hydrophobic core and may be repacking upon ionization and reorganization of Lys-66. Residues 59 and 72 flank the region that shows intermediate exchange in the NH chemical shifts. These two positions also show the largest ΔΔδ(13Cα), suggesting that the backbone is perturbed at these positions. This could take the form of a small hinging motion, allowing Lys-66 room to access bulk water. Finally, residues 88, 92, 94, and 95 are located in β4 and β5. They also appear to undergo a small rearrangement. A backbone perturbation at these residues is consistent with the results from the HSQC data.
Within the region of residues 62–70, the measurement of ΔΔδ(13Cα) values was only possible between the beginning of the titration of Lys-66 (pH 6.7) and the midpoint (pH 5.6). Thus, these values may only reflect half of their true magnitude, but they provide some measure of the changes occurring in this region upon ionization of Lys-66. It can be seen that residues 66, 67, and 69 all show ΔΔδ(13Cα) values on the order of ± 0.3 ppm. By the endpoint of the titration these shifts could be as large as ± 0.6 ppm. That would put them in the same range as the changes taking place elsewhere in the protein, suggesting a subtle rearrangement of the backbone at this location. The ΔΔδ(13Cα) values for 63, 64, 68, and 70 are all negligibly small, suggesting that helix-1 does not adopt an unstructured configuration between residues 62 and 70 when Lys-66 is charged. This region probably retains most of its helical structure during the ionization of Lys-66, perhaps with a minor perturbation localized at residues 66 and 67.
The results of the NMR spectroscopy experiments suggest that the ionization of the internal Lys-66, Asp-66, and Glu-66 in SNase promotes local changes to the backbone. Overall, this is consistent with what has been observed in extensive MD studies of ⊗+PHS/V66K with standard and self-guided Langevin MD simulations34. It is also consistent with studies of the V66D and V66E variants with free energy perturbation (FEP) methods with QM/MM methods38 and studies of ⊗+PHS/V66E using FEP methods with an overcharging protocol37. Although the results from the computational studies disagree on the specific nature and extent of the relaxation process necessary to explain the ionization energetics of Asp-66, Glu-66, and Lys-66, all the simulations concluded that a localized structural transition, in some cases coupled with water penetration, is necessary to explain the properties of these internal groups.
Molecular dynamics simulations analyzed with Fröhlich-Kirkwood theory of dielectrics have been used previously to calculate dielectric properties of many proteins57– 60. These calculations predicted protein dielectric constants as high as 40. These high protein dielectric constants were shown to originate, in all cases, from the large, uncorrelated, anisotropic motions of the charged side chains, which in the case of the proteins studied, are all on the surface. When contributions from these charged side chains are excluded from the calculations, the calculated protein dielectric constants were low, in the range 2 to 5, implying that fluctuations in the backbone do not contribute significantly to the high protein dielectric constant. These results are not in agreement with our experimental observations. Although we cannot monitor directly the contributions from fluctuations of surface charges to the high dielectric effect reported by the ionization of Lys-66, Asp-66, and Glu-66, the experimental results are consistent with increased fluctuations or conformational rearrangements of the backbone being the major determinant of the high protein dielectric constant. In the calculations it was the side chains not the backbone that were responsible for the high dielectric constants of proteins whereas in the experiments it was fluctuations of the backbone not of side chains that were responsible for the high apparent dielectric effect. This discrepancy will likely be resolved as improved molecular dynamics simulations become available that allow sampling of conformational reorganization of the backbone in response to the ionization of an internal group.
Conclusions
This study contributes the first detailed description of mechanisms of dielectric relaxation that can govern the pKa values of internal ionizable groups in proteins. In the V66K, V66D, and V66E variants of the ⊗+PHS form of SNase, the ionizable side chains or Lys-66, Asp-66, or Glu-66 cannot be solvated properly when they are buried in internal, hydrophobic locations. Interaction with surface charges, with permanent dipoles, with induced dipoles with the reaction field of bulk solvent, and with internal water molecules appear not to be sufficient to neutralize the charged groups in their buried location. The NMR studies show irrefutably that the ionization of the internal groups promotes an increase in local fluctuations. The extreme line-broadening and very large changes in amide proton chemical shifts observed in the region surrounding the ionizable moiety of Lys-66 or Asp-66 could be explained either in terms of fluctuating electrostatic fields emanating from the flexible, charged side chain or in terms of local fluctuations of the backbone coupled to the ionization of these groups. Both interpretations suggest increased mobility of the internal ionizable side chain or local structural reorganization (local unfolding or transient disorder) when the side chains are charged. Several lines of evidence suggest that reorganization or increased fluctuations of the backbone are the likely source of the high apparent dielectric constants reported by these internal ionizable groups in SNase. Increased fluctuations could minimize the energetically unfavorable consequences of dehydration of the buried charged ionizable groups, perhaps by enhancing their exposure to bulk water. Remarkably, the ionization of Lys-66 and Asp-66 did not lead to large structural changes throughout the protein; almost all changes are localized to the immediate vicinity of the side chain at position 66. Changes occur locally, predominantly in helix-1 where position 66 is found, and in β-1 and β-2, which are in contact with the side chain at position 66. Under conditions of pH where Lys-66 and Asp-66 are charged, the conformation of helix-1 and β1 in the protein may be slightly perturbed. Small perturbations would allow the charged moiety of the side chain to become hydrated or to make contact with nearby polar moieties (the hydroxyl of Thr-62, for example). The ionization of Glu-66 and Lys-66 appear to be more disruptive to the β-barrel than the ionization of Asp-66. Fraying of the C-terminal end of helix-1 in the slow time scale of the equilibrium thermodynamic experiments used to measure pKa values may also play a role.
This study shows that the apparent dielectric constants needed to reproduce the experimental pKa values of Asp-66, Glu-66, and Arg-66 with continuum electrostatics methods applied to static structures are high9,11,25,38 because the dielectric constants have to reproduce implicitly the consequences of local conformational reorganization that are not treated explicitly in the calculations14. These NMR studies with variants of SNase show that conformational reorganization in response to the ionization of an internal group can be as subtle as minor, localized dynamic and structural changes. In all cases, the ionization of the internal residue probably stabilizes an equilibrium state in which the group that was buried when neutral, satisfies its requirement for hydration by exposure to bulk water or to water molecules that visit the interior of the protein transiently.
Continuum electrostatic methods based on static protein structures are not designed to reproduce the high apparent polarizibility in the protein interior that results from conformational and dynamic relaxation14. Improvements to existing continuum methods will require explicit treatment of contributions from increased dynamics and perhaps also explicit treatment of the partially unfolded states that might be populated in response to ionization of internal groups. It has been shown that when conformational reorganization is treated explicitly37,41, continuum methods can predict ionization properties of buried groups while still treating the protein with low dielectric constant to account for the effects of electronic polarizability. Unless the type of dielectric response described by these NMR spectroscopy studies is treated explicitly in pKa calculations, the energetics of ionization of internal groups will be overestimated.
Materials and Methods
Protein expression and purification
The highly stable Δ+PHS11 variant of SNase includes five substitutions (P117G, H124L, S128A, G50F and V51N) and a deletion of residues 44–49. The QuikChange kit from Stratagene (La Jolla, CA) was used to substitute Val-66 in the Δ+PHS background with Asp, Glu, and Lys9,10,24. Proteins were expressed in E. coli BL21(DE3) cells using the pET24a(+) expression vector. Cells were cultured in M9 minimal medium prepared with 15N-labeled ammonium chloride and 13C-glucose (Sigma-Aldrich, St. Louis, MO). Protein expression was induced by the addition of 1 mM IPTG to the culture medium. Protein was purified following the method of Shortle and Meeker61. The protein was determined to be greater than 98% pure by SDS-PAGE analysis. The concentration was determined using an extinction coefficient of 15,600 M−1cm−1 at 280 nm.
NMR spectroscopy
Samples for NMR analysis were prepared in buffer by exchanging uniformly 15N-labeled (or 15N/13C-labeled) protein from deionized, distilled H2O into the appropriate buffer in Centricon YM-10 or Amicon Ultra 4 filter concentrators (Millipore, Billerica, MA). Following several exchanges into buffer, samples were concentrated until a protein concentration of between 0.5 and 1.0 mM was obtained. The pH of the sample was measured on an Orion Research model 720A pH meter equipped with a 3-mm glass combination electrode (Mettler Toledo). The pH was adjusted with 1-μL aliquots of concentrated HCl and NaOH at 25°C. Phosphate buffer was used at pH values in the range of pH 6.5–8.0, and prepared as follows: 25 mM sodium phosphate, 100 mM sodium chloride in deionized, distilled H2O, with 10% D2O for field/frequency lock. Borate and acetate buffers were prepared as above and used in the range of pH from 8.0–10.2 and 4.5–6.5, respectively.
Two-dimensional (2D) 1H, 15N HSQC62,63 spectra were acquired at 25°C (actual sample temperature)64. The 1H transmitter was set to the H2O peak at 4.76 ppm and the 15N carrier was set at 118.09 ppm. A total of 4 or 8 transients/FID were acquired. Typical acquisition time in t2 (1H) was 70 ms (840 complex points, spectral width of 10 ppm) and in t1 (15N) it was 50 ms (100 complex points, spectral width of 35 ppm). The three-dimensional (3D) HNCACB48 and CBCA(CO)NH49 experiments were used for sequential backbone resonance assignments. The temperature was regulated to 25°C (actual sample temperature). The 1H transmitter was set on the H2O peak, which was referenced to 4.76 ppm during processing. The 15N carrier was set to 118 ppm, and the 13C carrier was set to the center of the aliphatic region, 43 ppm. Typical spectral widths were 10,000, 10,250, and 1950 Hz for 1H, 13C, and 15N respectively. The HNCACB experiment was acquired with 1280, 240, and 86 total data points in each of the 1H, 13C, and 15N dimensions, respectively. Eight transients were averaged per time increment. The CBCA(CO)NH experiment was acquired with 1280, 128, and 86 total data points in each of the 1H, 13C, and 15N dimensions. Eight transients were averaged per FID. 2D CBCA(CO)NH experiments were performed at 25 °C and pH values between pH 7.9 and 8.9. The 1H transmitter was set to the H2O peak, which was referenced to 4.76 ppm during processing. The 13C carrier was set at 42.7 ppm. A total of 16 transients were signal averaged over 122 complex points in t1. The 2D CBCG(CO)46,65 experiment was acquired at 25 °C and pH 5.0, 6.5, 7.0, and 10.0. Spectral widths were 8012 and 1812 Hz in 13Cγ and 13Cβ, respectively. A total of 16 transients were signal-averaged over 156 complex points in t1.
Hydrogen exchange in the ⊗+PHS and ⊗+PHS/V66K proteins was investigated at pH* 6.9 as follows: 2D 1H, 15N HSQC spectra were collected at 0, 24, and 72 hour time points after sample preparation. The dead time of the experiment was ~ 1 hr. The 15N carrier was set to 118.05 ppm. A total of 4 transients were averaged over 366 complex t1 points. Typical acquisition times in t2 were 128 ms (1280 complex points) and in t1 were 150 ms (366 complex points).
All spectra were obtained on Varian Inova 500 MHz, Varian 800 MHz (amide temperature dependence), and cryoprobe-equipped Bruker 600 MHz spectrometers, located at the Johns Hopkins Biomolecular NMR Center. Typical sample volumes were 300–500 μl and all samples were placed in Shigemi BMS-005TB solvent susceptibility-matched glass tubes (Shigemi Inc., Allison Park, PA) or Wilmad 535 precision tubes (Wilmad-Labglass, Buena, NJ). Uncertainties in chemical shifts were 0.01 ppm, 0.02 ppm, and 0.1 ppm in 1H, 13C, and 15N, respectively. Data conversion and processing was performed using the nmrPipe software suite66. Linear prediction and zero-filling were used to improve digital resolution in the indirect dimensions. Spectroscopic visualization and analysis was done using Sparky67. 15N and 13C chemical shifts were referenced indirectly with respect to DSS68. Chemical shift re-referencing before using the TALOS program was accomplished with CheckShift69. The TALOS program was used for identification of secondary structure from chemical shift information52. Molecular graphics were prepared in PyMOL70.
Supplementary Material
Acknowledgments
This work was supported by a grant to B.G.M.E. from the National Institutes of Health (GM-065197). M.S.C received additional support from the Chapman Charitable Trust. C.A.C. was supported by a Burroughs-Wellcome Fellowship. The authors wish to thank Dr. Juliette Lecomte for helpful discussion, and Dr Rossitza Gitti for having measured preliminary spectra of the Δ+PHS/V66K variant. All NMR experiments were performed at the Biomolecular NMR Center at the Johns Hopkins University.
Footnotes
Publisher's Disclaimer: This is a PDF file of an unedited manuscript that has been accepted for publication. As a service to our customers we are providing this early version of the manuscript. The manuscript will undergo copyediting, typesetting, and review of the resulting proof before it is published in its final citable form. Please note that during the production process errors may be discovered which could affect the content, and all legal disclaimers that apply to the journal pertain.
References
- 1.Lanyi JK, Luecke H. Bacteriorhodopsin. Current Opinion in Structural Biology. 2001;11:415–419. doi: 10.1016/s0959-440x(00)00226-8. [DOI] [PubMed] [Google Scholar]
- 2.Rastogi VK, Girvin ME. Structural changes linked to proton translocation by subunit c of the ATP synthase. Nature. 1999;402:263–268. doi: 10.1038/46224. [DOI] [PubMed] [Google Scholar]
- 3.Xie AH, Kelemen L, Hendriks J, White BJ, Hellingwerf KJ, Hoff WD. Formation of a new buried charge drives a large-amplitude protein quake in photoreceptor activation. Biochemistry. 2001;40:1510–1517. doi: 10.1021/bi002449a. [DOI] [PubMed] [Google Scholar]
- 4.Deisenhofer J, Epp O, Miki K, Huber R, Michel H. Structure of the protein subunits in the photosynthetic reaction centre of Rhodopseudomonas viridis at 3[angst] resolution. Nature. 1985;318:618–624. doi: 10.1038/318618a0. [DOI] [PubMed] [Google Scholar]
- 5.Abramson J, Smirnova I, Kasho V, Verner G, Kaback HR, Iwata S. Structure and Mechanism of the Lactose Permease of Escherichia coli. Science. 2003;301:610. doi: 10.1126/science.1088196. [DOI] [PubMed] [Google Scholar]
- 6.Zubkov S, Gronenborn AM, Byeon IJL, Mohanty S. Structural consequences of the pH-induced conformational switch in A. polyphemus pheromone-binding protein: Mechanisms of ligand release. Journal of Molecular Biology. 2005;354:1081–1090. doi: 10.1016/j.jmb.2005.10.015. [DOI] [PubMed] [Google Scholar]
- 7.Mulkidjanian AY. Conformationally controlled pK-switching in membrane proteins: One more mechanism specific to the enzyme catalysis? FEBS Letters. 1999;463:199–204. doi: 10.1016/s0014-5793(99)01536-7. [DOI] [PubMed] [Google Scholar]
- 8.Giletto A, Pace CN. Buried, Charged, Non-Ion-Paired Aspartic Acid 76 Contributes Favorably to the Conformational Stability of Ribonuclease T1. Biochemistry. 1999;38:13379–13384. doi: 10.1021/bi991422s. [DOI] [PubMed] [Google Scholar]
- 9.Fitch CA, Karp DA, Lee KK, Stites WE, Lattman EE, Garcia-Moreno B. Experimental pK(a) values of buried residues: Analysis with continuum methods and role of water penetration. Biophysical Journal. 2002;82:3289–3304. doi: 10.1016/s0006-3495(02)75670-1. [DOI] [PMC free article] [PubMed] [Google Scholar]
- 10.Dwyer JJ, Gittis AG, Karp DA, Lattman EE, Spencer DS, Stites WE, Garcia-Moreno EB. High Apparent Dielectric Constants in the Interior of a Protein Reflect Water Penetration. Biophys J. 2000;79:1610–1620. doi: 10.1016/S0006-3495(00)76411-3. [DOI] [PMC free article] [PubMed] [Google Scholar]
- 11.Garcia-Moreno B, Dwyer JJ, Gittis AG, Lattman EE, Spencer DS, Stites WE. Experimental measurement of the effective dielectric in the hydrophobic core of a protein. Biophysical Chemistry. 1997;64:211–224. doi: 10.1016/s0301-4622(96)02238-7. [DOI] [PubMed] [Google Scholar]
- 12.Daopin S, Anderson DE, Baase WA, Dahlquist FW, Matthews BW. Structural and Thermodynamic Consequences of Burying a Charged Residue within the Hydrophobic Core of T4 Lysozyme. Biochemistry. 1991;30:11521–11529. doi: 10.1021/bi00113a006. [DOI] [PubMed] [Google Scholar]
- 13.Nguyen DM, Reynald RL, Gittis AG, Lattman EE. X-ray and thermodynamic studies of staphylococcal nuclease variants 192E and 192K: Insights into polarity of the protein interior. Journal of Molecular Biology. 2004;341:565–574. doi: 10.1016/j.jmb.2004.05.066. [DOI] [PubMed] [Google Scholar]
- 14.Schutz CN, Warshel A. What are the dielectric “constants” of proteins and how to validate electrostatic models? Proteins-Structure Function and Genetics. 2001;44:400–417. doi: 10.1002/prot.1106. [DOI] [PubMed] [Google Scholar]
- 15.Harms MJ, Schlessman JL, Chimenti MS, Sue GR, Damjanovic A, Garcia-Moreno EB. A buried lysine that titrates with a normal pKa : Role of conformational flexibility at the protein-water interface as a determinant of pKa values. Protein Sci. 2008;17:833–845. doi: 10.1110/ps.073397708. [DOI] [PMC free article] [PubMed] [Google Scholar]
- 16.Harms MJ, Castañeda CA, Schlessman JL, Sue GR, Isom DG, Cannon BR, García-Moreno EB. The pKa Values of Acidic and Basic Residues Buried at the Same Internal Location in a Protein Are Governed by Different Factors. Journal of Molecular Biology. 2009;389:34–47. doi: 10.1016/j.jmb.2009.03.039. [DOI] [PMC free article] [PubMed] [Google Scholar]
- 17.Vijayakumar M, Zhou HX. Salt bridges stabilize the folded structure of barnase. Journal of Physical Chemistry B. 2001;105:7334–7340. [Google Scholar]
- 18.Warshel A. Calculations of Enzymatic-Reactions - Calculations of Pka, Proton-Transfer Reactions, and General Acid Catalysis Reactions in Enzymes. Biochemistry. 1981;20:3167–3177. doi: 10.1021/bi00514a028. [DOI] [PubMed] [Google Scholar]
- 19.Jackson JD. Classical electrodynamics. Wiley; New York: 1962. [Google Scholar]
- 20.Alexov EG, Gunner MR. Incorporating protein conformational flexibility into the calculation of pH-dependent protein properties. Biophys J. 1997;72:2075–2093. doi: 10.1016/S0006-3495(97)78851-9. [DOI] [PMC free article] [PubMed] [Google Scholar]
- 21.Sham YY, Chu ZT, Warshel A. Consistent calculations of pK(a)’s of ionizable residues in proteins: Semi-microscopic and microscopic approaches. Journal of Physical Chemistry B. 1997;101:4458–4472. [Google Scholar]
- 22.Schlessman JL, Abe C, Gittis A, Karp DA, Dolan MA, García-Moreno EB. Crystallographic Study of Hydration of an Internal Cavity in Engineered Proteins with Buried Polar or Ionizable Groups. 2008;94:3208–3216. doi: 10.1529/biophysj.107.122473. [DOI] [PMC free article] [PubMed] [Google Scholar]
- 23.Damjanovic A, Schlessman JL, Fitch CA, Garcia AE, Garcia-Moreno EB. Role of Flexibility and Polarity as Determinants of the Hydration of Internal Cavities and Pockets in Proteins. Biophys J. 2007;93:2791–2804. doi: 10.1529/biophysj.107.104182. [DOI] [PMC free article] [PubMed] [Google Scholar]
- 24.Karp DA, Gittis AG, Stahley MR, Fitch CA, Stites WE, Garcia-Moreno EB. High apparent dielectric constant inside a protein reflects structural reorganization coupled to the ionization of an internal Asp. Biophys J. 2007;92:2041–53. doi: 10.1529/biophysj.106.090266. [DOI] [PMC free article] [PubMed] [Google Scholar]
- 25.Stites WE, Gittis AG, Lattman EE, Shortle D. In a Staphylococcal Nuclease Mutant the Side-Chain of a Lysine Replacing Valine-66 Is Fully Buried in the Hydrophobic Core. Journal of Molecular Biology. 1991;221:7–14. doi: 10.1016/0022-2836(91)80195-z. [DOI] [PubMed] [Google Scholar]
- 26.Gilson MK, Honig BH. The Dielectric-Constant of a Folded Protein. Biopolymers. 1986;25:2097–2119. doi: 10.1002/bip.360251106. [DOI] [PubMed] [Google Scholar]
- 27.Careri G, Giansanti A, Rupley JA. Proton Percolation on Hydrated Lysozyme Powders. Proceedings of the National Academy of Sciences of the United States of America. 1986;83:6810–6814. doi: 10.1073/pnas.83.18.6810. [DOI] [PMC free article] [PubMed] [Google Scholar]
- 28.Bone S, Pethig R. Dielectric Studies of Protein Hydration and Hydration-Induced Flexibility. Journal of Molecular Biology. 1985;181:323–326. doi: 10.1016/0022-2836(85)90096-8. [DOI] [PubMed] [Google Scholar]
- 29.Bone S, Pethig R. Dielectric Studies of the Binding of Water to Lysozyme. Journal of Molecular Biology. 1982;157:571–575. doi: 10.1016/0022-2836(82)90477-6. [DOI] [PubMed] [Google Scholar]
- 30.Rupley JA, Careri G. Protein Hydration and Function. Advances in Protein Chemistry. 1991;41:37–172. doi: 10.1016/s0065-3233(08)60197-7. [DOI] [PubMed] [Google Scholar]
- 31.Chemical Rubber Company. Handbook of chemistry and physics : a ready-reference pocket book of chemical and physical data compiled from the most recent authoritative sources. CRC Press; Boca Raton, FL: 2004. [Google Scholar]
- 32.Denisov VP, Schlessman JL, Garcia-Moreno B, Halle B. Stabilization of internal charges in a protein: Water penetration or conformational change? Biophysical Journal. 2004;87:3982–3994. doi: 10.1529/biophysj.104.048454. [DOI] [PMC free article] [PubMed] [Google Scholar]
- 33.Karp D, Stahley MR, Garcia-Moreno EB. Conformational consequences of ionization of Lys, Asp and Glu buried at position 66 in staphylococcal nuclease. Biochemistry. 2010;49:4138–4146. doi: 10.1021/bi902114m. [DOI] [PMC free article] [PubMed] [Google Scholar]
- 34.Damjanovic A, Wu X, Garcia-Moreno B, Brooks BR. Backbone relaxation coupled to the ionization of internal groups in proteins: A self-guided Langevin dynamics study. Biophys J. 2008 doi: 10.1529/biophysj.108.130906. biophysj.108.130906. [DOI] [PMC free article] [PubMed] [Google Scholar]
- 35.Damjanovic A, Garcia-Moreno B, Lattman EE, Garcia AE. Molecular dynamics study of hydration of the protein interior. Computer Physics Communications. 2005;169:126–129. [Google Scholar]
- 36.Damjanovic A, Garcia-Moreno B, Lattman EE, Garcia AE. Molecular dynamics study of water penetration in staphylococcal nuclease. Proteins-Structure Function and Bioinformatics. 2005;60:433–449. doi: 10.1002/prot.20486. [DOI] [PubMed] [Google Scholar]
- 37.Kato M, Warshel A. Using a charging coordinate in studies of ionization induced partial unfolding. Journal of Physical Chemistry B. 2006;110:11566–11570. doi: 10.1021/jp061190o. [DOI] [PubMed] [Google Scholar]
- 38.Ghosh N, Cui Q. pKa of Residue 66 in Staphylococal nuclease. I. Insights from QM/MM Simulations with Conventional Sampling. J Phys Chem B. 2008 doi: 10.1021/jp800168z. [DOI] [PMC free article] [PubMed] [Google Scholar]
- 39.Zheng L, Chen M, Yang W. Random walk in orthogonal space to achieve efficient free-energy simulation of complex systems. Proceedings of the National Academy of Sciences. 2008;105:20227–20232. doi: 10.1073/pnas.0810631106. [DOI] [PMC free article] [PubMed] [Google Scholar]
- 40.John Mongan DACJAM. Constant pH molecular dynamics in generalized Born implicit solvent. Journal of Computational Chemistry. 2004;25:2038–2048. doi: 10.1002/jcc.20139. [DOI] [PubMed] [Google Scholar]
- 41.Georgescu RE, Alexov EG, Gunner MR. Combining conformational flexibility and continuum electrostatics for calculating pK(a)s in proteins. Biophysical Journal. 2002;83:1731–1748. doi: 10.1016/S0006-3495(02)73940-4. [DOI] [PMC free article] [PubMed] [Google Scholar]
- 42.Yoo J, Cui Q. Does arginine remain protonated in the lipid membrane? Insights from microscopic pK(a) calculations. Biophysical Journal. 2008;94:L61–L63. doi: 10.1529/biophysj.107.122945. [DOI] [PMC free article] [PubMed] [Google Scholar]
- 43.Chen JH, Brooks CL, Khandogin J. Recent advances in implicit solvent-based methods for biomolecular simulations. Current Opinion in Structural Biology. 2008;18:140–148. doi: 10.1016/j.sbi.2008.01.003. [DOI] [PMC free article] [PubMed] [Google Scholar]
- 44.Khandogin J, Brooks CL. Constant pH molecular dynamics with proton tautomerism. Biophysical Journal. 2005;89:141–157. doi: 10.1529/biophysj.105.061341. [DOI] [PMC free article] [PubMed] [Google Scholar]
- 45.Khandogin J, Brooks CL. Toward the accurate first-principles prediction of ionization equilibria in proteins. Biochemistry. 2006;45:9363–9373. doi: 10.1021/bi060706r. [DOI] [PubMed] [Google Scholar]
- 46.Castaneda CA, Fitch CA, Majumdar A, Khangulov V, Schlessman JL, Garcia-Moreno BE. Molecular determinants of the pK(a) values of Asp and Glu residues in staphylococcal nuclease. Proteins-Structure Function and Bioinformatics. 2009;77:570–588. doi: 10.1002/prot.22470. [DOI] [PubMed] [Google Scholar]
- 47.Isom DG, Cannon BR, Castañeda CA, Robinson A, García-Moreno EB. High tolerance for ionizable residues in the hydrophobic interior of proteins. Proceedings of the National Academy of Sciences. 2008;105:17784–17788. doi: 10.1073/pnas.0805113105. [DOI] [PMC free article] [PubMed] [Google Scholar]
- 48.Wittekind M, Mueller L. Hncacb, a High-Sensitivity 3d Nmr Experiment to Correlate Amide-Proton and Nitrogen Resonances with the Alpha-Carbon and Beta-Carbon Resonances in Proteins. Journal of Magnetic Resonance Series B. 1993;101:201–205. [Google Scholar]
- 49.Ferentz AE, Wagner G. NMR spectroscopy: a multifaceted approach to macromolecular structure. Quarterly Reviews of Biophysics. 2000;33:29–65. doi: 10.1017/s0033583500003589. [DOI] [PubMed] [Google Scholar]
- 50.Spera S, Bax A. Empirical correlation between protein backbone conformation and C.alpha. and C.beta. 13C nuclear magnetic resonance chemical shifts. J Am Chem Soc. 1991;113:5490–5492. [Google Scholar]
- 51.Wishart DS, Sykes BD. The C-13 Chemical-Shift Index - a Simple Method for the Identification of Protein Secondary Structure Using C-13 Chemical-Shift Data. Journal of Biomolecular Nmr. 1994;4:171–180. doi: 10.1007/BF00175245. [DOI] [PubMed] [Google Scholar]
- 52.Cornilescu G, Delaglio F, Bax A. Protein backbone angle restraints from searching a database for chemical shift and sequence homology. Journal of Biomolecular NMR. 1999;13:289–302. doi: 10.1023/a:1008392405740. [DOI] [PubMed] [Google Scholar]
- 53.Bai YW, Sosnick TR, Mayne L, Englander SW. Protein-Folding Intermediates - Native-State Hydrogen-Exchange. Science. 1995;269:192–197. doi: 10.1126/science.7618079. [DOI] [PMC free article] [PubMed] [Google Scholar]
- 54.Englander SW, Mayne L. Protein Folding Studied Using Hydrogen-Exchange Labeling and 2-Dimensional Nmr. Annual Review of Biophysics and Biomolecular Structure. 1992;21:243–265. doi: 10.1146/annurev.bb.21.060192.001331. [DOI] [PubMed] [Google Scholar]
- 55.Woodward C, Carulla N, Barany G. Energetics of Biological Macromolecules, Pt E. Vol. 380. Academic Press Inc; San Diego: 2004. Native state hydrogen-exchange analysis of protein folding and protein motional domains; pp. 379–400. [DOI] [PubMed] [Google Scholar]
- 56.Iwahara J, Jung YS, Clore GM. Heteronuclear NMR Spectroscopy for Lysine NH3 Groups in Proteins: Unique Effect of Water Exchange on 15N Transverse Relaxation. J Am Chem Soc. 2007;129:2971–2980. doi: 10.1021/ja0683436. [DOI] [PubMed] [Google Scholar]
- 57.Smith PE, Brunne RM, Mark AE, van Gunstere WF. Dielectric properties of trypsin inhibitor and lysozyme calculated from molecular dynamics simulations. J Phys Chem. 1993;97:2009–2014. [Google Scholar]
- 58.Simonson T, Perahia D. Internal and interfacial dielectric properties of cytochrome c from molecular dynamics simulations. Proc Natl Acad Sci USA. 1992;92:1082–1086. doi: 10.1073/pnas.92.4.1082. [DOI] [PMC free article] [PubMed] [Google Scholar]
- 59.Simonson T, Brooks CL., III Charge screening and the dielectric constant of proteins: Insight from molecular dynamics. J Am Chem Soc. 1996;118:8452–8458. [Google Scholar]
- 60.Pitera JW, Falta M, van Gunsteren Dielectric properties of proteins from simulations: the effects of solvent, ligands, pH and temperature. Biophys J. 2001;80:2546–2555. doi: 10.1016/S0006-3495(01)76226-1. [DOI] [PMC free article] [PubMed] [Google Scholar]
- 61.Shortle D, Meeker AK. Residual structure in large fragments of staphylococcal nuclease: effects of amino acid substitutions. Biochemistry. 1989;28:936–944. doi: 10.1021/bi00429a003. [DOI] [PubMed] [Google Scholar]
- 62.Bodenhausen G, Ruben DJ. Natural abundance nitrogen-15 NMR by enhanced heteronuclear spectroscopy. Chemical Physics Letters. 1980;69:185–189. [Google Scholar]
- 63.Kay L, Keifer P, Saarinen T. Pure absorption gradient enhanced heteronuclear single quantum correlation spectroscopy with improved sensitivity. J Am Chem Soc. 1992;114:10663–10665. [Google Scholar]
- 64.Vangeet AL. Calibration of Methanol Nuclear Magnetic Resonance Thermometer at Low Temperature. Analytical Chemistry. 1970;42:679. [Google Scholar]
- 65.Pellecchia M, Iwai H, Szyperski T, Wüthrich K. The 2D NMR Experiments H(C)CO2 and H2 for Assignment and pH Titration of Carboxylate Groups in Uniformly 15N/13C-Labeled Proteins. Journal of Magnetic Resonance. 1997;124:274–278. doi: 10.1006/jmre.1996.1058. [DOI] [PubMed] [Google Scholar]
- 66.Delaglio F, Grzesiek S, Vuister GW, Zhu G, Pfeifer J, Bax A. Nmrpipe - a Multidimensional Spectral Processing System Based on Unix Pipes. Journal of Biomolecular Nmr. 1995;6:277–293. doi: 10.1007/BF00197809. [DOI] [PubMed] [Google Scholar]
- 67.Kneller DG, Kuntz ID. Ucsf Sparky - an Nmr Display, Annotation and Assignment Tool. Journal of Cellular Biochemistry. 1993:254–254. [Google Scholar]
- 68.Wishart DS, Bigam CG, Yao J, Abildgaard F, Dyson HJ, Oldfield E, Markley JL, Sykes BD. 1H, 13C and 15N chemical shift referencing in biomolecular NMR. Journal of Biomolecular NMR. 1995;6:135–140. doi: 10.1007/BF00211777. [DOI] [PubMed] [Google Scholar]
- 69.Ginzinger S, Gerick F, Coles M, Heun V. CheckShift: automatic correction of inconsistent chemical shift referencing. Journal of Biomolecular NMR. 2007;39:223–227. doi: 10.1007/s10858-007-9191-5. [DOI] [PubMed] [Google Scholar]
- 70.DeLano WL. The PyMOL Molecular Graphics System. DeLano Scientific LLC; Palo Alto, CA, USA: 2008. [Google Scholar]
Associated Data
This section collects any data citations, data availability statements, or supplementary materials included in this article.