

Abstract
Multiple self-guided Langevin dynamics (SGLD) simulations were performed to examine structural and dynamical properties of the receiver domain of Nitrogen Regulatory Protein C (NtrCr). SGLD and MD simulations of the phosphorylated active form structure suggest a mostly stable but broad structural ensemble of this protein. The finite difference Poisson-Boltzmann calculations of the pKa values of the active site residues suggest an increase in the pKa of His-84 upon phosphorylation of Asp-54. In SGLD simulations of the phosphorylated active form with charged His-84 the average position of the regulatory helix α4 is found closer to the starting structure than in simulations with the neutral His-84. To model the transition pathway the phosphate group was removed from the simulations. After 7 ns of simulations, the regulatory helix α4 was found approximately halfway between positions in the NMR structures of the active and inactive forms. Removal of the phosphate group stimulated loss of helix α4, suggesting that the pathway of conformational transition may involve partial unfolding mechanism. The study illustrates the potential utility of the SGLD method in studies of the coupling between ligand binding and conformational transitions.
Keywords: Self-guided Langevin dynamics, allostery, conformational transitions, NtrC
Introduction
Reversible phosphorylation of proteins is an important mechanism of cellular regulation. As many as one third of the proteins encoded by the human genome can be modified covalently through phosphorylation [1], and it is well known that abnormal phosphorylation is linked to many human diseases [2]. The covalent attachment of a phosphate group to the sidechain of a protein can alter its conformation and activity. Phosphorylation constitutes the trigger of many protein switches.
To respond to changes in the concentration of certain molecules in their environment, bacteria often use two-component signal transduction [3]. Chemotaxis, nitrogen regulation, or osmoregulation are examples of processes controlled through two-component signaling pathways. The two components are typically a histidine kinase and a response regulator. The role of the histidine kinase is to respond to changes in the environment, and subsequently phosphorylate an aspartate residue in the N-terminal receiver domain of the response regulator.
The Nitrogen regulatory protein C (NtrC) of enteric bacteria is a response regulator composed of three domains: the N-terminal receiver domain, the ATPase domain, and the DNA-binding domain [4]. Upon phosphorylation of the receiver domain (NtrCr), the protein oligomerizes to form the fully active ATPase rings. The energy of ATP hydrolysis is used to open the DNA at the σ54-polymerase bound promoter and initiate expression of genes necessary for nitrogen metabolism [4, 5].
The NMR structures of active and inactive forms of NtrCr have recently become available (Table 1 [5, 6, 7]). NtrCr is composed of a central core formed by five parallel β-strands, surrounded by five α-helices. The structures of the inactive protein (I-NtrCr) [5] and the berrylofluoride activated protein [7] are shown in Figure 1. It has recently been shown that several response regulators complexed with are functionally similar to their phosphorylated counterparts [8]. The NMR structure of the phosphorylated protein (P-NtrCr) is also available [6], however the lifetime of the phosphorylated protein was short, and some key features were not defined well by the NMR data. In contrast, the protein activated with was more stable and a high resolution NMR structure was obtained [7]. The pdb accession codes of the three forms of the protein, and the labeling used through this paper, is summarized in Table 1. The inactive and active proteins are monomeric in the NMR experiments [5, 6].
Table 1.
Activity, pdb accession codes, and labeling for the three NMR structures available for NtrCr.
Figure 1.
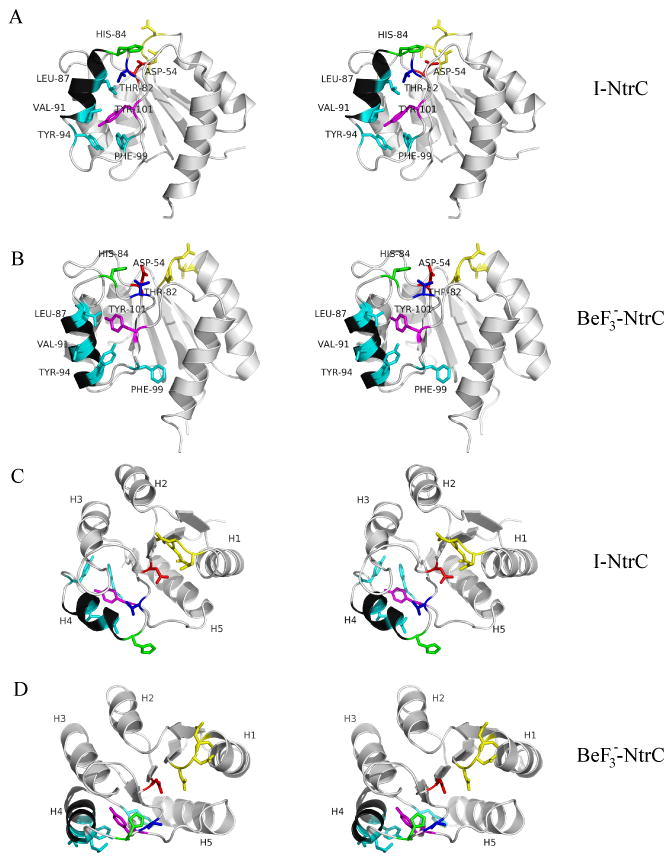
Stereoview of briefly minimized NMR structures of NtrCr. A) Side view of I-NtrCr, B) side view of , C) top view of I-NtrCr, D) top view of . The key helix, α4, is shown in black. Locations of residues Thr-82 (blue), Leu-87, Val-91, Tyr-94, Phe-99 (cyan), Tyr-101 (purple), Asp-54 (red), and His-84 (green) is indicated in top two figures. Residues Asp-10, Asp-11, Asp-12 are shown in yellow.
Phosphorylation occurs at Asp-54. I-NtrCr and P-NtrCr differ in the position of strands β4, β5, helices α3, α4, and their incoming and outgoing loops. differs from P-NtrCr in the position of helix α3; in helix α3 is closer to the position adopted in the inactive protein. Both structures reveal that upon activation, helix α4 undergoes register shift and reorientation, exposing some hydrophobic residues in this helix to water. This subtle reorganization is believed to promote the oligomerization necessary for ATP hydrolysis [7]. The location of key residues that differ between the inactive NtrCr and the active are shown in Figure 1.
NMR relaxation studies revealed a strong correlation between phosphorylation-driven activation of NtrCr and microsecond time-scale backbone dynamics. This suggests that the conformational transition between the two structures occurs on a microsecond time-scale [9]. These studies have also suggested that the dephosphorylated protein may shift spontaneously between the active and inactive conformations on the microsecond time-scale. After phosphorylation, the equilibrium is shifted toward the active conformation and the conformational exchange is diminished [9]. To understand the molecular basis of the activation it is necessary to know how and why the phosphorylation stabilizes the ensemble of proteins in the active conformation, and how the conformational change occurs.
Molecular dynamics (MD) simulations can yield detailed, atomic level descriptions of protein dynamics necessary for examining mechanisms of protein function. However, routine MD simulations of proteins currently are limited to the nanosecond timescales. Significant efforts have been dedicated toward developing new methods for enhanced conformational sampling with a variety of algorithms [10]: coarse graining, smoothing protocols, generalized ensembles, optimization of actions, or addition of constraints or forces. Several coarse grained approaches have recently been applied to the study of conformational transitions of NtrCr. The string method with swarms of trajectories suggested that a genuine transition state exists for the transition [11]. In [12], the large free energy barrier predicted for NtrC conformational transition was suggestive of partial unfolding. A coarse grained elastic network model was also used to characterize fluctuations and correlations in NtrCr [13]. A discrete sampling study of the pathways of conformational change in NtrC has been performed based on the united atom force field, and an implicit solvent model [14].
In this paper we use a full atom, explicit solvent description. Although the simulation times are still insufficient to observe the conformational transitions, valuable insight into structural and dynamical properties of the active and inactive conformations were obtained. In a previous all atom simulation of NtrCr [15], the end-point conformations were characterized based on a single MD trajectory, and a targeted MD was performed to study the transition pathway. One drawback of this approach is that the pathways obtained through targeted MD are often unrealistic. Furthermore, we show that a single MD trajectory is insufficient to represent the large spectrum of conformations accessible to the active and inactive proteins.
In this study, pKa calculations were used to characterize the protonation states of ionizable residues in NtrC, and the impact of phosphorylation on these protonation states. The conformational space and dynamics of active and inactive species, and effects of dephosphorylation were characterized through a relatively new method for enhanced conformational search, i.e., the self-guided Langevin dynamics (SGLD) simulations [16]. SGLD differs from Langevin dynamics simulations in the use of additional guiding forces determined on the fly, which are proportional to the momentum of the particle averaged over a pre-determined time window. In peptide folding simulations [17], and in simulations of conformational changes triggered by ionization of internal groups in proteins [18], the SGLD method has shown promising enhancements in conformational search efficiency compared to regular Langevin dynamics, without altering significantly the conformational ensemble [16].
Methods
Simulated proteins and simulation setup
The NMR structures of NtrCr used as starting structures for the simulations are listed in Table 1. The structure of the phosphate group is not reported in the structure with accession code 1DC8, whereas the structure of the berrylofluoride was reported as the 1J56 entry. The latter structure was employed for the simulations of the phosphorylated protein, with the BeF3− group replaced with the PO42− group.
The following systems were simulated: (1) dephosphorylated I-NtrCr, (2) dephosphorylated P-NtrCr, (3) dephosphorylated BeF3−-NtrCr, (4) phosphorylated BeF3−-NtrCr (labeled as BeF3−-NtrCr-P). In the NMR experiments BeF3− mimics the phosphate group in achieving activation, and thus in the simulations we have replaced the coordinates of the BeF3− molecule with those of a PO32− group. Since the pKa calculations revealed that phosphorylation may increase the pKa of His-84, additional simulation were performed (5) with phosphorylated BeF3−-NtrCr and charged His-84 (labeled as BeF3−-NtrCr-P-Hsp84). To test the dependence of the results on starting NMR structures, an additional simulation that utilizes the first structure from the ensemble of NMR structures of I-NtrCr (pdb accession code 1NTR [5]) was performed (6).
The program CHARMM [19] was used to set up the system and for subsequent MD and SGLD runs. The CHARMM force field, version 27 [20] was used. Briefly minimized proteins were embedded in a water box. Water molecules of the box within 2.5 Å of the protein were removed. The protein was centered at the coordinate origin, and all water molecules further than 36 Å from the origin were deleted. The total number of water and ion molecules for the simulated systems were: 5277 water molecules, 16 Na+ ions, 10 Cl− ions for system (1), 5260 water molecules, 16 Na+ ions, 10 Cl− ions for system (2), 5300 water molecules, 16 Na+ ions, 10 Cl− ions for system (3), 5299 water molecules, 6 Na+ ions, 9 Cl− ions for system (4), 5393 water molecules, 15 Na+ ions, 9 Cl− ions for system (5), 5237 water molecules, 16 Na+ ions, 10 Cl− ions for system (6). All histidine residues were protonated at the Nδ1 site, as in the NMR structures of I-NtrCr and P-NtrCr. The exceptions were the simulations of BeF3−-NtrCr (i.e., simulations (3) and (4)) where His-84 was protonated at the Nε2 site that points toward the negatively charged Asp-54 residue. In simulations (5), His-84 was protonated at both sites, i.e., charged. The systems were subjected to minimizations under rhombic dodecahedral symmetry.
MD and SGLD simulations
The systems were heated up in steps of 2 K, starting from a temperature of 100 K, until a temperature of 300 K was reached. Equilibration in an NPT ensemble was performed for 100 ps. During this step all remaining vacuum regions in the original setup were eliminated. The extended system formalism was used to maintain constant pressure and temperature via the Hoover thermostat [21] with a thermostat coupling constant of 1,000 kcal/mol/ps2. The normal pressure was maintained with a barostat with a piston mass of 500 amu, and piston collision frequency of 20/ps [22]. Rhombic dodecahedral periodic boundary conditions, and particle mesh Ewald (PME) method [23] for electrostatic interactions were employed, with the following parameters for Ewald simulations: κ = 0.45, interpolation order of 6, grid spacing of approximately 1 Å, and real space interaction cutoff of 10 Å. Lennard-Jones interactions were shifted to zero after 10 Å. The leapfrog Verlet algorithm was used with a timestep of 1 fs. Multiple heating and equilibration runs were performed for each of the simulated proteins, with different seed numbers for the random number generator used for assigning initial velocities. With systems (1), (2), and (3) 50 simulations were performed. 25 simulations were performed for all other systems.
SGLD simulations [16] were performed for each of the completed equilibration runs. The equation of motion for the SGLD dynamics of an N particle system is
| (1) |
where γi is the collision frequency, R⃗i is a random force, λi is the guiding factor. L represents the number of timesteps over which the averaging is performed, and the averaging time tL = Lδt; where δt is the timestep. The same friction coefficient γ and guiding factor λ was used for all particles. SGLD runs were performed in an NVT ensemble at T=300K, with the following parameters: tL = 0.1 ps, λ=1.0 and γ = 1/ps. In a previous benchmark study [18] this set of parameters was shown to yield good sampling of infrequent events. A local averaging time of 0.1 ps was chosen to accelerate non-bonded motions that do not contribute to conformational transitions. The default length of SGLD simulations was 4 ns. Simulations (3), (4) and (5) were extended to 7 ns.
Parameters for phosphorylated aspartate
Two new residue types were created for phosphorylated aspartate: ASP1, with a net charge of -1, and ASP2 with a net charge of -2. Atom types for the two residues used here are shown in Table 2. The missing force-field parameters, including all Lennard-Jones parameters, were taken from the combined protein and nucleic acid CHARMM27 parameter and topology files [20]: Partial charges of the phosphate group in ASP1 and ASP2 are the same as for the anionic and dianionic methylphosphate respectively. ON2-CD bond terms are the same as for OH1-CD, CD-ON2-P angle terms were taken from methyl phosphate, ON2-CD-CT2, ON2-CD-CT3, and ON2-CD-OB were taken from OH1-CD-CT2, OH1-CD-CT3, and OH1-CD-OB respectively, and dihedral terms CD-ON2-P-ON3 were taken from phenol phosphate CA-ON2b-P-ON3. The remaining missing parameters were the torsion angle X-CD-ON2-X, and partial charges on CG and OD1 atoms. These parameters were obtained through fitting to the QM potentials for the torsion angle X-CD-ON2-X.
Table 2.
Atom types and partial charges of ASP1 and ASP2.
| ASP1 | ASP2 | ||||
|---|---|---|---|---|---|
| atom name | atom type | charge | atom name | atom type | charge |
| CB | CT2 | -0.18 | CB | CT2 | -0.18 |
| HB1 | HA | 0.09 | HB1 | HA | 0.09 |
| HB2 | HA | 0.09 | HB2 | HA | 0.09 |
| CG | CD | 0.61 | CG | CD | 0.51 |
| OD1 | OB | -0.51 | OD1 | OB | -0.51 |
| P | P | 1.50 | P | P | 1.10 |
| OD2 | ON2 | -0.62 | OD2 | ON2 | -0.40 |
| H2 | HN4 | 0.34 | |||
| OP1 | ON3 | -0.82 | OP1 | ON3 | -0.90 |
| OP2 | ON4 | -0.68 | OP2 | ON3 | -0.90 |
| OP3 | ON3 | -0.82 | OP3 | ON3 | -0.90 |
The QM potential for the torsion angle X-CD-ON2-X was determined as follows: initial structures for a new residue ASP1 and ASP2 were energy minimized by using the MP2 method with the 6-311G** basis set within the framework of the program Q-Chem [24] interfaced with CHARMM [25]. The CH2 group that corresponds to the Cβ carbon, and the two hydrogens bonded to it was replaced with a CH3 group. The charge on ASP1 and ASP2 was set to -1 and -2 respectively. The structures were rotated around the CD-ON2 bond in steps of 10 degrees. Such structures were further geometry minimized while the torsion angle CT3-CD-ON2-P was constrained at the desired 10 degree increments. The total energies for the geometry minimized structures were recorded. These energies were used for comparison with the energies determined through classical mechanics.
Trial parameters were constructed for the partial charges on CG and OD1 atoms and the torsion angle X-CD-ON2-X. The coordinates of different rotamers minimized with the MP2 method were further minimized through CHARMM by using this trial parameter set. The dihedral angle CT3-CD-ON2-P was constrained with the force constant of 500 kcal/mol during minimization. Classical energies were determined based on the minimized structures, and compared with the QM energies for all of the trial parameters. The partial charge of -0.51 on OD1 was shown to yield a closest fit to the QM energy difference calculated for the torsion angles of 0 and 90 degrees. The charge on CG was fixed to yield a total charge of -1 and -2 on ASP1 and ASP2 respectively. Parameters for dihedral term X-CD-ON2-X were determined through fitting of the entire QM potential, after fixing the charges on OD1 and CG. The values that resulted in the best fit, as well as all of the other parameters that we supplied are given in the Supplementary Material.
pKa calculations
pKa calculations were performed with the finite difference Poisson-Boltzmann (FDPB) method using the UHBD package [26]. The single-site method was used, as described in [27, 28]. Polar hydrogen atoms were added to the protein in the neutral state with the HBUILD facility in CHARMm (Accelrys Inc.). The position of the hydrogen atoms was energy minimized while all heavy atoms were kept static. Hydrogen atoms were placed on OD2 of all Asp, and on the OE2 of all Glu. The neutral histidines were, rather randomly, protonated at the Nε2 atom. An additional set of calculations with all histidines protonated at the Nδ1 atom was performed. Partial charges were taken from the CHARMm polar-hydrogen-only topology file version 21 (CHARMm, Accelrys Inc.), and atomic radii from the OPLS parameter set [29]. The following set of model compound pKa values was used in the calculations: C-term, 3.8; Asp Cγ, 4.0; Glu Cδ, 4.4; His Nδ1 or Nε2, 6.3; N-term, 7.5; Tyr OH, 9.6; Lys Nζ, 10.4; Arg Cζ, 12.0. In all the calculations, the temperature was 298 K, the Stern layer was set at 2.0 Å, the external dielectric constant was 78.5, and the protein dielectric constant was set to 20 [27]. Four grid sets were used with the following spacing and dimensions: 1.5 Å, 653; 1.2 Å, 403; 0.75 Å, 403; 0.25 Å, 403. A Richard's probe-accessible surface was used with a probe radius of 1.4 Å.
FDPB calculations were performed on two types of NMR structures (Table 1): an ensemble averaged and minimized structure, and ensembles of NMR structures. The ensemble structures are available for the inactive form (pdb accession code 1NTR) and the berrylofluoride-activated form (pdb accession code 1KRX). The pKa values determined on an ensemble of structures were further averaged.
In calculations with the phosphorylated aspartate, the new residue type, ASP2, was used. It correspond to a phosphorylated aspartate with net charge of -2. In the pKa calculations, ASP2 was treated as non-titrable. The parameters in file pkaS.dat were obtained as follows: ε, σ, and r parameters were taken from the OPLS force field [29]. The charges for ASP2 were taken from the MSI distributed version of CHARMm (Accelrys Inc). These parameters are summarized in the Supplementary Material.
Cross-correlation matrix
The dynamic cross-correlation matrix Cij reveals large-scale correlated motions of the protein. The matrix elements Cij are calculated according to expression:
| (2) |
Here Δr⃗i(t) is the displacement of the coordinate r⃗i(t) from its average position. The average 〈〉 was calculated over all snapshots aligned with the first snapshot. In this case, the alignment was based on the root mean square deviations (RMSDs) fit between all Cα protein atoms. All 124 Cα atoms were included in the calculation of the Cij matrix. Correlation coefficients were determined for individual simulations, and were further averaged over all 25 (or 50) simulations.
Results and Discussion
pKa values of active site residues
The active site contains a large number of ionizable residues (Figure 1). Strong electrostatic interactions and desolvation could shift the pKa values of those groups away from the model compound values. To estimate the magnitude of those effects, the pKa values of ionizable groups in NtrCr were calculated. The pKa values of active site residues His-84, Asp-54, Asp-10, and Asp-12 are presented in Table 3.
Table 3.
pKa values calculated with the FDPB method. In columns labeled with “ensemble”, average values of calculations performed on an ensemble of NMR structures are given. In columns labeled with “average”, results of calculations on a single averaged NMR structure are given. Labels “Nε2” and “Nδ1” next to His-84 denote that during the calculations, all histidines were protonated at the denoted atom.
| structure | ensemble | average | structure | ensemble | average |
|---|---|---|---|---|---|
| His-84 (Nε2) | |||||
| I-NtrCr | 6.5 | 6.9 | I-NtrCr-P | - | - |
| P-NtrCr | - | 6.5 | P-NtrCr-P | - | 6.8 |
| BeF3−-NtrCr | 6.2 | 7.1 | BeF3−-NtrCr-P | 6.8 | 7.1 |
| His-84 (Nδ1) | |||||
| I-NtrCr | 6.4 | 6.8 | I-NtrCr-P | - | - |
| P-NtrCr | - | 6.6 | P-NtrCr-P | - | 7.0 |
| BeF3−-NtrCr | 6.4 | 6.5 | BeF3−-NtrCr-P | 6.7 | 7.2 |
| Asp-54 | |||||
| I-NtrCr | 5.1 | 5.4 | I-NtrCr-P | - | - |
| P-NtrCr | - | 5.6 | P-NtrCr-P | - | - |
| BeF3−-NtrCr | 4.0 | 1.1 | BeF3−-NtrCr-P | - | - |
| Asp-10 | |||||
| I-NtrCr | 4.7 | 0.6 | I-NtrCr-P | - | - |
| P-NtrCr | - | 1.9 | P-NtrCr-P | - | 3.2 |
| BeF3−-NtrCr | 5.8 | 3.6 | BeF3−-NtrCr-P | 7.1 | 3.2 |
| Asp-12 | |||||
| I-NtrCr | 4.2 | 3.4 | I-NtrCr-P | - | - |
| P-NtrCr | - | 4.0 | P-NtrCr-P | - | 6.2 |
| BeF3−-NtrCr | 3.8 | 4.1 | BeF3−-NtrCr-P | 3.6 | 3.6 |
The table shows that the pKa values calculated with the average minimized NMR structure (reported under column “average” in Table 3) and as an average over an ensemble of NMR structures (reported under column “ensemble”) are different. Previous studies [30] have indicated that pKa calculations on an ensemble of NMR structures reproduce experimental pKa values better than calculations on the average NMR structure.
Phosphorylation shifts the calculated pKa values. The pKa value of His-84 is, as expected from favorable Coulomb interactions, raised by phosphorylation. In calculations based on the NMR structural ensemble, with His-84 protonated at the Nε2 atom, the pKa value is raised from 6.2 to 6.8 upon phosphorylation. The experimental pKa value for activated NtrCr is 6.3. Despite the systematic errors of calculated pKa values, and their sensitivity to local interactions [27, 31, 32], the increase in calculated pKa value of His-84 is likely to be robust for several reasons: (1) The pKa values were compared for the same structure; (2) a dielectric constant of 20 was used to reduce sensitivity to local detail; (3) the increase in the pKa value of His-84 is consistently observed for all structures. Because His-84 is located in the β4-α4 loop that is believed to be important for the conformational change, the possibility that phosphorylation leads to the charging of this residue was also taken into consideration in the SGLD calculations.
Asp-10 and Asp-12 also experience phosphorylation-induced shifts in pKa value. The calculated shifts in some structures are large (up to 2.2 pKa), but the directions of the shifts differ for different structures. Since an Mg+2 ion, included in experimental setup and possibly buried with the phosphate group but not included in the calculations of the pKa values, could be bound to these residues, its presence might compensate for the large pKa value shift induced by phosphorylation. Asp-10 and Asp-12 are located on the side of the active site opposite to helix α4 (the helix that undergoes the conformational change) and are not considered to be important for the conformational transition. For this reason the possible effects of changes of protonation state of Asp-10 and Asp-12 on the dynamics of the protein were not examined in detail.
MD and SGLD simulations of the phosphorylated NtrCr
NMR relaxation experiments [9] suggest that the unphosphorylated NtrCr shifts between the inactive and active conformations, while the phosphorylated NtrCr appears to be stable in the active conformation. For this reason, the simulations of the phosphorylated form were used to describe the stable conformational ensemble that does not undergo a conformational transition. Because the pKa calculations suggest raised pKa value of His-84 upon phosphorylation, at first this residue was modeled in the charged state.
To obtain statistically meaningful data multiple simulations were performed and analyzed. RMSD values based on two sets of 25 simulations were determined and compared. Since the calculated RMSD values were nearly identical, we concluded that an ensemble of 25 simulations was sufficient to achieve convergence in terms of RMSD values. These 25 simulations do not necessarily represent the full spectrum of conformations available to this protein.
The average secondary structure of the conformational ensemble during the 4th ns of simulations is shown in Figure 2A. The coordinates from all SGLD simulations were recorded every 10 ps. For each of the snapshots the secondary structure was assigned with DSSP [33]. The percent of time that a protein residue was assigned a label “H” (for α-helix) or “b” (for β-strand) in DSSP is shown in Figure 2A. Secondary structure calculations were performed for all residues, except for terminal and loop residues 1,2, 56, 57, 58 and 59, which were assigned zero secondary structure content.
Figure 2.
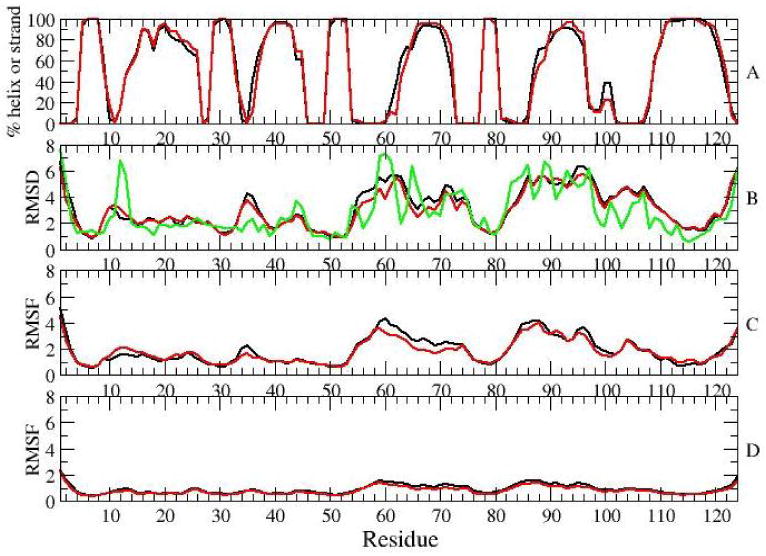
Analysis of results for the 4th ns of SGLD (black) and MD (red) simulations of the form: A) Ensemble averaged secondary structure content B) Ensemble average RMSDs between the initial structure and simulation snapshots. Green line is showing RMSD values between two NMR structures of the active form. C) RMSFs of average structures of individual simulations. D) Ensemble average of RMSFs of individual simulations.
Except for β5, all of the β-strands are stable in the simulations. β5 has been shown to be dynamic in the NMR relaxation experiments [9]. Although helix α5 appears to be stable, there is slight loss of secondary structure of helices α1, α2, α3 and α4. The largest loss, of about 9 % is for helix α4. To determine whether this loss is real, and not simply an artifact of the way that DSSP assigns secondary structure (i.e., based on hydrogen-bond patterns), average secondary structure was also calculated with another method, kaksi [34] (based on Cα distances and Φ/Ψ angles). The loss in secondary structure of helix α4 determined with this method is 1 %, suggesting that the decay in secondary structure observed by DSSP does not involve large structural changes of the helix.
Root mean square deviations (RMSDs) and root mean square fluctuations (RMSFs) during the 4th ns of simulations are also shown in Figure 2. The RMSDs and RMSFs were determined based on simulation snapshots taken every 10 ps. Prior to the calculations, backbone atoms of residues 4-9, 14-53 and 108-121 were aligned, as suggested in [9]. Calculated RMSDs and RMSFs were first determined for each individual simulation and then ensemble averaged. Figure 2B shows the RMSDs between the initial structure and snapshots taken during the 4th ns; Figure 2C shows RMSFs of average structures of individual simulations from the average structure of the ensemble. Figure 2E displays the ensemble average RMSFs during the 4th ns of individual simulations.
Largest RMSD and RMSF values were observed in the areas of β3-α3 loop, helix α3, β4-α4 loop, helix α4 and α4-β5 loop. These parts of the protein coincide with the areas that differ in structures of the inactive and active forms, and which exhibit dynamics on a microsecond timescale [9]. We note that since residues in these dynamic areas were not used for alignment of structures in RMSDs calculations, the determined RMSD values appear to be slightly larger than they would have been had the entire protein backbone been used for these calculations. Fluctuations in individual simulations are smaller than differences between different simulations, as suggested by RMSFs in Figure 2C, which reach 2 Å, compared to RMSFs in Figure 2B, which reach 5-6 Å. While the ensemble averaged RMSD from the initial structure reach 6 Å (Figure 2B), RMSDs of individual simulations fluctuate between 2 Å and in some cases reach 11 Å(Figure 3).
Figure 3.
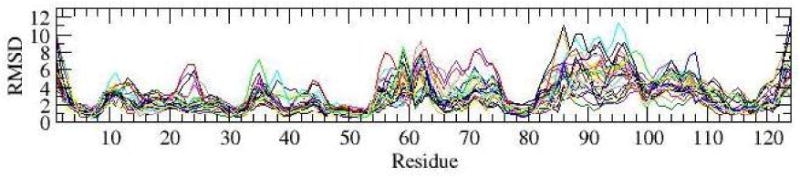
RMSDs between the initial structure and 25 individual simulations of the form during the 4th ns.
To test whether the inhomogeneity in the structural ensemble of NtrCr is an artifact of the SGLD method, we have compared the results obtained through 25 simulations with SGLD, with results obtained through 25 simulations with regular MD simulations. The comparison is shown in Figure 2. The parameters and methods used to perform MD runs are the same as for the equilibration runs. The results reveal that the secondary structure content observed with the two methods are very similar. Both methods show a broad conformational ensemble. RMSD values determined with SGLD are slightly larger than those obtained with MD. This suggest that SGLD, as expected, searches conformational space better than regular MD simulations. Previous extensive benchmarking of the SGLD method in its ability to describe conformational changes triggered by ligand binding has shown that SGLD outperforms Langevin dynamics simulations in sampling alternative protein conformations without loss of accuracy and level of detail characteristic of regular Langevin dynamics [18].
Finally, we argue that the ensemble of structures observed in the simulations of phosphorylated NtrCr is not necessarily in disagreement with the NMR data. The RMSD values between the NMR structures activated through phosphorylation and through are superimposed on Figure 2B. These RMSD values are comparable to those observed in the simulations, suggesting that multiple and different structures may agree with the NMR data.
Dephosphorylation of Asp-54 and uncharging of His-84
To explore how phosphorylation and charging of His-84 influence the active state, the simulations of form with three different ligands were compared: (i) no phosphate on Asp-54, and neutral His-84 (BeF3−-NtrCr), (ii), phosphorylated Asp-54, and neutral His-84 (BeF3−-NtrCr-P), and (iii) phosphorylated Asp-54, and charged His-84 (BeF3−-NtrCr-P-Hsp84). To gain better insight into the differences between the three sets of simulations, we have extended these simulations to a total of 7 ns.
Structural and dynamical properties of the simulated proteins during the 7th ns of simulations are compared in Figure 4. Loss of the phosphate group impacts the α-helical content of helix α4 and the C-terminus of helix α1 the most. The maximal α-helical content of helix α4 calculated with DSSP [33] is 77 % in simulations of , 92 % in simulations of , and 89 % in simulations of . With kaksi [34], the maximal α-helical content is 93% , 98% and 97% for . This is an indication that partial unfolding of helix α4 is not simply a characteristic of the local structural ensemble, but a consequence of dephosphorylation.
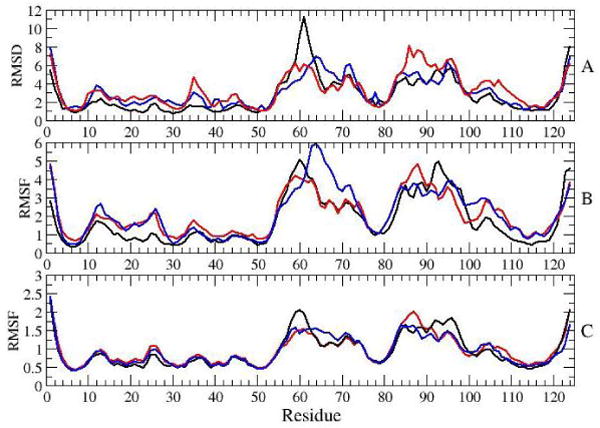
Figure 4.
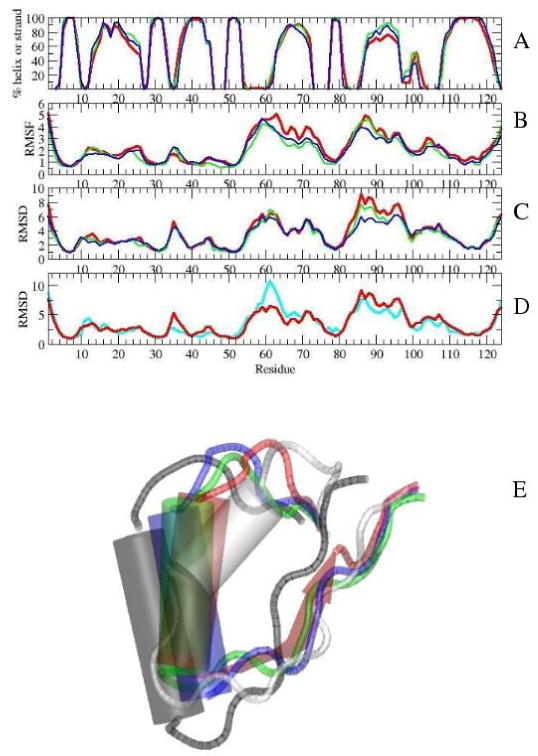
Top: Average properties during the 7th ns of simulations with (red), (green), and (blue): A) secondary structure, B) RMSFs of average structures of individual simulations, C) RMSDs from the initial structure. D) RMSD values of the simulations from the initial structures of (red) and I-NtrCr (cyan). E) Position of helix α4 in initial NMR structures of (gray) and I-NtrCr (white), and in average structures of (red), (green), and (blue). The positions were plotted after residues 5-55 were aligned in VMD [39].
The structural ensemble of the dephosphorylated form, as characterized by the fluctuations of different simulations (Figure 4B), is the most inhomogeneous. Interestingly, simulations of the phosphorylated form with charged His-84 show more homogeneous ensemble than the other two simulated forms in the area of the N-terminus of helix α4, especially residues 87, 88 and 89. In terms of RMSD fluctuations from the initial NMR structure the same holds true: charging of His-84 combined with phosphorylation yields smaller values for helix α4 than the other two forms (Figure 4C). This is also shown through comparison (Figure 4E) of the average structures of , and during the 7th ns of simulations with initial NMR structures of and I-NtrCr. The figure shows that the average structures of helix α4 in simulations of and are very close to each other, and are roughly half way between helix α4 of the NMR structures of and I-NtrCr. In fact, in simulations of the form, helix α4 has smaller RMSD values to the NMR structure of the I-NtrCr than to the NMR structure of (Figure 4D). In contrast, helix α4 of was found closest to the NMR structure of .
Conformational consequences of dephosphorylation
To gain physical insight into types of conformational reorganization occurring upon dephosphorylation, simulations of the form were additionally analyzed. These simulations showed the most extensive deviations from the starting structure in the area around the functionally important helix α4 (Figure 4). The structural changes were quantified based on the closeness of particular trajectories to the structure of the inactive protein. The time evolution of key protein residues that adopt a distinctly different orientation in the active and inactive forms was followed. These residues include Thr-82, Leu-87, Val-91, Tyr-94, Phe-99, and Tyr-101 (Figure 1). In particular, we focus on the orientation of the sidechain of Thr-82 (as measured by the 82:OG1-101:O separation), on the orientation of the sidechain of Tyr-101 (as measured by the 101:OH-90:O separation), and on distances between 94:OH-100:CG and 99:CE1-117:CA. As a measure of hydrophobicity of residues 87 and 91, the number of water oxygen atoms within 4 Å of atoms CD1 and CD2 of Leu-87 and of atoms CG1 and CG2 of Val-91 was determined. Snapshots from simulations in which one of these key parameters was closest to the values observed in the inactive structure are shown in Figure 5. The snapshots were taken at the end of the 7th ns.
Figure 5.
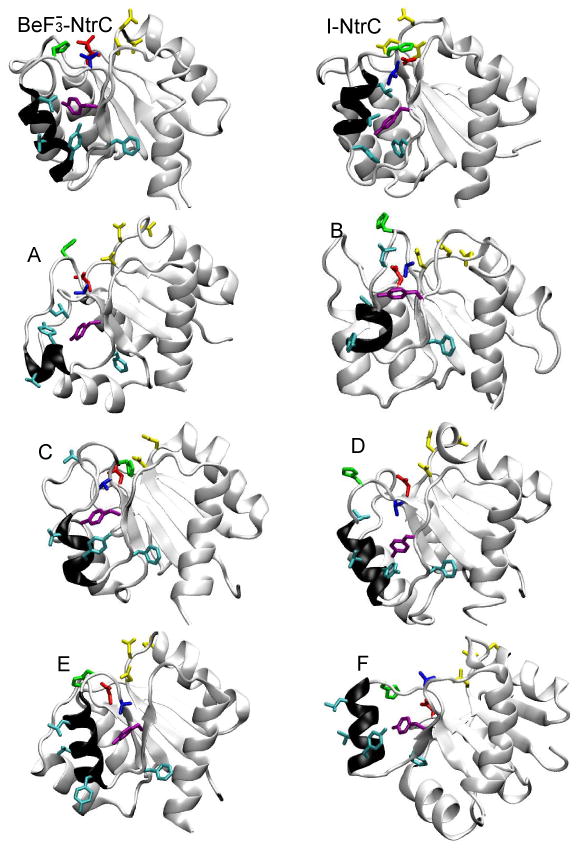
Representative snapshots from simulations with . NMR resolved structures of I-NtrCr and are also shown. The key helix, α4, is shown in black. Following color codes were used: Thr-82 (blue), Leu-87, Val-91, Tyr-94, Phe-99 (cyan), Tyr-101 (purple), Asp-54 (red), His-84 (green), and Asp-10, Asp-11, Asp-12 (yellow).
Figure 5 indicates that helices α3 and α4 are found in a variety of positions and orientations. The large movement of helix α3 in simulations A and F is particularly striking. Interestingly, in both simulations residue Phe-99 rotated toward the protein interior, into a position similar to that adopted by the inactive form. In agreement with conclusions from the analysis of the secondary structure, unfolding of large sections of helix α4 is observed in several simulations (e.g., A, B and C).
The simulations also show that some parts of the protein have adopted the inactive-like conformation but that none of the simulations exhibited a full conformational transition. Simulation A exhibited significant shifts in the positions of nearly all key residues, but not a full rotation of these residues. Although residues 94 and 99 rarely adopt the inactive-like conformation (residue 94 in 1, and residue 99 in 3 out of 50 simulation), residues 101 and 82 readily switch to the inactive-like conformation: atoms 101:OH and 90:0 come within 3.5 Å of each other during 7 th ns in 13 out of 50 simulations, while atom 82:OG1 readily rotates away from residue 54, and comes within 5 Å of atom 101:O in 9 out of 50 simulation. Analysis of trajectories from simulations with , and indicate that the sidechains of Thr-82 and Tyr-101 do not necessarily move in a correlated fashion, and that Tyr-101 can rotate into the inactive-like conformation even when Thr-82 is locked in the active-like conformation.
Comparison of simulations of three structural forms of dephosphorylated NtrCr
In the absence of the phosphate group, NtrCr spontaneously converts between the active and inactive form [9]. Therefore, none of the simulations in the absence of the phosphate groups are expected to be fully stable. Below we compare the simulations in a dephosphorylated state of the three available NMR structure, i.e., (1) I-NtrCr, (2) P-NtrCr, and (3) BeF3−-NtrCr. The comparison is based on an ensemble of 50 4 ns long simulations.
Average structural fluctuations
RMSDs and RMSFs for simulations are compared in Figure 6. Figure 6A shows the RMSDs between the initial structure and snapshots taken during the 4th ns; Figure 6B shows RMSFs of average structures of individual simulations from the ensemble average structure. Figure 6C displays the ensemble average RMSFs during the 4th ns of individual simulations.
Figure 6.
Ensemble averaged properties calculated during the 4th ns of simulations with I-NtrCr (black), P-NtrCr (blue), and (red). A) Ensemble averages RMSDs between the initial structure and simulation snapshots, B) RMSFs of average structures of individual simulations, C) Ensemble average of RMSFs of individual simulations.
As in the simulations of phosphorylated BeF3−-NtrCr, the largest RMSD and RMSF values were observed in the areas of β3-α3 loop, helix α3, β4-α4 loop, helix α4 and α4-β5 loop. Simulations of I-NtrCr showed the largest structural deviations and fluctuations around residue 60 and 61. Incidentally, the most poorly defined region in the NMR data for I-NtrCr is between residues 56 and 64 [5]. For P-NtrCr, largest fluctuations appear to be in the region around residue 64. This region too appears to be poorly defined in the NMR data [6]. Simulations of the high-resolution BeF3−-NtrCr structure show that the largest fluctuations are for residues 86 and 88, which are in the N-terminus of helix α4 and which undergoes a conformational transition. This area appears to be dynamic in NMR relaxation experiments [9].
Secondary structure changes in the ensemble
The changes in the protein's secondary structure are examined in Figure 7. The figure displays the time evolution of the average secondary structure.
Figure 7.

Percentage of total simulation time that selected residues spent in α-helical or a β-strand conformation. I-NtrCr (A), P-NtrCr (B) and (C). Equilibration run is in black, 1st ns is in blue, 2nd in green, 3rd in red and 4th in orange.
DSSP calculations on the NMR determined structure of I-NtrCr yield zero β-strand content for strands β3, β4 and β5 strands. The β-strand character of these strands gets fully or partially restored in the simulations. Strand β5 exhibits reduced β-strand character in simulations of all three structures. In the case of the inactive form this is in agreement with the NMR structure, in which strand β5 is not always well defined [5]. This strand also appears to be dynamic in NMR relaxation experiments [9].
The bell-like, rather than rectangular shape of secondary structure curves for helices in Figure 7 shows that all helices fray at both ends. In simulations with regulatory helix α4 loses helical content. This case was discussed above, and through comparison with the simulations of phosphorylated we attribute this loss to a structural transition. Helix α1 exhibits a minor loss of secondary structure in simulations of .
In simulations with P-NtrCr it is the helical content of α3 that decays. Since the structure of helix α3 differs between P-NtrCr and , this unfolding may be attributed either to the starting structure, which was not well defined in that region, or to the conformational heterogeneity of this helix in the active form. In fact, in some simulations of P-NtrCr (and to a smaller extent in simulations of ), this helix switches to a conformation similar to that observed in (or P-NtrCr).
In simulations with I-NtrCr the secondary structure content of helices α3 and α4 decreases until a converged value of about 90 % is reached. The observed loss of secondary structure could be due to the method used for secondary structure assignment, or due to the starting structure. In fact, in recent simulations with CHARMM19 force field and an implicit solvent model [14], simulations started from the NMR structures of the inactive form were observed to unfold, and this unfolding was attributed to the starting NMR structure. To investigate this further an additional set of 25 simulations was performed, started from the first structure of the NMR structural ensemble of the inactive form (PDB code 1NTR). The simulations of I-NtrCr started from this structure show no loss of secondary structure of helix α3, and only slight loss of secondary structure of helix α4 (Figure 8). The comparison of two sets of simulations of I-NtrCr in Figure 8 shows that the RMSDs and RMSFs differ slightly in absolute values, however the shape of the distribution is mostly maintained.
Figure 8.
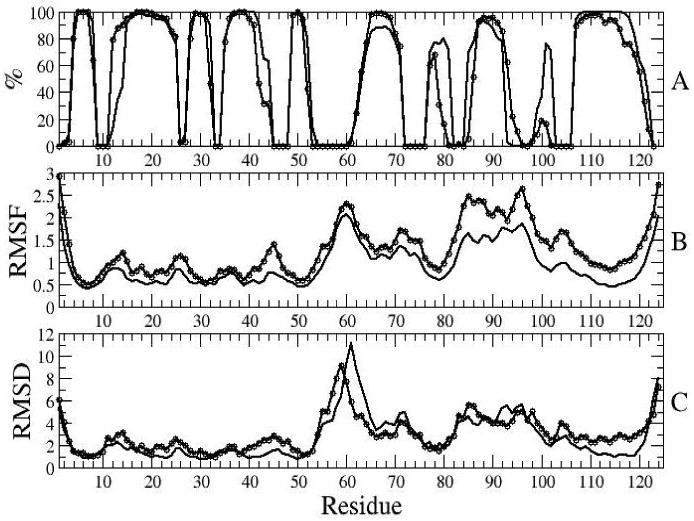
Comparison of simulations started from the average minimized NMR structure of the inactive form (1DC7, full line) with simulations started from the first structure of the ensemble of NMR structures of the inactive form (1NTR, line with circles). Average properties during 4th ns of simulation: secondary structure (A), RMSFs (B), and RMSDs from the initial structure (C).
Correlated motions
To study correlated motions within the protein we have determined the cross-correlation matrix in Equation 2. Average correlation coefficients determined for the first 4 ns of the simulations are shown in Figure 9A. The region of highly correlated motions are along the diagonal (residues i and i+0,1,2). The signature of α-helices on the map are evident as enlargements along the diagonal. β-strands appear to be strongly correlated among each other. Correlations are especially strong between strands β1 and β2, β1 and β3, β3 and β4, as well as β4 and β5. Anti-correlated motions (represented in deep blue and purple) are observed between β4 and α1, as well as between β5 and α1. All simulated forms of NtrCr share these general features. These same features are apparent from Figure 9B,C,E, which show correlation coefficients for residues 54, 82 and 101 with the rest of the protein. The motions of these three residues, located at edges or in the middle of a β-strand, are correlated with motions of other β-strands, and slightly anti-correlated with motions of helix α1.
Figure 9.
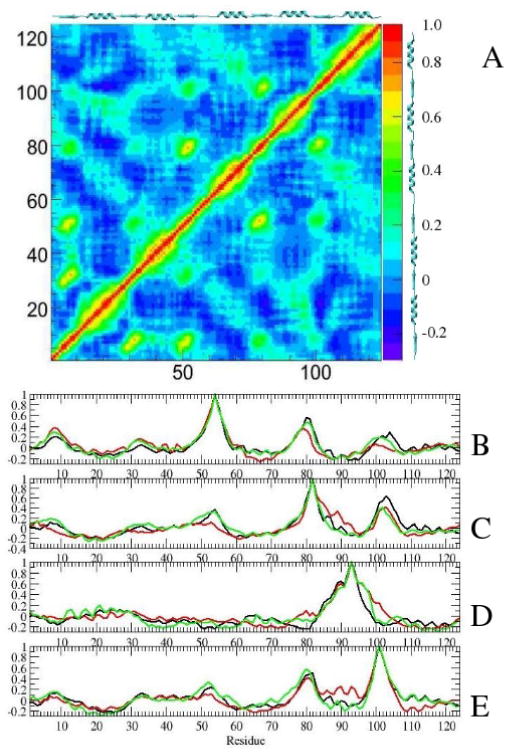
(A) Ensemble averaged correlation coefficients for simulations. Correlation coefficients for residues 54 (B), 82 (C), 93 (D), and 101 (E). Results for simulations with I-NtrCr are in black, P-NtrCr are in red, are in green.
Figure 9B-E reveals slight differences between simulated proteins. For P-NtrCr, the correlation between β-strands is slightly weaker than for other forms, while motions of residue 101 (in β5) seem to be slightly correlated with α4, and slightly anti correlated with α5.
The unfolding of the C-terminal end of helix α4 in I-NtrC is registered by loss of correlation of residue 93 (representative of helix α4) with residue 96 and 97. Also unique for I-NtrC is that the correlated motions of residues 54 and 82 with strand β5 are the largest, and extend into loop β5-α5. Interestingly, residue 83 exhibits large correlation coefficient with residues 103 and 104 (of about 0.5), larger than for other two forms (0.28 for P-NtrCr, and 0-0.1 for ). This is likely due to clumping of the Ala-83 sidechain with the hydrophobic portion of the Lys-104 sidechain, often observed in our simulations of I-NtrC. This interaction may be important for the stabilization of the inactive form.
Conclusions
The structural ensemble of the phosphorylated NtrCr, which appears to be stable in NMR relaxation experiments [9], was examined through 25 independent, 4 ns long SGLD simulations. The structural ensemble was found to be inhomogeneous in the areas of the protein that differ in the active and inactive forms. The broadness of the structural ensemble was confirmed with an independent set of 25 4 ns long MD simulations. The broad structural ensemble is not in disagreement with the structural NMR data; the RMSD values between the two available NMR structures of the active form are comparable to the RMSD values observed in SGLD and MD simulations, suggesting that multiple structures can fit the NMR data. The ensemble appears to be stable as the RMSD values do not change significantly between the 4th and the 7th ns of SGLD simulations.
Charging of His-84 in simulations of phosphorylated NtrCr results in a conformational ensemble that is closer to the berrylofluoride-activated NMR structure than the ensemble from simulations with the uncharged His-84. Calculations of pKa values suggest that phosphorylation of Asp-54 may raise the pKa value of His-84. Raising of His pKa values due to binding of a phosphate group has been observed previously, e.g., in case of binding of a phosphate ion to ribonuclease A [27].
To study the effects of dephosphorylation, simulations of phosphorylated and dephosphorylated form were compared. To gain insight into the transition process, and for a more meaningful comparison, all simulations were extended to 7 ns. In terms of RMSD values, the average position of helix α4 in simulations of the dephosphorylated form is up to 5 Å further away from the starting structure than in simulations of the phosphorylated form, and approximately half-way in between the NMR structures of the active and inactive forms. In terms of the helical content, the most striking difference between the two simulations appears to be the apparent unfolding of helix α4 in simulations of the dephosphorylated form. This suggests that the pathways of conformational transition from active to inactive states may involve partial unfolding of this helix.
The pathway for conformational transitions have recently been studied with coarse grained models [12, 11]. The study with the string method with swarms of trajectories [11] has identified a genuine transition state with a rather large free energy barrier of about 30 kcal/mol. The nature of the transition state was not described, however the existence of a single transition state likely excludes the possibility that it includes partially unfolded conformations, in contrast with our observations. We note, however, that transiently unfolded conformations would likely not be sampled with this method as the degrees of freedom involved in transient secondary structure unfolding were not included as collective variables. In another coarse grained study [12], a large barrier for the conformational transition (of about 54 kcal/mol) was also observed. The authors argue that this barrier is too high, and that the protein likely uses more sophisticated pathways including local unfolding. We agree with this assessment in that a simple estimate based on the Arrhenius equation and other corrections for a free energy barrier that would correspond to transition times in the micro-millisecond timescales is about 9-13 kcal/mol, much lower than the barriers determined in these coarse grained studies.
Loss or gain of α-helical content upon phosphorylation has been documented previously [35]. For example, in MD simulations of the N-terminal phosphorylation domain of the regulatory light chain of smooth muscle myosin, phosphorylation was shown to convert a dynamically disordered region into a stable α-helix [36]. On the other hand, in simulations of the cytoplasmic domain of the phospolamban, phosphorylation decreases α-helical content [37].
Positions of key residues (Thr-82, Val-87, Leu-91, Tyr-94, Phe-99, and Tyr-101) that adopt a different orientation between an active and inactive form were monitored in simulations of the form. Even though none of these residues exhibited significant reorientation in the average structure, several trajectories were identified in which some of the residues adopted an inactive-like conformation. Inspection of these and all other trajectories suggested that the initial conformational response to dephosphorylation occurs through multiple pathways: while some protein residues have adopted the inactive-like conformation in some simulations, other residues have not, and vice versa. Reorientation of residues 82, and 101 occurs more readily than reorientation of residues 94, and 99. The sidechains of Thr-82 and Tyr-101 do not always rotate in a correlated fashion, and Tyr-101 can rotate into the inactive-like conformation even if Thr-82 is locked in the active-like conformation. This is in agreement with a study of a structurally related protein, CheY, which has shown that a Thr residue equivalent to Thr-82 did not move significantly when a Tyr residue equivalent to Tyr-101 was rotated [38].
Finally, the simulations of different structural forms (I-NtrCr, P-NtrCr and ) in the dephosphorylated state were compared. These simulations were run for 4 ns and do not attempt to model the transition process, but simply highlight the differences and similarities of local conformational ensembles associated with the three NMR structures. All simulations reveal structural inhomogeneity in the areas that undergo a transition. However, different areas of the protein exhibit different RMSD and RMSF values in simulations of different structural forms. Large fluctuations in simulations of I-NtrCr and P-NtrCr often appear in areas that are not well resolved in NMR structures. Slight unfolding of helices α3 and α4 in simulations of I-NtrCr and P-NtrCr is attributed to starting structures rather than structural transitions. This slight unfolding may also be an artifact of the method used for secondary structure assignment. These observations emphasize the need for proper sampling and care when using NMR structures of this protein.
Supplementary Material
Acknowledgments
This research was supported in part by the Intramural Research Program of the NIH, NHLBI, and by an NIH grant (R01 GM061597) to BGME. All SGLD runs were performed on the NIH Biowulf cluster. We thank H. L. Woodcock for help with Q-Chem calculations.
References
- 1.Cohen P. The origins of protein phosphorylation. Nature Cell Biol. 2002;4:E127–E130. doi: 10.1038/ncb0502-e127. [DOI] [PubMed] [Google Scholar]
- 2.Alessi DR, Zaqiraj E. Protein phosphorylation. The Biochemist. 2007;29:20–23. [Google Scholar]
- 3.Stock JB, Ninfa AJ, Stock AM. Protein phosphorylation and regulation of adaptive responses in bacteria. Microbiological Reviews. 1989;53:450–490. doi: 10.1128/mr.53.4.450-490.1989. [DOI] [PMC free article] [PubMed] [Google Scholar]
- 4.De Carlo S, Chen B, Hoover TR, Kondrashkina E, Nogales E, Nixon BT. The structural basis of regulated assembly and function of the transcriptional activator NtrC. Genes and Devel. 2006;20:1485–1495. doi: 10.1101/gad.1418306. [DOI] [PMC free article] [PubMed] [Google Scholar]
- 5.Volkman BF, Nohaile MJ, Amy NK, Kustu S, Wemmer DE. Three-dimensional solution structure of the n-terminal receiver domain of ntrc. Biochemistry. 1995;34:1413–1424. doi: 10.1021/bi00004a036. [DOI] [PubMed] [Google Scholar]
- 6.Kern D, Volkman BF, Luginbühl P, Nohaile MJ, Kustu S, Wemmer DE. Structure of a transiently phosphorylated switch in bacterial signal transduction. Nature. 1999;402:894–898. doi: 10.1038/47273. [DOI] [PubMed] [Google Scholar]
- 7.Hastings CA, Lee SY, Cho HS, Yan D, Kustu S, Wemmer DE. High-resolution solution structure of the berrylofluoride-activated ntrc receiver domain. Biochemistry. 2003;42:9081–9090. doi: 10.1021/bi0273866. [DOI] [PubMed] [Google Scholar]
- 8.Yan D, Cho HS, Hastings CA, Igo MM, Lee SY, Pelton JG, Stewart V, Wemmer DE, Kustu S. Beryllofluoride mimics phosphorylation of ntrc and other bacterial response regulators. Proc Natl Acad Sci USA. 1999;96:14789–94. doi: 10.1073/pnas.96.26.14789. [DOI] [PMC free article] [PubMed] [Google Scholar]
- 9.Volkman BF, Lipson D, Wemmer DE, Kern D. Two-state allosteric behavior in a single-domain signaling protein. Science. 2001;291:2429–2433. doi: 10.1126/science.291.5512.2429. [DOI] [PubMed] [Google Scholar]
- 10.Elber Ron. Long-timescale simulation methods. Curr Op Struct Biol. 2005;15:151–156. doi: 10.1016/j.sbi.2005.02.004. [DOI] [PubMed] [Google Scholar]
- 11.Pan AC, Sezer D, Roux B. Finding transition pathways using the string method with swarms of trajectories. J Phys Chem B. 2008;112:3432–3440. doi: 10.1021/jp0777059. [DOI] [PMC free article] [PubMed] [Google Scholar]
- 12.Lätzer J, Shen T, Wolynes PG. Conformational switching upon phosphorylation: a predictive framework based on energy landscape principles. Biochemistry. 2008;47:2110–22. doi: 10.1021/bi701350v. [DOI] [PubMed] [Google Scholar]
- 13.Liu MS, Todd BD, Yao S, Feng ZP, Norton RS, Sadus RJ. Coarsegrained dynamics of the receiver domain of ntrc: Fluctuations, correlations and implications for allosteric cooperativity. Proteins: Struct, Func, Gen. 2008 doi: 10.1002/prot.22056. [DOI] [PubMed] [Google Scholar]
- 14.Khalili M, Wales DJ. Pathways for conformational change in nitrogen regulatory protein c from discrete path sampling. J Phys Chem B. 2008;112:2456–2465. doi: 10.1021/jp076628e. [DOI] [PubMed] [Google Scholar]
- 15.Hu X, Wang Y. Molecular dynamic simulations of the n-terminal receiver domain of ntrc reveal intrinsic conformational flexibility in the inactive state. J Biomol Struct Dyn. 2006;23:509–18. doi: 10.1080/07391102.2006.10507075. [DOI] [PubMed] [Google Scholar]
- 16.Wu XW, Brooks BR. Self-guided Langevin dynamics simulation method. Chem Phys Lett. 2003;381:512–518. [Google Scholar]
- 17.Wen EZ, Hsieh MJ, Kollman PA, Luo R. Enhanced ab initio protein folding simulations in Poisson-Boltzmann molecular dynamics with self-guiding forces. J Mol Graph Mod. 2004;22:415–424. doi: 10.1016/j.jmgm.2003.12.008. [DOI] [PubMed] [Google Scholar]
- 18.Damjanović A, Wu X, García-Moreno EB, Brooks BR. Backbone relaxation coupled to the ionization of internal groups in proteins: A self-guided langevin dynamics study. Biophys J. 2008 doi: 10.1529/biophysj.108.130906. in press. [DOI] [PMC free article] [PubMed] [Google Scholar]
- 19.Brooks Bernard R, Bruccoleri Robert E, Olafson Barry D, States David J, Swaminathan S, Karplus Martin. CHARMM: A program for macromolecular energy, minimization, and dynamics calculations. J Comp Chem. 1983;4:187–217. [Google Scholar]
- 20.MacKerell AD, Jr, Bashford D, Bellott M, Dunbrack RL, Jr, Evanseck J, Field MJ, Fischer S, Gao J, Guo H, Ha S, Joseph D, Kuchnir L, Kuczera K, Lau FTK, Mattos C, Michnick S, Ngo T, Nguyen DT, Prodhom B, Reiher IWE, Roux B, Schlenkrich M, Smith J, Stote R, Straub J, Watanabe M, Wiorkiewicz-Kuczera J, Yin D, Karplus M. All-hydrogen empirical potential for molecular modeling and dynamics studies of proteins using the CHARMM22 force field. J Phys Chem B. 1998;102:3586–3616. doi: 10.1021/jp973084f. [DOI] [PubMed] [Google Scholar]
- 21.Hoover WG. Phys Rev A. 1985;31:1695. doi: 10.1103/physreva.31.1695. [DOI] [PubMed] [Google Scholar]
- 22.Feller SE, Zhang YH, Pastor RW, Brooks BR. Constant pressure molecular dynamics simulation — the Langevin piston method. J Chem Phys. 1995;103:4613–4621. [Google Scholar]
- 23.Darden TA, York DM, Pedersen LG. Particle mesh Ewald. An N·log(N) method for Ewald sums in large systems. J Chem Phys. 1993;98:10089–10092. [Google Scholar]
- 24.Shao Yihan, Fusti-Molnar Laszlo, Jung Yousung, Kussmann Joerg, Ochsenfeld Christian, Brown Shawn T, Gilbert Andrew TB, Slipchenko Lyudmila V, Levchenko Sergey V, O'Neill Darragh P, Distasio Robert A, Lochan Rohini C, Wang Tao, Beran Gregory JO, Besley Nicholas A, Herbert John M, Lin Ching Y, Van Voorhis Troy, Chien Siu H, Sodt Alex, Steele Ryan P, Rassolov Vitaly A, Maslen Paul E, Korambath Prakashan P, Adamson Ross D, Austin Brian, Baker Jon, Byrd Edward FC, Daschel Holger, Doerksen Robert J, Dreuw Andreas, Dunietz Barry D, Dutoi Anthony D, Furlani Thomas R, Gwaltney Steven R, Heyden Andreas, Hirata So, Hsu Chao Ping, Kedziora Gary, Khalliulin Rustam Z, Klunzinger Phil, Lee Aaron M, Lee Michael S, Liang Wanzhen, Lotan Itay, Nair Nikhil, Peters Baron, Proynov Emil I, Pieniazek Piotr A, Rhee Young M, Ritchie Jim, Rosta Edina, Sherrill David C, Simmonett Andrew C, Subotnik Joseph E, Woodcock Henry L, Zhang Weimin, Bell Alexis T, Chakraborty Arup K, Chipman Daniel M, Keil Frerich J, Warshel Arieh, Hehre Warren J, Schaefer Henry F, Kong Jing, Krylov Anna I, Gill Peter MW, Head-Gordon Martin. Advances in methods and algorithms in a modern quantum chemistry program package. Phys Chem Chem Phys. 2006;8:3172–3191. doi: 10.1039/b517914a. [DOI] [PubMed] [Google Scholar]
- 25.Woodcock HL, Hodoscek M, Gilbert AT, Gill PM, Schaefer HF, Brooks BR. Interfacing q-chem and charmm to perform qm/mm reaction path calculations. J Comp Chem. 2007;28:1485–502. doi: 10.1002/jcc.20587. [DOI] [PubMed] [Google Scholar]
- 26.Davis ME, Madura JD, Luty BA, McCammon JA. Electrostatics and diffusion of molecules in solution: Simulations with the University of Houston Brownian Dynamics program. Comp Phys Comm. 1991;62:187–197. [Google Scholar]
- 27.Antosiewicz J, McCammon JA, Gilson MK. The determinants of pkas in proteins. Biochemistry. 1996;35:7819–7833. doi: 10.1021/bi9601565. [DOI] [PubMed] [Google Scholar]
- 28.Fitch CA, Karp DA, Lee KK, Stites WE, Lattman EE, García-Moreno EB. Experimental pK(a) values of buried residues: analysis with continuum methods and role of water penetration. Biophys J. 2002;82:3289–304. doi: 10.1016/s0006-3495(02)75670-1. [DOI] [PMC free article] [PubMed] [Google Scholar]
- 29.Jorgensen WJ, Tirado-Rives J. The OPLS potential functions for protein energy minimization for crystals of cyclic peptides and crambin. J Am Chem Soc. 1988;110:3469. doi: 10.1021/ja00214a001. [DOI] [PubMed] [Google Scholar]
- 30.van Vlijmen HWT, Schaefer M, Karplus M. Improving the accuracy of protein pKa calculations: conformational averaging versus the average structure. Proteins: Struct, Func, Gen. 1998;33:145–158. doi: 10.1002/(sici)1097-0134(19981101)33:2<145::aid-prot1>3.0.co;2-i. [DOI] [PubMed] [Google Scholar]
- 31.Nielsen JE, Vriend G. Optimizing the hydrogen-bond network in poisson-boltzmann equation-based pk(a) calculations. Proteins: Struct, Func, Gen. 2001;43:403–12. doi: 10.1002/prot.1053. [DOI] [PubMed] [Google Scholar]
- 32.Schutz CN, Warshel A. What are the dielectric “constants” of proteins and how to validate electrostatic models? Proteins: Struct, Func, Gen. 2002;44:400–417. doi: 10.1002/prot.1106. [DOI] [PubMed] [Google Scholar]
- 33.Kabsch W, Sander C. How good are predictions of protein secondary structure? FEBS Lett. 1983;155:179. doi: 10.1016/0014-5793(82)80597-8. [DOI] [PubMed] [Google Scholar]
- 34.Martin J, Letellier G, Marin A, Taly JF, de Brevern AG, Gibrat JF. Protein secondary structure assignment revisited: a detailed analysis of different assignment methods. BMC Structural Biology. 2005;5:1–17. doi: 10.1186/1472-6807-5-17. [DOI] [PMC free article] [PubMed] [Google Scholar]
- 35.Johnson LN, Lewis RJ. Structural basis for control by phosphorylation. Chem Rev. 2001;101:2209–2242. doi: 10.1021/cr000225s. [DOI] [PubMed] [Google Scholar]
- 36.Espinoza-Fonseca L Michel, Kast D, Thomas DD. Molecular dynamics simulations reveal a disorder-to-order transition on phosphorylation of smooth muscle myosin. Biophys J. 2007;93:2083–2090. doi: 10.1529/biophysj.106.095802. [DOI] [PMC free article] [PubMed] [Google Scholar]
- 37.Pantano S, Carafoli E. The role of phosphorylation on the structure and dynamics of phospholamban: a model from molecular simulations. Proteins: Struct, Func, Gen. 2007;66:930–40. doi: 10.1002/prot.21239. [DOI] [PubMed] [Google Scholar]
- 38.Formaneck MS, Ma L, Cui Q. Reconciling the “old” and “new” views of protein allostery: a molecular simulation study of chemotaxis y protein (chey) Proteins: Struct, Func, Gen. 2006;63:846–67. doi: 10.1002/prot.20893. [DOI] [PubMed] [Google Scholar]
- 39.Humphrey William, Dalke Andrew, Schulten Klaus. VMD – Visual Molecular Dynamics. J Mol Graphics. 1996;14:33–38. doi: 10.1016/0263-7855(96)00018-5. [DOI] [PubMed] [Google Scholar]
Associated Data
This section collects any data citations, data availability statements, or supplementary materials included in this article.