Abstract
We propose a new algorithm for obtaining proton titration curves of ionizable residues. The algorithm is a pH replica-exchange method (PHREM) which is based on the constant pH algorithm of Mongan et al. [1]. In the original replica-exchange method, simulations of different replicas are performed at different temperature, and the temperatures are exchanged between the replicas. In our pH replica-exchange method, simulations of different replicas are performed at different pH values, and the pHs are exchanged between the replicas. The PHREM was applied to a blocked amino acid and to two protein systems (Snake Cardiotoxin and Turkey Ovomucoid Third Domain), in conjunction with a generalized Born implicit solvent. The performance and accuracy of this algorithm and the original constant pH method (PHMD) were compared. For a single set of simulations at different pHs, the use of PHREM yields more accurate Hill coefficients of titratable residues. By performing multiple sets of constant pH simulations started with different initial states the accuracy of predicted pKa values and Hill coefficients obtained with PHREM and PHMD methods becomes comparable. However, the PHREM algorithm exhibits better samplings of the protonation states of titratable residues and less scatter of the titration points and thus better precision of measured pKa values and Hill coefficients. In addition, PHREM exhibits faster convergence of individual simulations than the original constant pH algorithm.
Keywords: Generalized ensemble algorithm, molecular dynamics, Monte Carlo, pKa calculation, free energy
I. INTRODUCTION
Cellular pH can have profound effects on the structure, physical properties and function of proteins and nucleic acids. In some cellular compartments, changes in pH as small as 0.1 can have physiological consequences [2]. Thus, the pH in cellular compartments needs to be tightly regulated. In spite of this tight regulation, the actual pH may vary between different cellular compartments: in vacuoles and lysosomes it is more acidic, while in the nucleus and the peroxisomes it is more basic. Some proteins, such as some viral proteins, or human hemoglobin harness the differences in cellular pH for their functions.
The subcellular pH can affect the charged state of ionizable residues in proteins, i.e., Asp, Glu, His, Lys, Cys, Tyr and Arg. The charged states of these residues can modulate the protein’s stability, solubility, enzymatic activity, interactions with small molecules or other proteins [2]. The charged state of an ionizable residue is a function of its pKa value. The pKa values of ionizable residues in proteins can be shifted significantly relative to the pKa values that ionizable residues exhibit in water. The shifts in the pKa values are caused by the removal from the aqueous environment, as well as through interactions with polar and charged groups of the protein. Sometimes, when titratable residues are near each other, such as in active sites of proteins, they can titrate in a coupled fashion. To complicate things further, titrations of internal ionizable groups are often coupled to structural relaxation of the protein [3–6].
The measurements of pKa values of functionally important ionizable residues in proteins are not always straightforward. Carefully calibrated computational methods offer a possibility of obtaining these pKa values. Some popular theoretical methods for calculations of pKa values are based on static protein structures (usually crystallographic or NMR structures) and rely on either the macroscopic description of the protein and solutions of the Poisson-Boltzmann equation [7–11], or are empirical in nature [12]. The pKa values obtained through continuum electrostatics methods are highly dependent on the choice of the protein’s dielectric constant. It has been shown that such methods cannot self-consistently reproduce the pKa values of internal groups if a single protein dielectric constant is used [13–16]. This is because proteins are heterogeneous and anisotropic and because protonation/deprotonation of internal groups can be coupled with structural transitions. Attempts to improve structure-based pKa calculations with methods that account for multiple structures are promising [17–19]. One of the problems with these approaches is that contributions related to conformational relaxation (including backbone relaxation) associated with charging or uncharging of the internal groups, is not accounted for properly. Methods that combine molecular dynamics (MD) simulations with free energy perturbation [20–22] are useful at simultaneously treating the coupling between protonation and conformational changes in a more correct way. However, within the framework of these methods, titration of only one group is performed.
To account simultaneously for the coupling between protonation, conformational transitions, and possible coupling of various ionizable groups with each other, several methods for MD simulations at a constant pH have been developed [23]. The methods for constant pH simulations fall into two categories - the discrete protonation state methods, and the continuous protonation state models. In constant pH simulations with discrete protonation states, titratable groups are modeled as either protonated or deprotonated. Molecular dynamics simulations with certain set of charges on ionizable groups are periodically intercepted with Monte Carlo (MC) trials to change the protonation states of the titratable groups. The MD simulations with new sets of charges are then continued. Several flavors of constant pH simulations with discrete protonation states were developed that use either implicit solvents [1, 24], explicit solvents [25], or a combination of explicit and implicit solvents [26]. These methods also differ in the frequency with which protonation states are updated, or in the way the free energy difference between protonated and deprotonated states are determined.
Within the framework of continuous protonation state models, titratable groups can have protonation states that can take any value in between fully protonated and deprotonated. In the method of Baptista et al. [27] MD simulations are performed with “average” charges on titratable groups (determined with continuum electrostatics) that get periodically updated during simulations. Other methods include the extended Hamiltonian approach [28], the acidostat method [29], the λ-dynamics approach [30–32].
All of the methods for constant pH simulations face a common problem: the accuracy of calculated pKa values depends on the accuracy of conformational sampling. Sampling is especially difficult for groups found in protein interiors, where water penetration can be a key determinant that is often difficult to explore in simulations [5, 33]. Protonation/deprotonation of internal ionizable groups can be accompanied by significant conformational relaxation [5, 34]. Large conformational relaxation accompanied with changes in secondary structure is not easily sampled even with standard MD methods, and additional methods for enhanced sampling, such as those based on coarse graining [35–39], smoothing protocols [40–43], generalized ensembles [44–51], optimization of actions [52], or additions of constraints or forces [53–55] need to be employed. Recently, two constant pH methods have been coupled with the temperature replica-exchange method (REM) for enhanced sampling [56, 57], while the method of Mongan et al. [1] has been coupled with accelerated molecular dynamics [58]. The methods have been shown to exhibit better accuracy than the original constant pH methods [59].
To determine the titration curves and the pKa values, simulations at several different pH values need to be performed. Often the titration curves resulting from such calculations have a large scatter when fitted with the Henderson-Hasselbalch or Hill equation. Note that for multi-site systems, the titration curves need not follow the Hill equation. Thus, fairly converged curves would be needed to identify the non-Hill behavior and distinguish it from a simple lack of sampling. To speed up and improve the convergence of titration curves, we have implemented a new method that combines constant pH simulations with replica-exchange simulations in the pH space, which we refer to as the pH replica-exchange method (PHREM). This method is based on the constant pH method by Mongan et al. [1]. The original method by Mongan et al. has been implemented in the program AMBER [60], and uses the AMBER force field. Our method has been implemented in the program CHARMM [61] and uses the CHARMM force field [62]. Another constant pH-replica exchange method, based on continuous protonation states, has been recently implemented in CHARMM [63].
II. MATERIALS AND METHODS
A. Constant pH algorithm
The constant pH algorithm is based on the method proposed by Mongan et al. [1] which employs a combination of molecular dynamics (MD) simulations with periodic Monte Carlo (MC) samplings of protonation states. We will refer to this method as PHMD. The generalized Born implicit solvent model is used to model the aqueous environment. Protein conformations are sampled with standard MD simulations. At regular intervals, trials to change the protonation state of a titratable residue are performed with an MC scheme [64].
For the MC sampling of protonation states of titratable residues at a given pH value, the free energy difference between protonated and deprotonated states (ΔF) is needed. Within this scheme ΔF is approximated by [1, 25, 26]
| (1) |
Here kB is the Boltzmann constant, T is a temperature, and pKa,w is the experimentally determined pKa value of a model compound in aqueous solution. The experimental pKa,w values that we employ are listed in Table I. ΔFele and ΔFele,w are the electrostatic components of the free energy differences between the protonated and deprotonated states of the titratable residue in the protein and of the model compound (a blocked amino acid) in aqueous solution, respectively. As discussed in more detail by Mongan et al. [1], Equation (1) is based on the division of the total transition free energy into electrostatic and non-electrostatic components. The non-electrostatic components, including the free energy of the bond between the proton and the titratable residue, and the proton solvation free energy are assumed to cancel out between the titratable residue in the protein and in aqueous solution. In the current model the electrostatic components of the free energy ΔFele,w is the difference in the electrostatic energy calculated with the charges of the current state and the charges of the proposed state. Van der Waals radii are not changed during titration.
TABLE I.
The pKa values [82, 83] and free energy differences ΔFele,w of titratable residues in aqueous solution.
| Titratable residue | pKa,w | ΔFele,w(kcal/mol) |
|---|---|---|
| Asp | 4.0 | 35.80 |
| Glu | 4.4 | 39.90 |
| His-δ | 6.5 | −18.15 |
| His-ε | 7.1 | −3.05 |
| Lys | 10.4 | −27.80 |
| Tyr | 9.6 | 84.25 |
| N-ter | 7.5 | −97.45 |
| C-ter | 3.8 | 48.90 |
In the grand canonical ensemble of protons the ratio of the protonated and deprotonated states of a titratable residue at a given pH is exp(−βΔF), where ΔF is given by Equation 1. Here, β = 1/kBT. Changes of the protonation states of the titratable residue through the Metropolis scheme [64] are carried out on the basis of this ratio. The transition probability w(d → p) from the deprotonated state to the protonated state is defined by [1, 25]
| (2) |
If the transition is accepted MD simulations are continued with the new protonation state, and if it is rejected MD simulations are continued with the old protonation state.
B. Replica exchanges in the pH space
In order to realize effective sampling of protonation states in constant pH simulations, we couple the constant pH algorithm with the REM. Let us consider M non-interacting replicas of a system, where the replica i (i = 1, ···, M) has a coordinate vector qi and a momentum vector pi at a temperature T and a pH value of pHl (l = 1, ···, M) in the grand canonical ensemble of protons. Moreover, the system has Nt titratable residues, and titratable residues are protonated in the replica i. In our new replica-exchange method, we exchange pH values between replicas instead of temperatures which are exchanged between replicas in the original REM. These exchanges are carried out so that detailed balance condition is satisfied for all exchanges. For an exchange between the replica i at pHl and the replica j at pHm, the detailed balance condition is defined by
| (3) |
where P is the equilibrium probability, , and w is the transition probability. In the grand canonical ensemble of protons, the equilibrium probability P with a kinetic energy K and a potential energy V at the temperature T is given by [65]
| (4) |
where Ξ is the grand canonical partition function. From Eqs. (3) and (4), the ratio of the transition probabilities is calculated from
| (5) |
and
| (6) |
The exchange probability is obtained as
| (7) |
Note that acceptance ratio of pH exchanges between replicas decreases exponentially with the difference of the two pH values as seen from these equations. Therefore, the pH values at which the simulations are performed must be empirically adjusted to keep sufficient acceptance ratio, for example, more than 20 %.
We remark that a change in protonation states should not be attempted when a replica exchange trial was performed in order to keep the replica-exchange Markov chain uncoupled from the constant pH Markov chain.
C. Simulation protocols
Our constant pH method was implemented within the program CHARMM [61]. The CHARMM 22 force field [62] was employed. We employed the GB/SA model [66, 67]. More details about the implicit solvent model are given in Section II E. During the constant pH MD simulations the SHAKE algorithm [68] was used to constrain bond lengths with hydrogen atoms. The time step was taken to be 1.0 fs. The temperature of 300 K was maintained with the Nosé-Hoover thermostat [69–71]. Electrostatic and vdW interactions were truncated with a switching function that starts at 16 Å and ends at 18Å.
Trials of changing protonation states were performed every 10 MD steps. Trials to exchange replicas were performed every 50 MD steps.
D. Protonation State Models
The following groups were treated as titratable in our constant pH simulations: aspartate, glutamate, histidine, lysine and tyrosine. Following Mongan et al. [1], the only difference between the protonated and deprotonated states was in the charge distributions. The bonded and van der Waals parameters are those corresponding to the protonated species. Thus, even in the deprotonated state the groups contain a hydrogen atom which has a van der Waals radius of the protonated species, and a non-zero mass. Mongan et al. [1] discussed this approximation in their original constant pH paper and argued that this approximation does not substantially affect the results. However, in the future we will replace this model with a more realistic model in which van der Waals radii and mass are changed as well. The charges of the titratable residue atoms in the protonated and deprotonated states were taken from Ref. [30] for the CHARMM 22 parameter set.
E. GB/SA model
We employed the GB/SA model [66, 67] as the implicit solvent model for our simulations. In the GB/SA model, the total solvation free energy Gsolv is given by the sum of a generalized-Born term GGB and a solvent accessible surface area term GSA:
| (8) |
The generalized-Born term GGB is defined by
| (9) |
where εs is the dielectric constant of bulk water (we took εs = 80.0), Qi is the partial charge of the atom i, rij is the distance between the atoms i and j, , αi is the so-called Born radius of the atom i, and . The Born radii were calculated from the GB molecular volume method (GBMV2) [72]. The solvent accessible surface area term GSA is defined by
| (10) |
where Ak is the total solvent-accessible surface area of the atom k and σk is an empirically determined proportionality constant, which was taken to be 20.0 cal/mol/Å2 as suggested in [30].
F. Calculation of ΔFele,w
To perform constant pH simulations the free energy differences ΔFele,w in Eq. (1) of reference compounds need to be provided. As the reference compounds we employed amino acids, Asp, Glu, His, Lys, and Tyr with their N-termini and C-termini blocked by the acetyl groups and the N-methyl groups, respectively. The free energy differences ΔFele,w were determined following procedure in Ref. [1]; constant pH simulations were performed for 2.5 ns after the equilibration of 0.5 ns for an arbitrary value of ΔFele,w. In an iterative fashion, ΔFele,w was adjusted until the populations of the protonated and deprotonated states obtained at pH = pKa,w were equal. For all of the reference compounds we list the calculated free energy differences ΔFele,w at T=300 K in Table I.
In constant pH simulations of the reference compound only one group is titrated. Thus, the values of ΔFele,w obtained through the constant pH simulations should coincide with the results obtained from thermodynamic integration (TI):
| (11) |
Here λ is the coupling parameter between the protonated and deprotonated states of the titratable residue, and Vele is the electrostatic potential energy. When the electrostatic potential energies of the protonated and the deprotonation state are described by Vele,p and Vele,d, respectively, the potential energy Vele (λ) can be defined as
| (12) |
We evaluated the free energy difference ΔFele,w in Eq. (11) for all titratable residues by performing REM simulations in the λ space for 3.0 ns including 0.5 ns equilibration. The number of replicas was 8 with equal increments 1/7 of λ. Trials of replica exchanges were carried out every 500 fs. The free energy differences ΔFele,w calculated from Eq. (11) were in good agreement with those calculated from the adjusting process for all of the titratable residues. The largest observed difference between the two free energy differences was less than 0.15 kcal/mol.
III. RESULTS AND DISCUSSION
A. Blocked aspartic acid
As the first model system for testing the performance and accuracy of PHREM we use the blocked aspartic acid. We compared results of simulations with the original method, PHMD, with those obtained with PHREM. For PHREM simulations we used 8 replicas at pH values ranging from 1 to 8 in increments of 1. The PHMD simulations were also performed at pH values ranging from 1 to 8 with an increment of 1. All simulations were carried out for 4.5 ns after the equilibration of 0.5 ns.
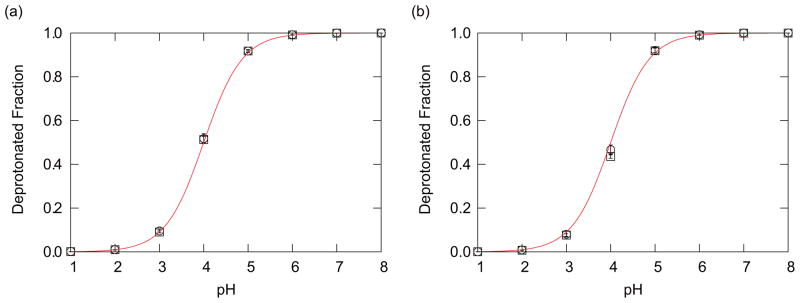
Figure 1 shows the deprotonated fraction of the titratable residue Asp at 300 K obtained from the PHMD and PHREM simulations. Two different initial conformations of the Asp system were employed. For each initial conformation the PHMD and PHREM simulations were performed. Red lines in this figure are titration curves based on the Henderson-Hasselbalch (HH) equation, and these curves are expressed by
FIG. 1.
(a) The deprotonated fractions of the blocked Asp residue obtained from the PHREM simulations. (b) The deprotonated fractions of the blocked Asp residue obtained from the PHMD simulations. Open circle and square show the results of two different initial conformations. The error bars were calculated by the jackknife method [84–86]. The number of bins was taken to be 8 for the jackknife method. See Ref. [86] for more details on the jackknife method. The red solid lines are the deprotonated fractions fd in Eq. (13).
| (13) |
where fd is the deprotonated fraction of the titratable residue and for an Asp residue pKa = 4.0 (Table I).
This equation is valid as long as the titratable group interacts negligibly with other titratable groups. For the case of a single titratable residue this is fulfilled. By comparing the simulation results with this equation we can evaluate the accuracy of the calculations. Figure 1 indicates that deprotonated fractions obtained with both the PHMD and PHREM simulations agree well with this equation. Thus, for simple systems such as a single titratable residue in aqueous solution accurate results can be obtained even without the use of PHREM.
For a titratable group that has no interaction or weak interactions with other titratable groups, the pKa can be calculated from constant pH MD simulations by rewriting the equation (13) as follows:
| (14) |
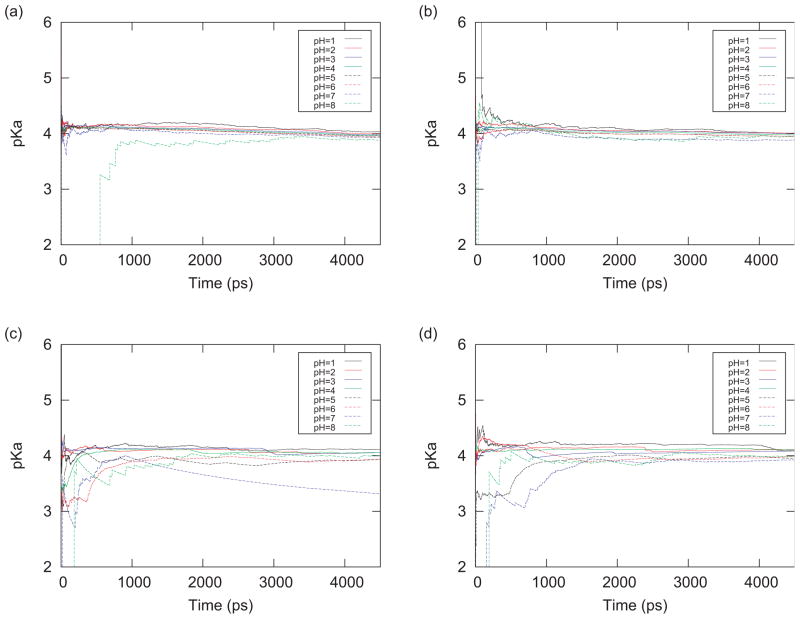
Here fd(t) represents the deprotonated fraction obtained as an average from time 0 to the time t, and the pKa(t) is the corresponding time series of pKa values. pKa(t) was calculated from the deprotonated fractions fd(t) for each pH value according to Eq. (14). pH dependent pKa(t) values for the blocked Asp residue are for each initial conformation shown in Fig. 2. The predicted pKa values obtained from the deprotonated fractions at pH values that were far from 4.0 were converging more slowly. This is because the frequency of changing the protonation state is smaller when the pH of the system is farther from the pKa value, and it is difficult to sample changes of the protonation states sufficiently. Figure 2 shows that the pKa values obtained with the PHREM simulations were converging faster than those obtained with the PHMD simulations, suggesting that PHREM provides more effective sampling of the protonation states than PHMD.
FIG. 2.
(a), (b) The time series of the pKa values for the blocked Asp residue obtained with PHREM. The difference between (a) and (b) is the initial states. (c), (d) The time series of the pKa values for the blocked Asp residue obtained with the PHMD simulations. The difference between (c) and (d) is the initial states.
Figure 2(c) indicates that the pKa value obtained with the PHMD simulation at pH = 7.0 was shifted from 4.0. This is because the proton of the Asp residue became trapped in the anti location. This is an artifact caused by the fact that the zero charge “ghost” proton was employed to describe the deprotonated state. Because it has zero charge, this “ghost” proton can more easily become trapped in some conformations. In the protonated state, the syn conformation is much more favorable than the anti conformation. However, if the proton gets trapped in the anti conformation, the deprotonated state appears to be more favorable than the protonated state. In the PHREM simulations, however, Asp readily escaped from the anti conformation due to pH exchanges between replicas, shortening the convergence times.
B. Snake Cardiotoxin
We employed cardiotoxin V from Naja naja atra (CTX A5) to test the PHREM algorithm. CTX A5 has 62 residues and only four ionizable residues, His4, Glu17, Asp42, and Asp59. The pKa values of these residues are available experimentally [73, 74]. To increase conformational sampling, and to test the accuracy of the simulations we generated six initial conformations, labeled IC1-6. These initial conformations were generated starting from the pdb structure in the 1CVO PDB file [75]. To generate conformations IC1-6, six different seed numbers were used to assign initial velocities during the heating process. The heating to the temperature of 300 K was 100 ps long. The PHMD and PHREM simulations were 3 ns long including 0.5 ns equilibration for each initial conformation. The simulations were performed at 16 different pH values which ranged from 1.0 to 8.5 with an increment of 0.5.
The predicted pKa values and experimental pKa values of the four ionizable residues are listed in Table II. The pKa values were calculated through the fitting of the deprotonated fractions to the Hill equation:
| (15) |
where nH is the Hill coefficient. The pKa values and Hill coefficients in Table II were obtained through the following averaging methods:
TABLE II.
pKa values and Hill coefficients of ionizable residues in CTX A5.
| pKa | Hill coefficient | |||||
|---|---|---|---|---|---|---|
| Titratable residue | PHREM1 | PHMD2 | Expt. | PHREM1 | PHMD2 | Expt. |
| His4 | 4.5 (0.5) | 4.7 (0.5) | 5.6 | 1.02 (0.16) | 1.20 (0.81) | - |
| 4.5 (0.5) | 4.6 (0.5) | 0.81 (0.26) | 0.60 (1.01) | |||
| 4.5 (0.1) | 4.7 (0.1) | 0.87 (0.07) | 0.75 (0.07) | |||
| Glu17 | 3.8 (0.2) | 3.9 (0.3) | 4.0 | 0.93 (0.11) | 0.99 (0.27) | - |
| 3.8 (0.2) | 3.9 (0.3) | 0.87 (0.12) | 0.87 (0.30) | |||
| 3.8 (0.1) | 3.9 (0.1) | 0.89 (0.07) | 0.91 (0.07) | |||
| Asp42 | 2.3 (0.7) | 1.0 (1.9) | 3.2 | 0.89 (0.23) | 2.76 (3.39) | - |
| 2.3 (0.7) | 1.8 (2.0) | 0.64 (0.34) | 0.60 (4.02) | |||
| 2.3 (0.2) | 1.8 (0.2) | 0.62 (0.06) | 0.64 (0.12) | |||
| Asp59 | 1.3 (0.7) | 1.0 (1.3) | <2.3 | 0.92 (0.22) | 2.80 (2.60) | - |
| 1.3 (0.7) | 1.4 (1.4) | 0.64 (0.36) | 0.72 (3.33) | |||
| 1.4 (0.2) | 1.4 (0.3) | 0.68 (0.11) | 0.73 (0.11) | |||
Results obtained from the PHREM simulations.
Results obtained from the PHMD simulations.
Upper, middle and lower values for each residue are calculated with Method I, Method II and Method III, respectively. Estimated errors are indicated in the brackets.
Method I: The fittings were performed separately for each simulation (IC1-6), and the averages of the six pKa values and of six Hill coefficients were taken to be the predicted values. The physical meaning of the averages obtained with Method I are the most probable pKa values and Hill coefficients that would be obtained from a single set of short MD simulation performed at different pH values.
Method II: The deprotonated fractions were averaged over the six constant pH simulations (IC1-6). The fittings were performed based on the averaged deprotonated fractions, and pKa values and Hill coefficients determined only once. This approach corresponds more closely to the titration experiments which effectively measure the ensemble averaged deprotonated fractions. We note that with Method II, the statistical errors of the deprotonated fractions are not taken into account during the fitting procedure. The Newton’s method was employed to perform non-linear least square fitting for Method I and Method II.
Method III: this method is the same as Method II, however, the statistical errors of the deprotonated fractions (based on the six simulations, IC1-6) are taken into account during the fitting procedure. If the error was smaller than 0.01, we set the error to 0.01. This is due to the fact that the systematic errors due to uncertainties in the forcefield, approximations in the method, and possibly insufficient sampling are not accounted for. The uncertainties in the errors are the reason why we present both Method II and Method III. Method II will give equal statistical weight to all points, while Method III will weight them according to the error. To fit the data points in Method III, χ2 that takes into account errors on each data points is minimized with respect to fit parameters pKa and nH using the gradient search method implemented in package ROOT [76].
For Method I, we determined the root-mean-square deviation of pKa values and Hill coefficients
| (16) |
Here, Ai is a pKa value or a Hill coefficient obtained from a single set of simulations, and Ā is the average of Ai, determined with method I. For Method II, as a measurement of the scattering of pKa values and Hill coefficients we determines the modified root-mean-square deviation
| (17) |
Here, Ā′ is the pKa value or Hill coefficient determined with Method II. Ais are the same as in Eq. 16. With Method III the errors on the fit parameters are computed using the parabolic approximation from the shape of the χ2 [77]. The root-mean-square deviations of individual pKa values and of Hill coefficients obtained with Method I and Method II, as well as the errors obtained with Method III are given in Table II.
The pKa values of His4, Glu17 and Asp59 obtained with the two constant pH methods were within 0.3 pH units of each other. The difference of the pKa value of Asp42 obtained with the two constant pH methods was larger than in other residues. The pKa value obtained with the PHREM simulations was closer to the experimental value than the pKa obtained with the PHMD simulations. For Method I, the Hill coefficients obtained with the two methods were close to each other for His4 and Glu17, but differed considerably for Asp42 and Asp59. On the other hand, the differences of the calculated Hill coefficients were not large when Method II and Method III were used, suggesting that the averaging method used does impact on the results.
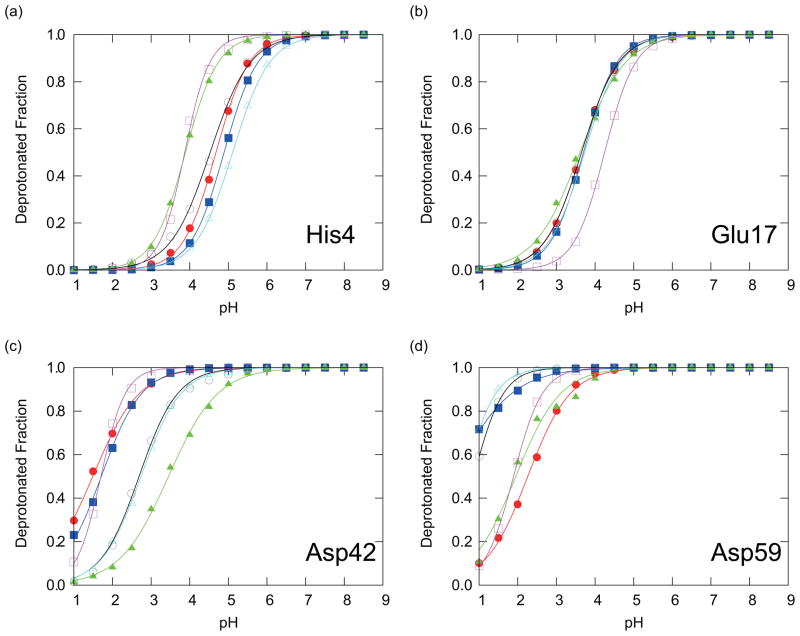
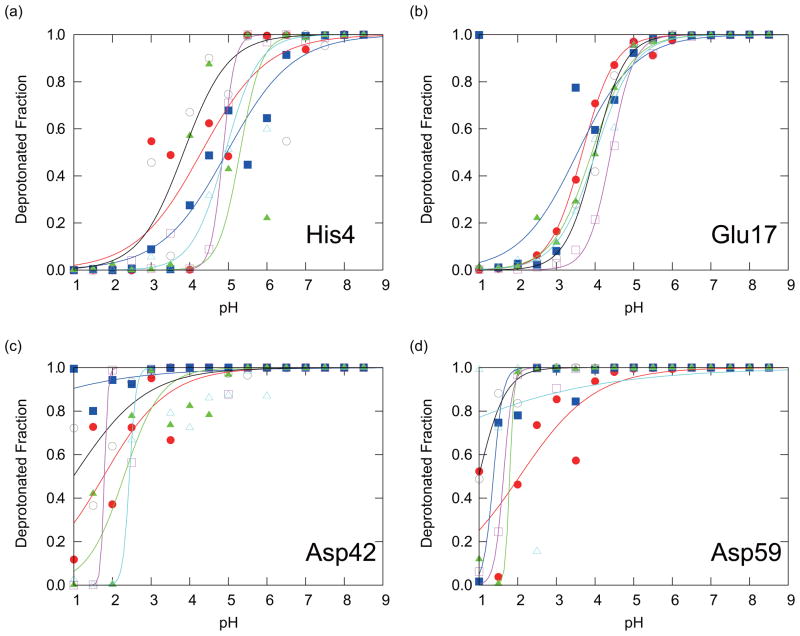
The titration curves obtained from individual PHREM and PHMD simulations (Method I) are shown in Figs. 3 and 4, respectively. For the PHMD simulations, both the individual data points as well as the fitting curves exhibit more scatter than the PHREM data points and the fitting curves, suggesting a better convergence of the data obtained with the PHREM method. Table II is also showing that pKa values and Hill coefficients obtained from the PHMD simulations had larger scatter than those obtained with PHREM. For the PHREM simulations the deprotonated fractions exhibit very small or no noticeable scatter from the fitting curves in Fig. 3 suggesting an excellent convergence of individual simulations. However, for three of the four titratable residues, the fitting curves that correspond to different initial conformations are shifted from each other. This suggests that global convergence is not achieved, and that the results are dependent on the initial conformation. Therefore, more accurate results will be expected through additional sampling, possibly through the coupling of PHREM with other methods that increase conformational sampling such as the self-guided Langevin dynamics method, or the temperature REM.
FIG. 3.
The deprotonated fractions of titratable residues in CTX A5: (a) His4, (b) Glu17, (c) Asp42, and (d) Asp59, obtained with the PHREM simulations. Red circles, blue squares, green triangles, black open circles, magenta open squares, and cyan open triangles are showing the results with IC1-6, respectively. The solid lines of the corresponding colors are the fitting curves to Eq. (15) for the results with IC1-6, respectively.
FIG. 4.
The deprotonated fractions of titratable residues in CTX A5: (a) His4, (b) Glu17, (c) Asp42, and (d) Asp59, obtained with the PHMD simulations. Red circles, blue squares, green triangles, black open circles, magenta open squares, and cyan open triangles are showing the results with IC1-6, respectively. The solid lines of the corresponding colors are the fitting curves to Eq. (15) for the results with IC1-6, respectively.
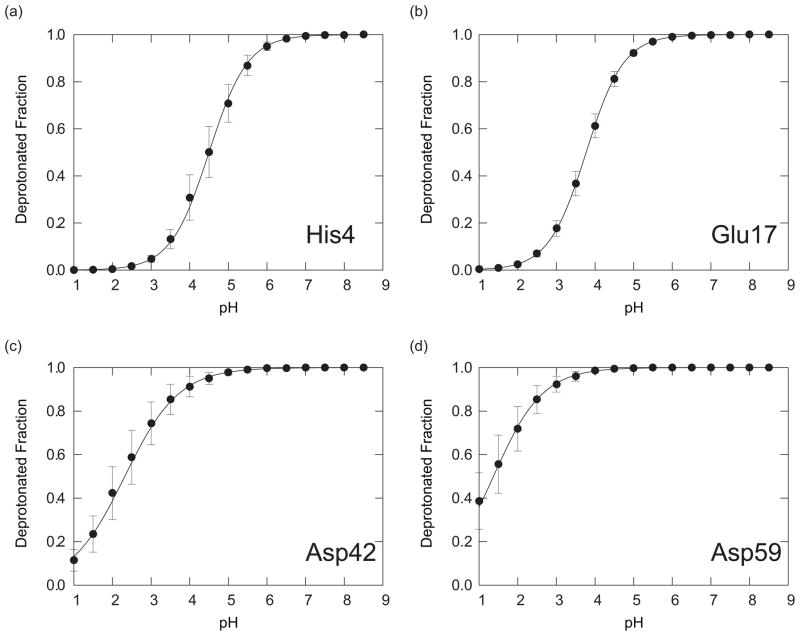
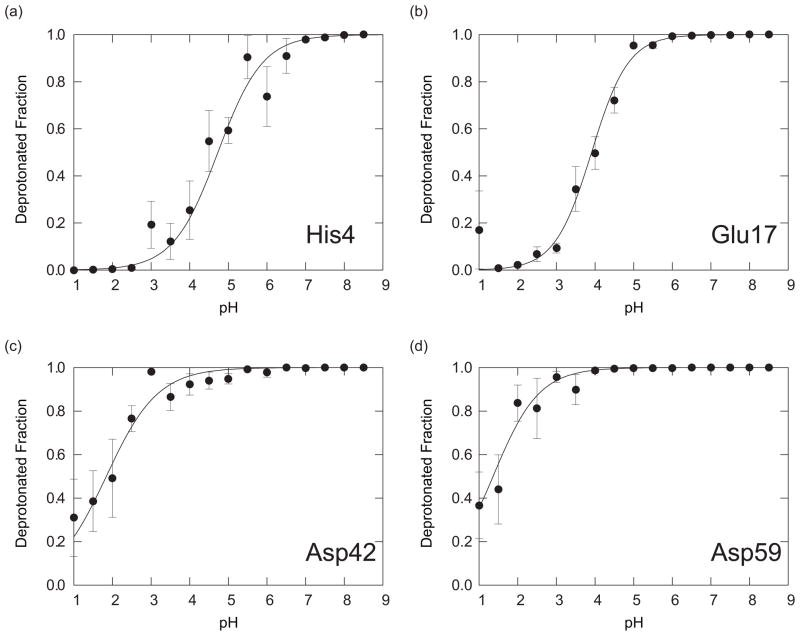
Titration curves obtained with Method III are shown in Figs. 5 and 6. The data points obtained with PHREM method are in much better agreement with the fitting function, than the data points obtained with the PHMD simulations. The χ2 values, which are a measure of the dispersion of the data points are much smaller for PHREM simulations than for PHMD simulations.
FIG. 5.
The deprotonated fractions, averaged over simulations IC1-6, of titratable residues in CTX A5: (a) His4, (b) Glu17, (c) Asp42, and (d) Asp59, obtained with the PHREM simulations. The solid line is the fitting curve to Eq. (15).
FIG. 6.
The deprotonated fractions, averaged over simulations IC1-6, of titratable residues in CTX A5: (a) His4, (b) Glu17, (c) Asp42, and (d) Asp59, obtained with the PHMD simulations. The solid line is the fitting curve to Eq. (15).
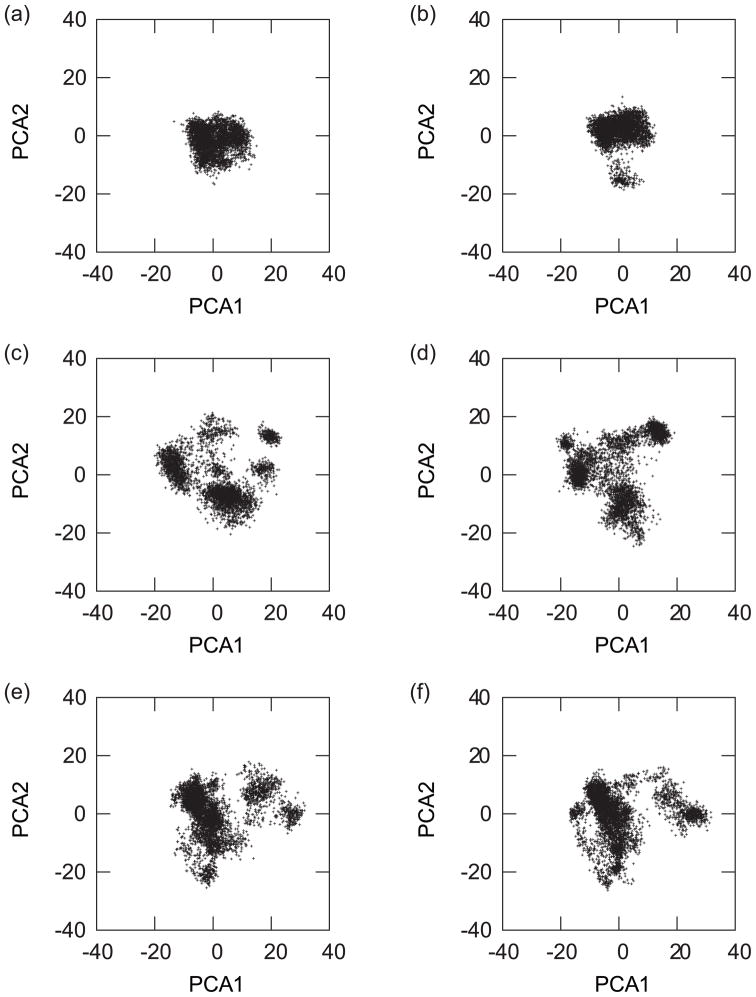
One may ask whether the smoothness of the individual titration curves obtained with the PHREM method in Figs. 3 and 5 is due to the strong coupling between the replicas which could end up keeping them confined to the same conformational region. In order to investigate this, the principle component analysis (PCA) [78] was employed. This PCA was performed with respect to the Cα atoms in CTX A5 as follows: First, all structures (Cα atoms) in the trajectory of the PHREM and PHMD simulations starting from the same IC were superposed by the rigid translations and rigid rotations on the IC. This superposition was performed to remove the translational and rotational degrees of freedom. From these superposed structures, the variance-covariance matrix Sij was calculated. This variance-covariance matrix Sij is given by
| (18) |
where qi is the coordinate of the Cα atoms. The Sij matrix was determined based on structures resulting from 2.5 ns long simulations at all 16 pH values, for IC1, and for IC2. We also performed the same analysis on structures taken during all of the simulations, i.e., 2.5 ns long simulations at all 16 pH values and for all ICs. For this latest analysis, the structure used for the alignment was the IC1 structure. The first and second principal component axes were defined as the eigenvectors with the largest and second-largest eigenvalues, respectively. The ith principal component of a structure is the inner product of ith eigenvectors and coordinate vector (qi − 〈qi〉). In Figure 7 we show the distributions of the first and second principal components in the PHREM and PHMD simulations starting from IC1 and IC2 as well as for all ICs. The figure suggests that the PHREM and the PHMD methods have the same effectiveness of conformational samplings.
FIG. 7.
The distributions of the first and second principal components in the PHREM simulations from (a) IC1, (c) IC2, (e) all ICs. The distributions of the first and second principal component in the PHMD simulations from (b) IC1, (d) IC2, (e) all ICs. The abscissa and ordinate axes are the first and second principal component axes, respectively.
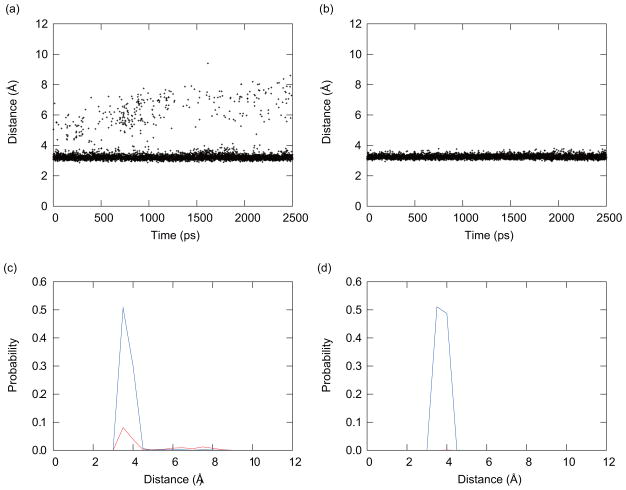
To investigate this issue further, we look in detail into the coupling between conformations and protonation states of one of the titratable residues in PHMD and PHREM simulations. We take an example of His4 at pH = 4.0. The deprotonated fraction of His4 at pH = 4.0 obtained from the PHMD simulation with IC1 was almost zero, as shown in Fig. 4(a). The time series of the distances between the C atom of C-terminus and the Nδ atom of His4 is shown (Fig. 8). In simulations with the PHMD at pH = 4.0, and with the initial conformation IC1, this distance was approximately 3.3 Å. Because the C-terminus is negatively charged, the probability of deprotonation of His4 was small, and the protonation state was fixed to the protonated form. This in turn resulted in favoring of conformations with short distances between these two atoms. In the PHREM simulation at pH = 4.0 with IC1, due to the ability to exchange conformations with replicas simulated at other pH values, the distance between these two atoms varied, as shown in Fig. 8(a). When the distance was larger than 6.0 Å, the deprotonated form was favored as shown in Fig. 8(c). This in turn allowed His4 to sample the deprotonated states even at distances of 3.3 Å. Figures 8(c) and (d) thus clearly demonstrate how replica-exchange methodology can increase the efficiency of sampling of protonation and conformational states for a given pH value. This increase in sampling results in smoother titration curves in Fig. 3.
FIG. 8.
The time series of the distance between the C atom of the C-terminus and the Nδ atom of His4. These results were obtained from (a) the PHREM simulation and (b) the PHMD simulation at pH = 4.0 with IC1. Probability distributions of the distances with protonated states (blue solid line) and deprotonated states (red solid line). These results were estimated from (c) the PHREM simulation and (d) the PHMD simulation at pH = 4.0 with IC1.
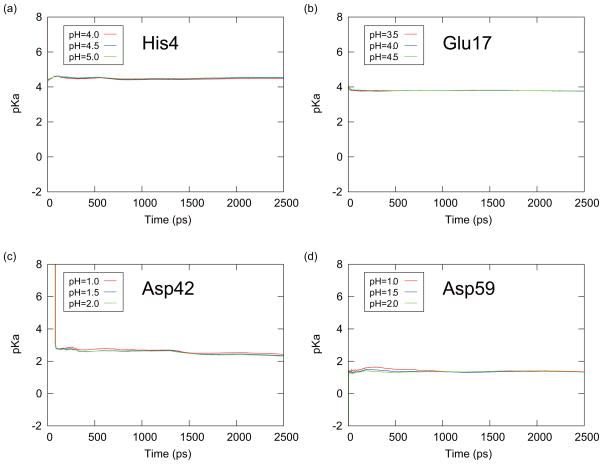
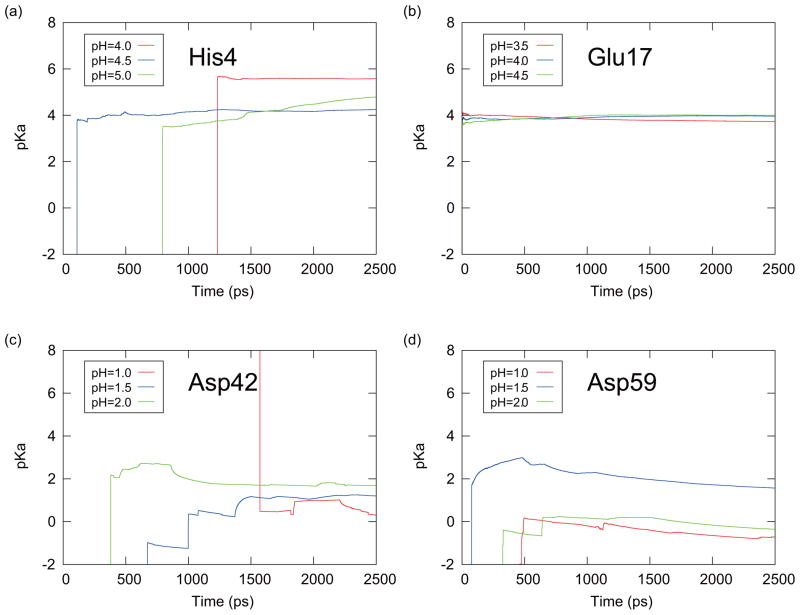
To estimate the speed of convergence of simulations we examined the time series of the average of the predicted pKa values for the titratable residues of CTX A5 in Figs. 9 and 10. From Eq. (15), the predicted pKa values are given by
FIG. 9.
The time series of the predicted pKa values obtained with the averaging Method I for (a) His4, (b) Glu17, (c) Asp42, and (d) Asp59 of CTX A5. These results were obtained from the PHREM simulations at the pH values which were specified in the small windows around the pKa values.
FIG. 10.
The time series of the predicted pKa values obtained with the averaging Method I for (a) His4, (b) Glu17, (c) Asp42, and (d) Asp59 of CTX A5. These results were obtained from the PHMD simulations at the pH values which were specified in the small windows around the pKa values.
| (19) |
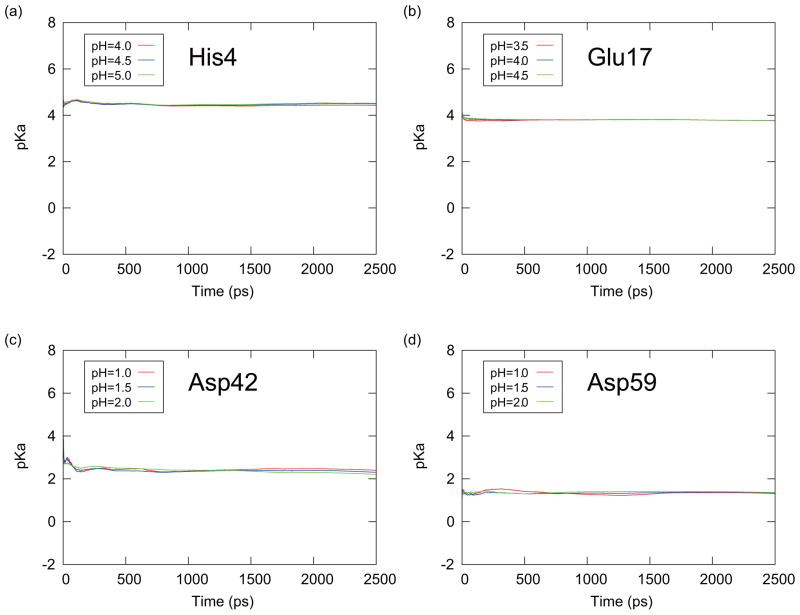
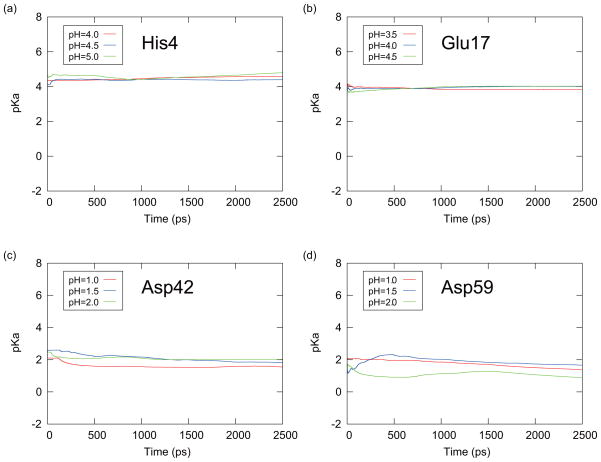
From this equation, pKa(t) is obtained from the averaged deprotonated fraction (fd(t)) from 0 to the time t at the corresponding pH value for each initial conformation. Each Hill coefficient nH in Eq. (19) was estimated from the entire 2.5 ns simulation. The predicted pKa(t) values were then averaged over six PHREM/PHMD simulations started with the six initial conformations (averaging Method I). Figures 9 and 10 are showing the results from the PHREM simulations and the PHMD simulations, respectively, with the averaging Method I. If Method II was used to perform the averaging, the pKa(t) values are shown in Figures 11 and 12 for the PHREM simulations and the PHMD simulations, respectively. We employed pH values 4.0–5.0 for His4, 3.5–4.5 for Glu17, 1.0–2.0 for Asp42, and 1.0–2.0 for Asp59 in these figures. These pH values are in the neighborhood of the predicted pKa values obtained from the PHREM and PHMD simulations (see Table II), and thus the sampling of both protonation states is high. Accurate pKa values could not be obtained from simulations at pH values which were far from the pKa value, because the protonation states rarely changed.
FIG. 11.
The time series of the predicted pKa values obtained with the averaging Method II for (a) His4, (b) Glu17, (c) Asp42, and (d) Asp59 of CTX A5. These results were obtained from the PHREM simulations at the pH values which were specified in the small windows around the pKa values.
FIG. 12.
The time series of the predicted pKa values obtained with the averaging method II for (a) His4, (b) Glu17, (c) Asp42, and (d) Asp59 of CTX A5. These results were obtained from the PHMD simulations at the pH values which were specified in the small windows around the pKa values.
Figs. 9 and 10 show that the pKa values obtained from individual simulations with PHREM for all titratable residues of CTX A5 converged faster than those obtained with the PHMD simulations. Moreover, the predicted pKa values obtained from the PHREM simulations at different pH values coincide, suggesting that the sampling in the pH space has converged. If Method II was used for averaging (Figs. 11 and 12), the pKa values appear to converge faster than with method I, however, the predicted pKa values obtained at different pH values still do not coincide, especially in case of Asp42 and Asp59.
C. Turkey ovomucoid third domain
We employed turkey ovomucoid third domain (OMTKY3) to compare PHREM with PHMD for a more complicated system. OMTKY3 has thirteen ionizable residues, and both the pKa values and the Hill coefficients of these ionizable residues are available experimentally [79, 80]. We performed constant pH MD simulations in two pH regions, the low pH region and the high pH region. The division into two regions is not necessary, however, by using two pH regions the number of required replicas in the PHREM simulation can be cut in half. However, two PHREM simulations, one for each pH region need to be performed. The following residues were modeled as titratable in the simulations in the low pH region: Asp7, Glu10, Glu19, Asp27, Glu42, His52, as well as the N-terminus and the C-terminus. All of the basic residues were fixed to the protonated states during these simulations. In the simulations in the high pH region, the following residues were modeled as titratable: Tyr11, Lys13, Tyr20, Lys29, Tyr31, Lys34, and Lys55, His52 as well as the N-terminus. The protonation states of the acidic residues were fixed to the deprotonated states during these simulations. Six initial conformations were prepared for PHREM and PHMD simulations in each pH region. These were obtained by equilibrating the model 1 structure in the 1OMT PDB file [81] for 100 ps at 300 K with different initial velocities. Additional simulation details were as described in the Methods section.
Both the PHREM and PHMD simulations were run for 3.0 ns including 0.5 ns equilibration. In the low pH region, the PHREM and PHMD simulations were carried out at 16 different pH values which ranged from 1.0 to 8.5 with an increment of 0.5 for each of the six initial conformations. In the high pH region, the PHREM and PHMD simulations were carried out at 16 different pH values which ranged from 6.0 to 13.5 with an increment of 0.5.
The predicted and experimental pKa values and Hill coefficients of the ionizable residues in the low pH region and the high pH region are shown in tables III and IV, respectively. Results with Method I, Method II and Method III for calculation of the pKa values and Hill coefficients are shown. The pKa values and Hill coefficients predicted for OMTKY3 displayed the same trends as the pKa values and Hill coefficients predicted in the case of CTX A5; for most residues the difference between the predicted pKa values obtained from the PHREM and PHMD simulations were small, i.e., mostly less than 0.3 pKa units with the three averaging methods. The largest observed difference was for Lys13 (0.4 pKa units) with Method III. For some residues, the Hill coefficients predicted with Method I differed substantially between PHMD and PHREM methods, while the Hill coefficients predicted with Method II and Method III were comparable between PHMD and PHREM. However, the Hill coefficients obtained from the PHMD simulations had larger scatter compared to those obtained with the PHREM simulations. This is due to the fact that individual simulations are better converged with PHREM than with PHMD. We note that the pKa value for Tyr31 could not be estimated because the residue titrated outside the high pH region. The same was true for Tyr11, but only for the PHMD simulations.
TABLE III.
pKa values and Hill coefficients of titratable residues in OMTKY3 in the low pH region.
| pKa | Hill coefficient | |||||
|---|---|---|---|---|---|---|
| Titratable residue | PHREM | PHMD | Expt. | PHREM | PHMD | Expt. |
| NT-Leu | .0 (0.4) | 77.2 (0.5) | 8.0 | 0.96 (0.09) | 1.45 (1.05) | 0.88 |
| 7.0 (0.4) | 7.1 (0.5) | 0.83 (0.16) | 0.79 (1.24) | |||
| 7.0 (0.1) | 7.1 (0.1) | 0.84 (0.08) | 0.99 (0.15) | |||
| Asp7 | 3.3 (0.4) | 3.2 (0.6) | ≤2.7 | 0.89 (0.15) | 1.04 (0.52) | 0.72 |
| 3.3 (0.4) | 3.2 (0.6) | 0.74 (0.21) | 0.67 (0.64) | |||
| 3.3 (0.1) | 3.3 (0.2) | 0.82 (0.06) | 0.88 (0.11) | |||
| Glu10 | 3.8 (0.2) | 3.7 (0.2) | 4.2 | 0.80 (0.15) | 1.28 (1.13) | 0.92 |
| 3.8 (0.2) | 3.7 (0.2) | 0.75 (0.16) | 0.82 (1.22) | |||
| 3.7 (0.1) | 3.8 (0.1) | 0.78 (0.06) | 0.81 (0.09) | |||
| Glu19 | 2.7 (0.8) | 2.4 (1.0) | 3.2 | 1.01 (0.11) | 3.14 (2.54) | 1.08 |
| 2.6 (0.8) | 2.3 (1.0) | 0.65 (0.38) | 0.49 (3.67) | |||
| 2.7 (0.1) | 2.4 (0.3) | 0.70 (0.06) | 0.57 (0.07) | |||
| Asp27 | 4.6 (0.3) | 4.8 (0.7) | ≤2.3 | 0.90 (0.27) | 2.14 (3.49) | 0.85 |
| 4.5 (0.3) | 4.8 (0.7) | 0.75 (0.30) | 0.54 (3.84) | |||
| 4.7 (0.1) | 4.9 (0.3) | 0.71 (0.06) | 0.88 (0.16) | |||
| Glu43 | 5.4 (0.2) | 5.3 (0.1) | 4.8 | 0.91 (0.09) | 0.94 (0.24) | 0.95 |
| 5.4 (0.2) | 5.3 (0.1) | 0.87 (0.10) | 0.87 (0.25) | |||
| 5.4 (0.9) | 5.4 (0.9) | 0.88 (0.07) | 0.91 (0.07) | |||
| His52 | 7.2 (0.7) | 7.5 (0.9) | 7.5 | 0.95 (0.06) | 1.30 (0.69) | 0.93 |
| 7.3 (0.7) | 7.4 (0.9) | 0.68 (0.28) | 0.68 (0.93) | |||
| 7.2 (0.2) | 7.4 (0.2) | 0.67 (0.08) | 0.72 (0.16) | |||
| CT-Cys | 2.9 (0.2) | 3.0 (0.1) | ≤2.5 | 0.96 (0.12) | 0.91 (0.14) | 0.87 |
| 2.9 (0.2) | 3.0 (0.1) | 0.90 (0.13) | 0.87 (0.15) | |||
| 3.0 (0.1) | 3.1 (0.1) | 0.88 (0.07) | 0.89 (0.08) | |||
Upper, middle and lower values for each residue are calculated with Method I, Method II and Method III, respectively. Estimated errors are indicated in the brackets.
TABLE IV.
pKa values and Hill coefficients of titratable residues in OMTKY3 in the high pH region.
| pKa | Hill coefficient | |||||
|---|---|---|---|---|---|---|
| Titratable residue | PHREM | PHMD | Expt. | PHREM | PHMD | Expt. |
| NT-Leu | 6.7 (0.4) | 6.6 (0.4) | 8.0 | 0.96 (0.14) | 1.61 (0.93) | 0.88 |
| 6.7 (0.4) | 6.7 (0.4) | 0.84 (0.18) | 0.81 (1.22) | |||
| 6.7 (0.1) | 6.7 (0.2) | 0.86 (0.11) | 0.93 (0.15) | |||
| Tyr11 | 13.8 (4.8) | - | 10.2 | 0.39 (0.38) | - | 0.73 |
| 13.1 (4.9) | - | 0.10 (0.48) | - | |||
| 12.6 (0.5) | - | 2.29 (0.26) | - | |||
| Lys13 | 12.0 (1.2) | 11.7 (0.8) | 9.9 | 0.93 (0.34) | 22.39 (38.89) | 0.69 |
| 11.9 (1.2) | 12.0 (0.8) | 0.44 (0.60) | 0.48 (44.64) | |||
| 12.0 (0.2) | 11.6 (0.2) | 0.59 (0.07) | 0.78 (0.09) | |||
| Tyr20 | 11.5 (0.2) | 11.8 (0.3) | 11.1 | 0.78 (0.08) | 1.03 (0.20) | 0.57 |
| 11.5 (0.2) | 11.8 (0.3) | 0.75 (0.09) | 0.87 (0.26) | |||
| 11.5 (0.1) | 11.7 (0.1) | 0.74 (0.05) | 0.84 (0.08) | |||
| Lys29 | 12.5 (0.6) | 12.6 (0.5) | 11.1 | 0.82 (0.12) | 4.88 (3.15) | 0.87 |
| 12.5 (0.6) | 12.6 (0.5) | 0.65 (0.20) | 1.04 (4.97) | |||
| 12.4 (0.1) | 12.5 (0.2) | 0.72 (0.08) | 1.01 (0.23) | |||
| Tyr31 | - | - | >12.5 | - | - | - |
| - | - | - | - | |||
| 17.0 (2.0) | 19.9 (16.2) | 0.35 (0.14) | −10.0 (7.9) | |||
| Lys34 | 10.3 (1.4) | 10.5 (1.4) | 10.1 | 0.69 (0.19) | 1.80 (1.85) | 0.66 |
| 10.4 (1.4) | 10.6 (1.4) | 0.36 (0.38) | 0.38 (2.33) | |||
| 10.4 (0.2) | 10.4 (0.2) | 0.45 (0.04) | 0.63 (0.06) | |||
| His52 | 7.5 (0.2) | 7.4 (0.2) | 7.5 | 0.93 (0.09) | 1.09 (0.25) | 0.93 |
| 7.5 (0.2) | 7.4 (0.2) | 0.89 (0.09) | 0.91 (0.31) | |||
| 7.5 (0.1) | 7.5 (0.1) | 0.90 (0.08) | 0.92 (0.09) | |||
| Lys55 | 10.8 (0.1) | 10.7 (0.1) | 11.1 | 0.83 (0.08) | 0.85 (0.10) | 0.64 |
| 10.8 (0.1) | 10.7 (0.1) | 0.82 (0.08) | 0.81 (0.11) | |||
| 10.8 (0.1) | 10.8 (0.1) | 0.84 (0.06) | 0.84 (0.07) | |||
Upper, middle and lower values for each residue are calculated with Method I, Method II and Method III, respectively. Estimated errors are indicated in the brackets.
We employ the RMSD to estimate the difference between results obtained from simulations and experimental data. This RMSD R is calculated from
| (20) |
where N is the number of ionizable residues, Ai is the predicted pKa value or Hill coefficient of the ionizable residue i obtained from simulations, and is the experimental pKa value or Hill coefficient of the ionizable residue i. RMDS values with respect to pKa values and Hill coefficients are listed in Table V. As shown in this table, the predicted pKa values obtained with both PHREM and PHMD simulations displayed a similar average RMSD, of about 1, with all averaging methods. With Method I, the Hill coefficients predicted from PHREM simulations were in much better agreement with the experimental data than those obtained from the PHMD simulations. With Method II and Method III, the Hill coefficients predicted with PHREM and PHMD were of comparable accuracy. Furthermore, the pKa values and Hill coefficients predicted with Method II and Method III were comparable to each other.
TABLE V.
RMSD of calculated values from the experimentaly determined data.
| pKa | Hill coefficient | |||
|---|---|---|---|---|
| PHREM | PHMD | PHREM | PHMD | |
| Low pH region | 0.97 | 1.03 | 0.09 | 0.91 |
| 0.97 | 1.06 | 0.19 | 0.26 | |
| 1.00 | 1.05 | 0.18 | 0.21 | |
| High pH region | 1.07 | 1.08 | 0.15 | 8.36 |
| 1.07 | 1.15 | 0.20 | 0.20 | |
| 1.08 | 1.02 | 0.15 | 0.14 | |
| Whole region | 1.02 | 1.05 | 0.12 | 5.75 |
| 1.02 | 1.10 | 0.19 | 0.23 | |
| 1.04 | 1.05 | 0.17 | 0.18 | |
Upper values, middle and lower values for each residue are calculated with Method I, Method II, and Method III respectively.
IV. CONCLUSIONS
We propose a new constant pH algorithm that is a combination of the constant pH algorithm by Mongan et. al. [23] with the replica-exchange method. In this algorithm, replicas exchange their pH values instead of their temperatures. We applied PHREM to proteins, and compared the results obtained with PHREM and PHMD. To increase sampling, multiple simulations started with six different initial velocities were performed with both PHREM and PHMD methods.
When pKa values and Hill coefficients were determined from individual simulations and the resulting pKa values and Hill coefficients then averaged (averaging Method I) the PHREM yielded significantly better Hill coefficients, and in some cases better pKa values than the PHMD results. This suggests that if only one set of constant pH simulations is performed, on average, the PHREM will yield better Hill coefficients. However, when the fractions of deprotonated species for each pH value were averaged between the six simulations started with different initial velocities, and the pKa values and Hill coefficients determined based on those averages (averaging Method II and III), the Hill coefficients determined with PHREM and PHMD were of comparable accuracy. Methods II and III differed among each other in the way errors were treated during the fitting procedure. Both methods yielded comparable results. The result suggests that the accuracy of predicted pKa values and Hill coefficients can be improved by running multiple simulations, and by using Method II or III to do the averaging. However, from the observed lower scatter of the calculated pKa values and Hill coefficients, as well as faster convergence, we conclude that the PHREM method is more efficient than the PHMD method.
In individual simulations at a given pH value, the PHREM realizes more effective sampling of both conformations and protonation states of titratable residues than the PHMD. This is because conformations and protonation states are coupled. When replicas are exchanged, new conformations and new protonation states can be sampled. However, the increase in conformational sampling offered through the pH replica exchange is, in some cases, still insufficient for accurate pKa calculations. In the future we will combine the PHREM with other methods for enhanced conformational sampling in order to obtain more accurate pKa values and Hill coefficients, as well as apply this method to more challenging systems, such as lysozyme or variants of staphylococcal nuclease with internal ionizable groups.
Acknowledgments
This research was supported by the Intramural Research Program of the NIH, NHLBI. A.D. was partially supported by NIH Grant RO1 GM073838 to Bertrand Garcia-Moreno at Johns Hopkins University. The authors thank Bertrand Garcia-Moreno for comments on the manuscript, and Petar Maksimovic for help with the program ROOT.
References
- 1.Mongan J, Case DA, McCammon JA. Constant pH molecular dynamics in generalized Born implicit solvent. J Comput Chem. 2004;25:2038–2048. doi: 10.1002/jcc.20139. [DOI] [PubMed] [Google Scholar]
- 2.García-Moreno B. Adaptations of proteins to cellular and subcellular pH. J Biol. 2009;8:98. doi: 10.1186/jbiol199. [DOI] [PMC free article] [PubMed] [Google Scholar]
- 3.Denisov VP, Schlessman JL, García-Moreno B, Halle B. Stabilization of internal charges in a protein: Water penetration or conformational change? Biophys J. 2004;87:3982–3994. doi: 10.1529/biophysj.104.048454. [DOI] [PMC free article] [PubMed] [Google Scholar]
- 4.Karp DA, Gittis AG Gittis R, Lattman EE, García-Moreno B. Structural and thermodynamic characterization of local conformational changes triggered by the ionization of an internal residue in a protein. Biophys J. 2004;86:86–87. [Google Scholar]
- 5.Damjanović A, Wu X, García-Moreno B, Brooks BR. Backbone relaxation coupled to the ionization of internal groups in proteins: A self-guided langevin dynamics study. Biophys J. 2008;95:4091–4101. doi: 10.1529/biophysj.108.130906. [DOI] [PMC free article] [PubMed] [Google Scholar]
- 6.Karp DA, Stahley MA, García-Moreno EB. Conformational consequences of ionization of Lys, Asp, and Glu buried at position 66 in Staphylococcal Nuclease. Biochemistry. 2010;49:4138–4146. doi: 10.1021/bi902114m. [DOI] [PMC free article] [PubMed] [Google Scholar]
- 7.Tanford C, Kirkwood JG. Theory of protein titration curves. I. General equations for impenetrable spheres. J Am Chem Soc. 1957;79:5333–5339. [Google Scholar]
- 8.Bashford D, Karplus M. pKas of ionizable groups in proteins - atomic detail from a continuum electrostatic model. Biochemistry. 1990;29:10219–10225. doi: 10.1021/bi00496a010. [DOI] [PubMed] [Google Scholar]
- 9.Nicholls A, Honig B. A rapid finite difference algorithm, utilizing successive over-relaxation to solve the Poisson-Boltzmann equation. J Comput Chem. 1991;12:435–445. [Google Scholar]
- 10.Antosiewicz J, McCammon JA, Gilson MK. Prediction of pH-dependent properties of proteins. J Mol Biol. 1994;238:415–436. doi: 10.1006/jmbi.1994.1301. [DOI] [PubMed] [Google Scholar]
- 11.Madura JD, Briggs JM, Wade RC, Davis ME, Luty BA, Ilin A, Antosiewicz J, Gilson MK, Bagheri B, Scott LR, McCammon JA. Electrostatics and diffusion of molecules in solution-simulations with the university-of-houston brownian dynamics program. Comput Phys Commun. 1995;91:57–95. [Google Scholar]
- 12.Li H, Robertson AD, Jensen JH. Very fast empirical prediction and rationalization of protein pK(a) values. Proteins: Struct Funct Bio. 2005;61:704–721. doi: 10.1002/prot.20660. [DOI] [PubMed] [Google Scholar]
- 13.García-Moreno BE, Dwyer JJ, Gittis AG, Lattman EE, Spencer DS, Stites WE. Experimental measurement of the effective dielectric in the hydrophobic core of a protein. Biophys Chem. 1997;64:211–224. doi: 10.1016/s0301-4622(96)02238-7. [DOI] [PubMed] [Google Scholar]
- 14.Schutz CN, Warshel A. What are the dielectric “constants” of proteins and how to validate electrostatic models? Proteins: Struct Funct Gen. 2001;44:400–417. doi: 10.1002/prot.1106. [DOI] [PubMed] [Google Scholar]
- 15.Fitch CA, Karp DA, Lee KK, Stites WE, Lattman EE, García-Moreno B. Experimental pK(a) values of buried residues: Analysis with continuum methods and role of water penetration. Biophys J. 2002;82:3289–3304. doi: 10.1016/s0006-3495(02)75670-1. [DOI] [PMC free article] [PubMed] [Google Scholar]
- 16.Isom DG, Castañeda CA, Cannon BR, Velu PD, García-Moreno B. to be published in Proc Natl Acad Sci USA. [Google Scholar]
- 17.Antosiewicz J, McCammon JA, Gilson MK. The determinants of pK(a)s in proteins. Biochemistry. 1996;35:7819–7833. doi: 10.1021/bi9601565. [DOI] [PubMed] [Google Scholar]
- 18.van Vlijmen HWT, Schaefer M, Karplus M. Improving the accuracy of protein pK(a) calculations: Conformational averaging versus the average structure. Proteins: Struct Func Gen. 1998;33:145–158. doi: 10.1002/(sici)1097-0134(19981101)33:2<145::aid-prot1>3.0.co;2-i. [DOI] [PubMed] [Google Scholar]
- 19.Georgescu RE, Alexov EG, Gunner MR. Combining conformational flexibility and continuum electrostatics for calculating pK(a)s in proteins. Biophys J. 2002;83:1731–1748. doi: 10.1016/S0006-3495(02)73940-4. [DOI] [PMC free article] [PubMed] [Google Scholar]
- 20.Simonson T, Carlsson J, Case DA. Proton binding to proteins: pK(a) calculations with explicit and implicit solvent models. J Am Chem Soc. 2004;126:4167–4180. doi: 10.1021/ja039788m. [DOI] [PubMed] [Google Scholar]
- 21.Ghosh N, Cui Q. pK(a) of residue 66 in Staphylococal nuclease. I. Insights from QM/MM simulations with conventional sampling. J Phys Chem B. 2008;112:8387–8397. doi: 10.1021/jp800168z. [DOI] [PMC free article] [PubMed] [Google Scholar]
- 22.Zheng L, Chen M, Yang W. Random walk in orthogonal space to achieve efficient free-energy simulation of complex systems. Proc Natl Acad Sci USA. 2008;105:20227–20232. doi: 10.1073/pnas.0810631106. [DOI] [PMC free article] [PubMed] [Google Scholar]
- 23.Mongan J, Case DA. Biomolecular simulations at constant pH. Curr Op Struct Biol. 2005;15:157–163. doi: 10.1016/j.sbi.2005.02.002. [DOI] [PubMed] [Google Scholar]
- 24.Dlugosz M, Antosiewicz JM. Constant-pH molecular dynamics simulations: a test case of succinic acid. Chem Phys. 2004;302:161–170. [Google Scholar]
- 25.Bürgi R, Kollman PA, van Gunsteren WF. Simulating proteins at constant pH: An approach combining molecular dynamics and Monte Carlo simulation. Proteins Struct Func Bio. 2002;47:469–480. doi: 10.1002/prot.10046. [DOI] [PubMed] [Google Scholar]
- 26.Baptista AM, Teixeira VH, Soares CM. Constant-pH molecular dynamics using stochastic titration. J Chem Phys. 2002;117:4184–4200. [Google Scholar]
- 27.Baptista AM, Martel PJ, Petersen SB. Simulation of protein conformational freedom as a function of pH: Constant-pH molecular dynamics using implicit titration. Proteins Struct Func Gen. 1997;27:523–544. [PubMed] [Google Scholar]
- 28.Mertz JE, Pettitt BM. Molecular-dynamics at a constant pH. Int J Supercomput Appl High Perform Comput. 1994;8:47–53. [Google Scholar]
- 29.Börjesson U, Hünenberger PH. Explicit-solvent molecular dynamics simulation at constant pH: Methodology and application to small amines. J Chem Phys. 2001;114:9706–9719. [Google Scholar]
- 30.Lee MS, Salsbury FR, Jr, Brooks CL., III Constant-pH molecular dynamics using continuous titration coordinates. Proteins Struct Func Bio. 2004;56:738–752. doi: 10.1002/prot.20128. [DOI] [PubMed] [Google Scholar]
- 31.Khandogin J, Brooks CL., III Constant pH molecular dynamics with proton tautomerism. Biophys J. 2005;89:141–157. doi: 10.1529/biophysj.105.061341. [DOI] [PMC free article] [PubMed] [Google Scholar]
- 32.Donnini S, Tegeler F, Groenhof G, Grubmüller H. Constant pH Molecular Dynamics in Explicit Solvent with λ-Dynamics. J Chem Theory Comput. 2011;7(6):1962–1978. doi: 10.1021/ct200061r. [DOI] [PMC free article] [PubMed] [Google Scholar]
- 33.Damjanović A, Miller BT, Wenaus TJ, Maksimović P, García-Moreno BE, Brooks BR. Open science grid study of the coupling between conformation and water content in the interior of a protein. J Chem Inf Model. 2008;48:2021–2029. doi: 10.1021/ci800263c. [DOI] [PubMed] [Google Scholar]
- 34.Damjanović A, Brooks BR, García-Moreno B. Conformational relaxation and water penetration coupled to ionization of internal groups in proteins. J Phys Chem. 2011;115:4042–4053. doi: 10.1021/jp110373f. [DOI] [PMC free article] [PubMed] [Google Scholar]
- 35.Laio A, Parrinello M. Escaping free-energy minima. Proc Natl Acad Sci USA. 2002;99:12562–12566. doi: 10.1073/pnas.202427399. [DOI] [PMC free article] [PubMed] [Google Scholar]
- 36.Hummer G, Kevrekidis IG. Coarse molecular dynamics of a peptide fragment: Free energy, kinetics, and long-time dynamics computations. J Chem Phys. 2003;118:10762–10773. [Google Scholar]
- 37.Bahar I, Rader AJ. Coarse-grained normal mode analysis in structural biology. Curr Op Struct Biol. 2005;15:586–592. doi: 10.1016/j.sbi.2005.08.007. [DOI] [PMC free article] [PubMed] [Google Scholar]
- 38.Zheng W, Brooks BR. Normal-modes-based prediction of protein conformational changes guided by distance constraints. Biophys J. 2005;88:3109–3117. doi: 10.1529/biophysj.104.058453. [DOI] [PMC free article] [PubMed] [Google Scholar]
- 39.Chu JW, Voth GA. Allostery of actin filaments: Molecular dynamics simulations and coarse-grained analysis. Proc Natl Acad Sci USA. 2005;102:13111–13116. doi: 10.1073/pnas.0503732102. [DOI] [PMC free article] [PubMed] [Google Scholar]
- 40.Torrie GM, Valleau JP. Nonphysical sampling distributions in Monte Carlo free-energy estimation: Umbrella sampling. J Comput Phys. 1977;23:187–199. [Google Scholar]
- 41.Grubmüller H. Predicting slow structural transitions in macromolecular systems - conformational flooding. Phys Rev E. 1995;52:2893–2096. doi: 10.1103/physreve.52.2893. [DOI] [PubMed] [Google Scholar]
- 42.Voter AF. Hyperdynamics: Accelerated molecular dynamics of infrequent events. Phys Rev Lett. 1997;78:3908–3911. [Google Scholar]
- 43.Hamelberg D, Mongan J, McCammon JA. Accelerated molecular dynamics: A promising and efficient simulation method for biomolecules. J Chem Phys. 2004;120:11919–11929. doi: 10.1063/1.1755656. [DOI] [PubMed] [Google Scholar]
- 44.Mitsutake A, Sugita Y, Okamoto Y. Generalized-ensemble algorithms for molecular simulations of biopolymers. Biopolymers. 2001;60:96–123. doi: 10.1002/1097-0282(2001)60:2<96::AID-BIP1007>3.0.CO;2-F. [DOI] [PubMed] [Google Scholar]
- 45.Itoh SG, Okumura H, Okamoto Y. Generalized-ensemble algorithms for molecular dynamics simulations. Mol Sim. 2007;33:47–56. [Google Scholar]
- 46.Hukushima K, Nemoto K. Exchange Monte Carlo method and application to spin glass simulations. J Phys Soc Jpn. 1996;65:1604–1608. [Google Scholar]
- 47.Sugita Y, Okamoto Y. Replica-exchange molecular dynamics method for protein folding. Chem Phys Lett. 1999;314:141–151. [Google Scholar]
- 48.Itoh SG, Okamoto Y. Theoretical studies of transition states by the multioverlap molecular dynamics methods. J Chem Phys. 2006;124:104103. doi: 10.1063/1.2171189. [DOI] [PubMed] [Google Scholar]
- 49.Itoh SG, Okamoto Y. Effective sampling in the configurational space of a small peptide by the multicanonical-multioverlap algorithm. Phys Rev E. 2007;76:026705. doi: 10.1103/PhysRevE.76.026705. [DOI] [PubMed] [Google Scholar]
- 50.Itoh SG, Okumura H, Okamoto Y. Replica-exchange method in van der Waals radius space: Overcoming steric restrictions for biomolecules. J Chem Phys. 2010;132:134105. doi: 10.1063/1.3372767. [DOI] [PubMed] [Google Scholar]
- 51.Sanbonmatsu KY, García AE. Structure of Met-enkephalin in explicit aqueous solution using replica exchange molecular dynamics. Proteins Struct Func Gen. 2002;46:225–234. doi: 10.1002/prot.1167. [DOI] [PubMed] [Google Scholar]
- 52.Olender R, Elber R. Calculation of classical trajectories with a very large time step: Formalism and numerical examples. J Chem Phys. 1996;105:9299–9315. [Google Scholar]
- 53.Schlitter J, Engels M, Krüger P, Jacoby E, Wollmer A. Targeted molecular-dynamics simulation of conformational change - application to the T ↔ R transition in Insulin. Mol Sim. 1993;10:291. [Google Scholar]
- 54.Izrailev S, Stepaniants S, Balsera M, Oono Y, Schulten K. Molecular dynamics study of unbinding of the avidin-biotin complex. Biophys J. 1997;72:1568–1581. doi: 10.1016/S0006-3495(97)78804-0. [DOI] [PMC free article] [PubMed] [Google Scholar]
- 55.Wu XW, Brooks BR. Self-guided Langevin dynamics simulation method. Chem Phys Lett. 2003;381:512–518. [Google Scholar]
- 56.Khandogin J, Brooks CL., III Toward the accurate first-principles prediction of ionization equilibria in proteins. Biochemistry. 2006;45:9363–9373. doi: 10.1021/bi060706r. [DOI] [PubMed] [Google Scholar]
- 57.Meng Y, Roitberg AE. Constant pH replica exchange molecular dynamics in biomolecules using a discrete protonation model. J Chem Theo Comput. 2010;6:1401–1412. doi: 10.1021/ct900676b. [DOI] [PMC free article] [PubMed] [Google Scholar]
- 58.Williams SL, de Oliveira CA, McCammon JA. Coupling constant pH molecular dynamics with accelerated molecular dynamics. J Chem Theory Comput. 2010;9:560–568. doi: 10.1021/ct9005294. [DOI] [PMC free article] [PubMed] [Google Scholar]
- 59.Wallace J, Shen JK. Predicting pKa values with continuous constant pH molecular dynamics. Meth Enzym. 2009;466:455–475. doi: 10.1016/S0076-6879(09)66019-5. [DOI] [PubMed] [Google Scholar]
- 60.Case DA, Cheatham TE, III, Darden T, Gohlke H, Luo R, Merz KM, Jr, Onufriev A, Simmer-ling C, Wang B, Woods R. The Amber biomolecular simulation programs. J Computat Chem. 2005;26:1668–1688. doi: 10.1002/jcc.20290. [DOI] [PMC free article] [PubMed] [Google Scholar]
- 61.Brooks BR, Brooks CL, III, Mackerell AD, Nilsson L, Petrella RJ, Roux B, Won Y, Archontis G, Bartels C, Boresch S, Caflisch A, Caves L, Cui Q, Dinner AR, Feig M, Fischer S, Gao J, Hodoscek M, Im W, Kuczera K, Lazaridis T, Ma J, Ovchinnikov V, Paci E, Pastor RW, Post CB, Pu JZ, Schaefer M, Tidor B, Venable RM, Woodcock HL, Wu X, Yang W, York DM, Karplus M. CHARMM: The biomolecular simulation program. J Comp Chem. 2009;30:1545–1614. doi: 10.1002/jcc.21287. [DOI] [PMC free article] [PubMed] [Google Scholar]
- 62.MacKerell AD, Jr, Bashford D, Bellott M, Dunbrack RL, Jr, Evanseck JD, Field MJ, Fischer S, Gao J, Guo H, Ha S, Joseph-McCarthy D, Kuchnir L, Kuczera K, Lau FTK, Mattos C, Michnick S, Ngo T, Nguyen DT, Prodhom B, Reiher WE, III, Roux B, Schlenkrich M, Smith JC, Stote R, Straub J, Watanabe M, Wiórkiewicz-Kuczera J, Yin D, Karplus M. All-atom empirical potential for molecular modeling and dynamics studies of proteins. J Phys Chem B. 1998;102:3586–3616. doi: 10.1021/jp973084f. [DOI] [PubMed] [Google Scholar]
- 63.Shen JK, Wallace JA. Continuous constant pH molecular dynamics in explicit solvent with pH-based replica exchange. Journal of Chemical Theory and Computation. doi: 10.1021/ct200146j. in press. [DOI] [PMC free article] [PubMed] [Google Scholar]
- 64.Metropolis N, Rosenbluth AW, Rosenbluth MN, Teller AH, Teller E. Equation of state calculations by fast computing machines. J Chem Phys. 1953;21:1087–1092. [Google Scholar]
- 65.Yamaguchi T, Kiuchi T, Matsuoka T, Koda S. Multi-pH Monte Carlo simulation of coil-globule transition of weak polyelectrolyte. Bull Chem Soc Jpn. 2005;78:2098–2104. [Google Scholar]
- 66.Still WC, Tempczyk A, Hawley RC, Hendrickson TJ. Semianalytical treatment of solvation for molecular mechanics and dynamics. J Am Chem Soc. 1990;112:6127–6129. [Google Scholar]
- 67.Qiu D, Shenkin PS, Hollinger FP, Still WC. The GB/SA continuum model for solvation. A fast analytical method for the calculation of approximate. Born radii J Phys Chem A. 1997;101:3005–3014. [Google Scholar]
- 68.van Gunsteren WF, Berendsen HJC. Algorithms for macromolecular dynamics and constraint dynamics. Mol Phys. 1977;34:1311–1327. [Google Scholar]
- 69.Nosé S. A molecular-dynamics method for simulations in the canonical ensemble. Mol Phys. 1984;52:255–268. [Google Scholar]
- 70.Nosé S. A unified formulation of the constant temperature molecular-dynamics methods. J Chem Phys. 1984;81:511–519. [Google Scholar]
- 71.Hoover WG. Canonical dynamics - equilibrium phase-space distributions. Phys Rev A. 1985;31:1695–1697. doi: 10.1103/physreva.31.1695. [DOI] [PubMed] [Google Scholar]
- 72.Lee MS, Feig M, Salsbury FR, Jr, Brooks CL., III New analytic approximation to the standard molecular volume definition and its application to generalized born calculations. J Comput Chem. 2003;24:1348–1356. doi: 10.1002/jcc.10272. [DOI] [PubMed] [Google Scholar]
- 73.Chiang CM, Chien KY, Lin HJ, Lin JF, Yeh HC, Ho PL, Wu WG. Change and inactivation of membrane phospholipid-related activity of cardiotoxin V from Taiwan cobra venom at acidic pH. Biochemistry. 1996;35:9167–9176. doi: 10.1021/bi952823k. [DOI] [PubMed] [Google Scholar]
- 74.Chiang CM, Chang SL, Lin HJ, Wu WG. The role of acidic amino acid residues in the structural stability of snake cardiotoxins. Biochemistry. 1996;35:9177–9186. doi: 10.1021/bi960077t. [DOI] [PubMed] [Google Scholar]
- 75.Singhal AK, Chien KY, Wu WG, Rule GS. Solution structure of cardiotoxin-V from aja-naja-atra. Biochemistry. 1993;32:8036–8044. doi: 10.1021/bi00082a026. [DOI] [PubMed] [Google Scholar]
- 76.Brun R, Rademakers F. ROOT - An Object Oriented Data Analysis Framework. Nucl Inst and Meth in Phys Res A; Proceedings AIHENP’96 Workshop; Lausanne. Sep. 1996; 1997. pp. 81–86. [Google Scholar]
- 77.Cowan G. Statistical data analysis. Oxford, UK: Clarendon; 1998. p. 197. [Google Scholar]
- 78.Karplus M, Kushick JN. Method for estimating the configurational entropy of macromolecules. Macromolecules. 1981;14:325–332. [Google Scholar]
- 79.Schaller W, Robertson AD. pH, ionic-strength, and temperature dependences of ionization equilibria for the carboxyl groups in turkey ovomucoid 3rd domain. Biochemistry. 1995;34:4714–4723. doi: 10.1021/bi00014a028. [DOI] [PubMed] [Google Scholar]
- 80.Forsyth WR, Gilson MK, Antosiewicz J, Jaren OR, Robertson AD. Theoretical and experimental analysis of ionization equilibria in ovomucoid third domain. Biochemistry. 1998;37:8643–8652. doi: 10.1021/bi980187v. [DOI] [PubMed] [Google Scholar]
- 81.Hoogstraten CG, Choe S, Westler WM, Markley JL. Comparison of the accuracy of protein solution structures derived from conventional and network-edited noesy data. Protein Science. 1995;4:2289–2299. doi: 10.1002/pro.5560041106. [DOI] [PMC free article] [PubMed] [Google Scholar]
- 82.Nozaki Y, Tanford C. Examination of titration behavior. Meth Enzym. 1967;11:715–734. [Google Scholar]
- 83.Kyte J. Structure in Protein Chemistry. Garland Publishing, Inc; New York: 1995. [Google Scholar]
- 84.Quenouille MH. Notes on bias in estimation. Biometrika. 1956;43:353–360. [Google Scholar]
- 85.Miller RG. The jackknife-a review. Biometrika. 1974;61:1–15. [Google Scholar]
- 86.Berg BA. Markov Chain Monte Carlo Simulations and Their Statistical Analysis. World Scientific; Singapore: 2004. [Google Scholar]


