

Abstract
This study demonstrates a novel approach to test associations between highly heterogeneous genetic loci and complex phenotypes. Previous investigations of the relationship between Cytochrome P450 2A6 (CYP2A6) genotype and smoking phenotypes made comparisons by dividing subjects into broad categories based on assumptions that simplify the range of function of different CYP2A6 alleles, their numerous possible diplotype combinations and non-additive allele effects. A predictive model that translates CYP2A6 diplotype into a single continuous variable was previously derived from an in vivo metabolism experiment in 189 European Americans. Here, we apply this model to assess associations between genotype, inferred nicotine metabolism and smoking behaviors in larger samples without direct nicotine metabolism measurements. CYP2A6 genotype is not associated with nicotine dependence, as defined by the Fagerström Test of Nicotine Dependence, demonstrating that cigarettes smoked per day (CPD) and nicotine dependence have distinct genetic correlates. The predicted metric is significantly associated with CPD among African Americans and European American dependent smokers. Individual slow metabolizing genotypes are associated with lower CPD, but the predicted metric is the best predictor of CPD. Furthermore, optimizing the predictive model by including additional CYP2A6 alleles improves the fit of the model in an independent data set and provides a novel method of predicting the functional impact of alleles without direct metabolism measurements. Lastly, comprehensive genotyping and in vivo metabolism data are used to demonstrate that genome-wide significant associations between CPD and single nucleotide polymorphisms are the result of synthetic associations.
INTRODUCTION
Investigation of the genetics of complex traits, such as liability to substance dependence, is complicated both by the large number of biological pathways/genes that may contribute, and in some cases, by the extent of variation within individual loci. The present study demonstrates the utility of two approaches to overcome these barriers: (i) the use of an associated endophenotype measured in a small sample in order to derive a predictive model that translates allelic heterogeneity in relevant genes into a single continuous variable, and (ii) the application of this predicted variable in a larger sample to test for phenotype associations and potentially estimate the activities of novel or poorly characterized alleles. A model application of this approach is the dissection of relationships between genes involved in nicotine metabolism and smoking behaviors. Because the psychoactive properties of nicotine correlate closely with its plasma concentration, dependent smokers titrate nicotine intake to maintain ‘target’ blood levels (1–5). Not surprisingly, direct measurements of nicotine metabolism have been shown to be associated with smoking phenotypes, most prominently the number of cigarettes smoked per day (CPD) (2). However, like many potentially valuable endophenotypes, nicotine metabolism is difficult to evaluate in existing data sets without appropriate biomaterials, and unlikely to be examined in studies focused on other phenotypes. Therefore, we recently developed a model of predicted nicotine metabolism based on CYP2A6 haplotype, derived from an in vivo nicotine metabolism experiment (6). In most smokers, oxidation of nicotine to its primary metabolite, cotinine, accounts for 70–80% of nicotine metabolism (7) and is dominated by the product of a single gene, CYP2A6. CYP2A6 genotype is associated with multiple smoking behaviors (8,9), and the region of chromosome 19 surrounding CYP2A6 is one of only four loci reported associated with CPD with genome-wide statistical significance (10,11). The CYP2A6 locus is highly polymorphic, including many functionally diverse alleles, deletions, complete gene duplications and more complex structural variants involving adjacent CYP2A family members. Genotyping difficulties, and the occurrence of multiple low frequency functionally relevant variants in linkage disequilibrium (LD) within the locus, complicate the interpretation of associations observed in unbiased genetic screens which rely on LD tagging rather than direct genotyping functional variants.
Past studies focused on the relationship between CYP2A6 variants and smoking phenotypes have divided subjects into broad categories of ‘slow’, ‘intermediate’ and ‘fast’ metabolizers according to CYP2A6 diplotype. These divisions over-simplify the functional range of different CYP2A6 alleles and their possible combinations. By developing a model based on comprehensive haplotypes and well-controlled in vivo oral metabolism measurements in a moderate-sized sample, we hoped to limit assumptions and translate CYP2A6 diplotype into a single continuous variable that can act as a proxy for CYP2A6 function. This approach has a significant advantage, both practical and theoretical, over arbitrarily ranking diplotypes or assignment of a ‘gene score’ by merely summing assumed risk alleles for each subject. In brief, step-wise linear regression was used to identify CYP2A6 haplotypes that significantly impacted nicotine metabolism, based on all identified non-synonymous variants, along with synonymous and non-coding variants previously reported to affect function or expression, that were present in the sample. To avoid over-fitting, unique parameters were only granted to haplotypes demonstrated to be significantly different from the most common reference haplotype and known null haplotypes. The model also accounts for the demonstrated non-additive effect of CYP2A6 haplotype upon the metabolic ratio, i.e. the difference in metabolism between loss-of-function (LOF) allele homozygotes and heterozygotes is significantly greater than the difference between LOF heterozygotes and reference allele homozygotes. Cross-validation indicated that the model predicts ∼70% of the variance in the measured metric of nicotine-to-cotinine metabolism in European Americans (6).
Here, we utilize the predictive power of the model to evaluate the controversial relationship between nicotine metabolism and liability to nicotine dependence (12–14). COGEND (the Collaborative Genetic Study of Nicotine Dependence) was designed specifically to enhance the identification of factors associated with nicotine dependence by excluding non-smokers (lifetime cigarettes < 100), and stringently defining dependence according to Fagerström Test of Nicotine Dependence (FTND) scores of ≥4 (dependent) versus 0–1 (not dependent). We use the strength of this design to demonstrate that nicotine dependence and CPD have distinct genetic correlates; inferred nicotine metabolism and CYP2A6 genotype are not associated with nicotine dependence per se, but we confirm the stable association between CYP2A6 genotype and CPD among European dependent smokers (1,15), and extend this evidence to African Americans. We also use the robust association with CPD to generate quantitative hypotheses about further CYP2A6 alleles not included in the original model, thereby improving the performance of the model in a further independent sample.
Finally, we find that the significant associations between CPD and single nucleotide polymorphisms (SNPs) near CYP2A6 reported by large genome-wide association studies (10,11) are examples of ‘synthetic’ associations, in part accounted for by LD with the less-frequent functional alleles included in the model of nicotine metabolism. The importance of synthetic associations among the results of genome-wide association studies is controversial and currently under debate in the human genetics community (16,17). Here, we provide evidence of at least one such finding related to a complex behavioral phenotype.
RESULTS
CYP2A6 genotype, predicted nicotine metabolism and nicotine dependence
Allele frequencies are summarized in Table 1 and a summary of findings related to each allele investigated is provided in Supplementary Material, Table S1. COGEND was designed as a case/control study of nicotine dependence, excluding subjects with intermediate FTND scores. To determine whether meeting criteria for nicotine dependence is associated with CYP2A6 genotype, allele frequencies for CYP2A6 haplotypes associated with reduced nicotine metabolism efficiency were calculated in dependent (FTND ≥ 4) and non-dependent (FTND = 0–1) smokers, separating subjects by race (Table 2). No significant differences in allele frequencies were found between dependent and non-dependent smokers among European Americans or African Americans for all alleles.
Table 1.
Polymorphism in the CYP2A6 gene
| Haplotype namea | Defining polymorphismsb | Frequency (number of alleles analyzed) |
|
|---|---|---|---|
| European American | African American | ||
| *1A(51A) | rs1137115(A), rs28399435(G), rs1801272(T) | 0.1860 (4108) | 0.1986 (1420) |
| rs1137115(A) | 0.2564 (4118) | 0.2056 (1420) | |
| *1H | rs61663607 and copy number = 1 | 0.0770 (4118) | 0.1068 (1422) |
| rs61663607(G) | 0.0770 (4118) | 0.1139 (1422) | |
| *1X2 | Copy number = 2 | 0.0039 (4118) | 0.0092 (1420) |
| *2 | rs1801272(A) | 0.0306 (4116) | 0.0028 (1422) |
| *4 | Copy number = 0 | 0.0090 (4118) | 0.0246 (1420) |
| *9 | rs28399433(G) | 0.0610 (4116) | 0.0768 (1422) |
| *12 | rs28399442(T) | 0.0262 (4116) | 0.0056 (1422) |
| rs55925467(G) | 0.0288 (4106) | 0.0077 (1422) | |
| *14 | rs28399435(A) | 0.0413 (4108) | 0.0042 (1422) |
| *17 | rs28399454(A) | 0.0009 (1104) | 0.1051 (1322) |
| *20 | rs28399444(–) | 0.0000 (932) | 0.0162 (1420) |
| *21 | rs1137115(A), rs6413474(G) | 0.0092 (3904) | 0.0016 (1288) |
| *23 | rs56256500(T) | 0.0001 (930) | 0.0155 (1422) |
| *24, *35, *36, *37 | rs61736436(T) | 0.0006 (930) | 0.0225 (1422) |
| *25 | rs28399440(C), rs4986891(G), rs59552350(T), rs28399445(GC) | 0.0000 (930) | 0.0014 (1422) |
| *26 | rs28399440(C), rs4986891(A), rs59552350(G) | 0.0000 (930) | 0.0035 (1422) |
| *27 | rs28399440(C), rs28399445(A) | 0.0000 (930) | 0.0042 (1422) |
| rs28399440(C) | 0.0000 (930) | 0.0091 (1422) | |
| *28 | rs28399463(G), rs8192730(C) | 0.0010 (4118) | 0.0211 (1422) |
| rs28399463(G) | 0.0010 (4118) | 0.0211 (1422) | |
| rs8192730(C) | 0.0012 (4118) | 0.0218 (1422) | |
| *31 | rs72549432(C) | 0.0000 (930) | 0.0141 (1422) |
| *38 | rs148166815(G) | 0.0005 (3918) | 0.0000 (1290) |
aHaplotype names follow official recommendations with the addition of *1A(51A) for clarity. Alleles are ordered by name. Further SNPs are ordered adjacent to relevant haplotypes. Because of the high correlation between the minor allele of rs61663607 and three gene copies in African American subjects, the *1H allele is only counted in subjects with <3 copies of CYP2A6. The rs61736436 T allele marks four named haplotypes (CYP2A6*24, *35, *36 and *37) not further differentiated by genotyping in this sample.
bGenotyped polymorphisms used to define haplotypes in this study.
Table 2.
Frequencies of slow-metabolizing CYP2A6 haplotypes in non-dependent and dependent smokers
| Haplotype namea | % Minor allele frequency |
|||||
|---|---|---|---|---|---|---|
| European American |
African American |
|||||
| Non-Db | Dc | Pd | Non-Db | Dc | Pd | |
| Number of subjects | 933 | 1055 | 248 | 461 | ||
| *1A(51A) | 19.0 | 17.0 | 0.11 | 22.0 | 18.5 | 0.13 |
| *2 | 2.6 | 3.5 | 0.10 | 0.0 | 0.4 | 0.10 |
| *4 | 0.9 | 0.9 | 0.98 | 2.4 | 2.5 | 0.92 |
| *9 | 5.7 | 6.5 | 0.32 | 6.5 | 8.4 | 0.18 |
| *12 | 2.3 | 2.9 | 0.21 | 0.6 | 0.5 | 0.88 |
aHaplotype names follow official recommendations with the addition of *1A(51A) for clarity.
bNon-dependent smokers (FTND 0 among European Americans, FTND 0-1 among African Americans).
cDependent smokers (FTND ≥ 4).
dP-values refer to the likelihood that differences in minor allele frequencies between dependent and non-dependent smokers is due to chance.
To increase power and take into account non-additive effects of CYP2A6 genotype, a model of nicotine metabolism endophenotype by CYP2A6 genotype based on in vivo measurements (6) was used to predict a relative metabolism metric for each subject. The model predicts how each genotyped subject would perform on the original in vivo experiment to utilize the metric of nicotine metabolism as a proxy for CYP2A6 activity. Mean metabolism metric estimates were not significantly different between dependent and non-dependent smokers among European Americans (0.859 ± 0.064 vs. 0.862 ± 0.060, P= 0.19) or African Americans (0.867 ± 0.051 vs. 0.869 ± 0.040, P= 0.55). The mean predicted metric was higher among African Americans (P= 0.0008) reflecting the difference in allele frequencies of slow-metabolizing haplotypes included in the original model (Table 1). The distributions of the predicted metrics are summarized in Figures 1 and 2.
Figure 1.

Distribution of modeled nicotine metabolism in European Americans.
Figure 2.

Distribution of modeled nicotine metabolism in African Americans.
Association between CYP2A6 genotype, predicted metabolism and cigarette consumption among dependent smokers
Mean CPD is highly significantly different between non-dependent and dependent European American (4.1 ± 3.8 vs. 22.5 ± 9.2, P< 2 × 10⁻¹⁶) and African American smokers (5.6 ± 3.8 vs. 16.0 ± 8.2, P< 2 × 10⁻¹⁶) in COGEND. However, cigarette consumption also varies widely among dependent smokers; therefore, the association between CPD and CYP2A6 genotype in European American-dependent smokers was first assessed by comparing mean CPD between subjects of various CYP2A6 diplotypes (Table 3). Homozygotes for CYP2A6 haplotypes defined as ‘normal metabolizers’ based on previous in vivo results (6) were compared with homozygotes and heterozygotes for demonstrated ‘slow’ metabolizer CYP2A6 haplotypes, *1A(51A), *2,*4,*9 and *12. Most slow metabolizer diplotypes display lower mean CPD than normal metabolizer diplotypes (Table 3), but only heterozygotes for a common likely null allele, *12, demonstrate a statistically significant difference from normal metabolizers (Table 3). Homozygotes and heterozygotes for four assumed null alleles, *2, *4, *12 and *38 (6) taken together were also statistically significantly different from normal metabolizers (Table 3).
Table 3.
Mean CPD by CYP2A6 diplotype in nicotine-dependent European Americans
| CYP2A6 diplotypea | n | Mean CPD ± SDb | Mean categorized CPD ± SDc | P different from norm/normd |
|---|---|---|---|---|
| Norm/norme | 508 | 22.7 ± 9.2 | 1.42 ± 0.80 | |
| *1A/norme | 229 | 23.6 ± 10.1 | 1.45 ± 0.8 | 0.43 |
| LOFf hetsg and homosh | 147 | 20.7 ± 8.8 | 1.24 ± 0.69 | 0.016*i |
| LOFf hetsg | 140 | 20.7 ± 8.2 | 1.27 ± 0.73 | 0.039*j |
| *9/norme | 97 | 21.4 ± 7.9 | 1.27 ± 0.74 | 0.12 |
| *2 hetsg | 70 | 21.3 ± 9.2 | 1.33 ± 0.70 | 0.43 |
| *12 hetsg | 60 | 20.6 ± 8.5 | 1.18 ± 0.65 | 0.020*k |
| *1A/*1A | 38 | 20.3 ± 7.0 | 1.18 ± 0.69 | 0.074 |
| *9/*1A | 22 | 19.6 ± 7.6 | 1.18 ± 0.59 | 0.11 |
| *4 hetsg | 19 | 20.8 ± 11.5 | 1.21 ± 0.71 | 0.27 |
| LOFf homosh | 7 | 22.6 ± 8.2 | 1.41 ± 0.74 | 0.76 |
| *9/*9 | 3 | 25.0 ± 8.7 | 1.67 ± 0.58 | 0.51 |
aHaplotype names follow official recommendations except that *1A refers only to the rs1137115 A allele. Diplotypes are ordered by frequency.
bMean CPD ± standard deviation.
cMean CPD as a four-level categorical trait (0 = CPD ≤ 10, 1 = 10 < CPD ≤ 20, 2 = 20 < CPD ≤ 30 and 3 = CPD > 30) ± standard deviation.
dP-values refer to the likelihood that the difference in mean categorized CPD between subjects with the given diplotype and norm/norm subjects is due to chance.
eNormal haplotypes are considered all CYP2A6 haplotypes excluding CYP2A6*1A, *2, *4, *9, *12, and *38.
fLoss of function haplotypes are here *2, *4, *12 and *38.
gHeterozygotes of the given haplotype and all other haplotypes.
hSubjects that carry two of any of these four haplotypes.
iNon-categorized CPD P= 0.019.
jNon-categorized CPD P = 0.016.
kNon-categorized CPD P = 0.08.
Attempting to more directly test the association between CPD and nicotine metabolism, we further utilized the nicotine metabolism metric predicted from CYP2A6 genotype (6) and found it significantly associated with CPD in both nicotine-dependent European Americans (n= 1043, P= 0.007 or P= 0.005 for CPD treated as a categorical or continuous trait; parameter estimate = 4.3 ± 2.8) and African Americans (n= 453, P= 0.016 categorical, P= 0.027 continuous; parameter estimate=7.6 ± 2.2). In contrast, no single CYP2A6 haplotype or SNP used to generate the model, nor a multivariate regression using all of the common haplotypes included in the model, were significant (Table 4). The significant association among African Americans was surprising given that the model parameters were derived from an experiment conducted in European American subjects and further unaccounted-for CYP2A6 alleles are known to occur among Africans. However, several of the most common and important alleles contributing to CYP2A6 variation in African Americans (*4, *9 and *1A) are present in the model.
Table 4.
Variables associated with CPD in 1043 nicotine-dependent European Americans
| Variablea | P-value |
|---|---|
| CYP2A6 copy number | 0.34 |
| CYP2A6*1A(51A) | 0.92 |
| CYP2A6*2 (rs1801272) | 0.45 |
| CYP2A6*4 | 0.51 |
| CYP2A6*9 (rs28399433) | 0.14 |
| CYP2A6*12 (rs28399442) | 0.045 |
| Loss of function haplotypesb | 0.050 |
| rs1137115c | 0.46 |
| Multivariate including *4, *2, *12, *9 and *1A(51A) | 0.13 |
| Estimated metabolism metric | 0.0073 |
aHaplotype and SNP variables are coded as number of alleles (0–2). Copy number is coded as number of gene copies (1–3). Haplotype names follow official recommendations with the addition of *1A(51A) for clarity.
bLoss of function haplotypes are here *2, *4, *12 and *38 coded as number of alleles.
cThe minor allele of rs1137115 marks both CYP2A6*1A and *2.
These results were further replicated in 905 smokers of European descent with FTND ≥ 4, from the Nicotine Addiction Genetics Project (NAG). In this independent sample, CPD is also significantly associated with the predicted metabolism metric (P< 0.05) as either a continuous or categorical trait. Consistent with our prior results, this association was not significant when non-dependent smokers were included (FTND< 4, total n= 1468; P= 0.2), nor was there a significant difference in the mean predicted metric between FTND ≥ 4 and FTND = 0 (n= 141) subjects (0.867 vs. 0.866, P= 0.7).
The association with a predicted metabolism metric allows for the indirect assessment of further CYP2A6 variants
Several CYP2A6 alleles common in African Americans and reported to impact nicotine metabolism efficiency were not included in the endophenotype/genotype model used here because the model was derived from an in vivo study conducted exclusively in European Americans. We tested whether optimization of the model could be used to predict the relative impact of additional alleles on CYP2A6 activity indirectly through the association between predicted metabolism and CPD, and improve the model without further in vivo experiments.
First, new alleles were included in the predictive model individually, varying the new parameter to maximize the overall association between CPD and the predicted metabolism metric among all African American-dependent smokers. Nine new variants were tested in African Americans. Allele parameters that individually maximized the association accorded well with allele function based on previous in vivo and in vitro studies in most cases (Table 5, and see Supplementary Material, Table S1). These initial successes led us to individually test the parameters of all the relatively common genotyped alleles (>0.5%) in European or African Americans in the COGEND set, including two alleles of interest in European Americans not differentiated by the original predictive model (Tables 5 and 6). The *2 and *4 alleles are assumed to be null alleles in these analyses. The model fit and statistical significance of the association between CPD and the predicted metric was improved more among African American than among European American-dependent smokers by rerunning the prediction with all of the new parameters together, indicating the relative strength of the original model to predict the impact of CYP2A6 genotype on cigarette consumption in Europeans, and the importance (functional impact and frequency) of additional alleles found among Africans. None of the added polymorphisms tested alone significantly predicted CPD, nor as part of a simple multivariate regression together with the original predicted metabolism metric (data not shown).
Table 5.
Allele parameter estimates in African American-dependent smokers
| Haplotype namea | MAFb | nc | Modeld | Initial fite | Final fit (i4)f | P ≠ 0g | P ≠ 1h |
|---|---|---|---|---|---|---|---|
| *1A(51A) | 12.7 | 152 | 0.74 | 0.80 | 0.76 | 0.01* | 0.2 |
| *1H | 6.8 | 62 | 1 | 1 | 1 | 0.002* | |
| *1X2? | 0.7 | 6 | 1 | 0 | 0.22 | 1 | 0.2 |
| *9 | 8.2 | 75 | 0.60 | 0.85 | 0.78 | 0.01* | 0.3 |
| *12 | 0.5 | 5 | 0 | 0 | 0 | 0.2 | |
| *17 | 9.2 | 84 | 1 | 0.85 | 0.86 | 0.004* | 0.6 |
| *20 | 1.8 | 16 | 1 | 0 | 0.21 | 1 | 0.09 |
| *23 | 2.1 | 19 | 1 | 0.45 | 0.59 | 0.2 | 0.3 |
| *24/ *35/ *36/ *37 | 2.1 | 19 | 1 | 1 | 1 | 0.002* | |
| *25/ *26/ *27 | 0.9 | 8 | 1 | 0 | 0 | 0.03* | |
| *28 | 1.9 | 17 | 0.74 | 0.95 | 0.92 | 0.07 | 1 |
| *31 | 1.0 | 9 | 1 | 0.95 | 0.92 | 0.1 | 1 |
| P-valuei | 0.027 | 0.0004 | 0.0003 |
aHaplotype names follow official recommendations with the addition of *1A(51A) for clarity.
bPercent minor allele frequency among African American-dependent smokers.
cTotal number of alleles among African American-dependent smokers.
dNormalized allele parameters assumed in the predictive model derived from in vivo metabolism measurements in 189 European Americans (6). 1 = full normal activity; 0 = null activity.
eNormalized allele parameters determined by maximizing the association between CPD and the predicted metabolism metric, varying each parameter individually while maintaining all other parameters according to the original experimentally derived model.
fNormalized allele parameters determined by maximizing the association between CPD and the predicted metabolism metric following an EM algorithm until it converged (iteration 4, see Materials and Methods).
gP refers to the statistical likelihood that the allele parameter is not equal to null activity by chance, comparing the fits of the association with CPD using the ‘final fit’ parameters or the same parameters except changing the single allele parameter to ‘0’.
hP refers to the statistical likelihood that the allele parameter is not equal to full normal activity by chance, comparing the fits of the association with CPD using the ‘final fit’ parameters or the same parameters except changing the single allele parameter to ‘1’.
iOverall P-value for the association between CPD and the predicted metric using each set of parameters.
Table 6.
Allele parameter estimates in European American-dependent smokers
| Haplotype namea | MAFb | nc | Modeld | Initial fite | Final fit (i5)f | P ≠ 0g | P ≠ 1h |
|---|---|---|---|---|---|---|---|
| *1A(51A) | 16.6 | 341 | 0.74 | 0.70 | 0.66 | 0.04* | 0.14 |
| *1H | 7.1 | 146 | 1 | 0.45 | 0.40 | 0.3 | 0.07 |
| *9 | 6.5 | 134 | 0.60 | 0.25 | 0.22 | 0.7 | 0.02* |
| *12 | 3.0 | 62 | 0 | 0.20 | 0.09 | 1 | 0.07 |
| *14 | 4.1 | 85 | 1 | 0.85 | 0.70 | 0.1 | 0.5 |
| *21 | 0.9 | 18 | 0.74 | 0.75 | 0.49 | 0.8 | 0.6 |
| P-valuei | 0.007 | 0.00072 | 0.00065 |
aHaplotype names follow official recommendations with the addition of *1A(51A) for clarity.
bPercent minor allele frequency among European American-dependent smokers.
cTotal number of alleles among European American-dependent smokers.
dNormalized allele parameters assumed in the predictive model derived from in vivo metabolism measurements in 189 European Americans (6). 1 = full normal activity; 0 = null activity.
eNormalized allele parameters determined by maximizing the association between CPD and the predicted metabolism metric, varying each parameter individually while maintaining all other parameters according to the original experimentally derived model.
fNormalized allele parameters determined by maximizing the association between CPD and the predicted metabolism metric following an EM algorithm until it converged (iteration 5, see Materials and Methods).
gP refers to the statistical likelihood that the allele parameter is not equal to null activity by chance, comparing the fits of the association with CPD using the ‘final fit’ parameters or the same parameters except changing the single allele parameter to ‘0’.
hP refers to the statistical likelihood that the allele parameter is not equal to full normal activity by chance, comparing the fits of the association with CPD using the ‘final fit’ parameters or the same parameters except changing the single allele parameter to ‘1’.
iOverall P-value for the association between CPD and the predicted metric using each set of parameters.
To further test the robustness of the model, we evaluated its suitability by relaxing the initial assumptions and recalculated the predicted metric using models that differ systematically from the original model in particular groups of allele parameters. Figures 3–6 show the significance of the fits of such models with attention to two relatively common alleles newly introduced to the model, *1H in European Americans and *17 in African Americans. In each pair of figures, an array of models is evaluated scanning the full range of biologically meaningful parameter values for the new allele and either all assumed fully-functional reference alleles or all assumed null alleles (Figures 3–6). Parameter scans of *1H in European American-dependent smokers demonstrate that a best-fitting estimate for the allele's activity lies consistently between the null and the reference alleles regardless of changes in the assumed parameters for those alleles (Figs 3 and 4). In the case of *17 (Figs 5 and 6), best-fitting parameter estimates are consistent with *17 having activity well above the assumed null activity (Fig. 6), but not statistically distinguishable from the reference alleles—i.e. the best-fitting models lie near the diagonal, where parameters for *17 and the reference alleles are equal (Fig. 5).
Figure 3.
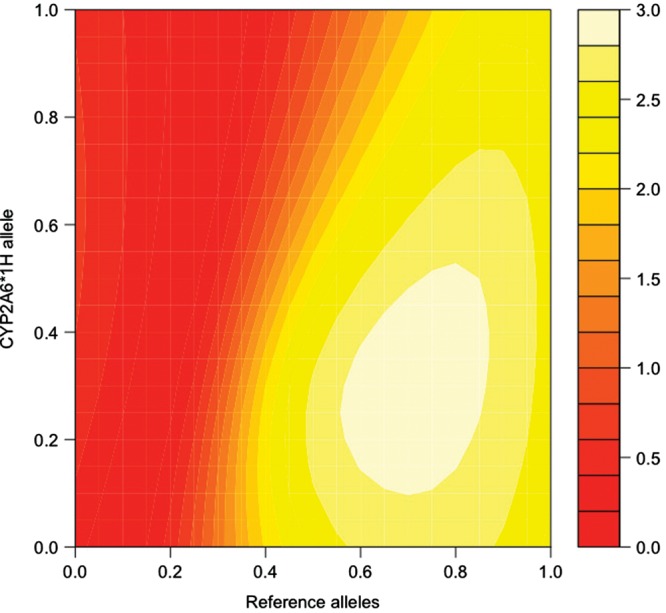
CYP2A6*1H and reference alleles, modeling the association with the estimated metric in dependent European Americans. The fit of the association between CPD and the predicted metabolism metric determined by the model, scanning allele parameters used to calculate the prediction between zero activity (0.0) and maximum activity (1.0). Essentially, the map demonstrates a variety of possible models, with differing relationships between their allele parameters, and the relative ability of each model to predict a metabolism metric that is significantly correlated with CPD. Points along the diagonal from lower left to upper right correspond to models where the two scanned parameters are equal. Reference alleles are all alleles excluding CYP2A6*1A, *2, *4, *9, *12 and the scanned allele *1H. The color key refers to the –log10 of the P-value for the association between the metabolism metric and CPD in dependent European Americans. Coordinates color coded as >1.3 (orange) represent significant associations (P < 0.05).
Figure 4.
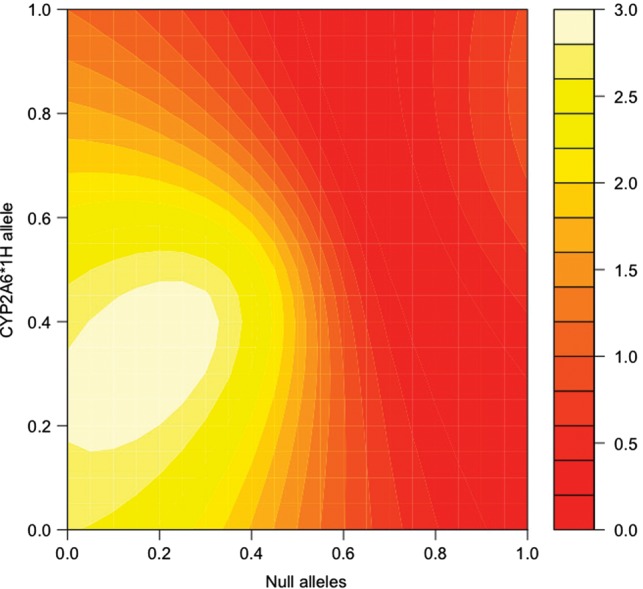
CYP2A6*1H and null alleles, modeling the association with the estimated metric in dependent European Americans. The fit of the association between CPD and the predicted metabolism metric determined by the model, scanning allele parameters used to calculate the prediction between zero activity (0.0) and maximum activity (1.0). Essentially, the map demonstrates a variety of possible models, with differing relationships between their allele parameters, and the relative ability of each model to predict a metabolism metric that is significantly correlated with CPD. Points along the diagonal from lower left to upper right correspond to models where the two scanned parameters are equal. Assumed null alleles are CYP2A6*2, *4 and *12. The color key refers to the –log10 of the P-value for the association between the metabolism metric and CPD in dependent European Americans. Coordinates color coded as >1.3 (orange) represent significant associations (P < 0.05).
Figure 5.
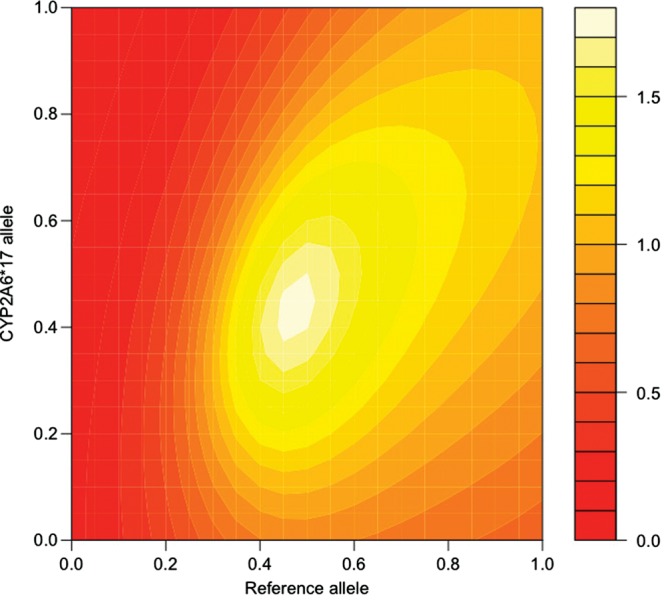
CYP2A6*17 and reference alleles, modeling the association with the estimated metric in dependent African Americans. The fit of the association between CPD and the predicted metabolism metric determined by the model, scanning allele parameters used to calculate the prediction between zero activity (0.0) and maximum activity (1.0). Essentially, the map demonstrates a variety of possible models, with differing relationships between their allele parameters, and the relative ability of each model to predict a metabolism metric that is significantly correlated with CPD. Points along the diagonal from lower left to upper right correspond to models where the two scanned parameters are equal. Reference alleles are all alleles excluding CYP2A6*1A, *2, *4, *9, *12 and the scanned allele *17. The color key refers to the –log10 of the P-value for the association between the metabolism metric and CPD in dependent African Americans. Coordinates color coded as >1.3 (dark yellow) represent significant associations (P < 0.05).
Figure 6.
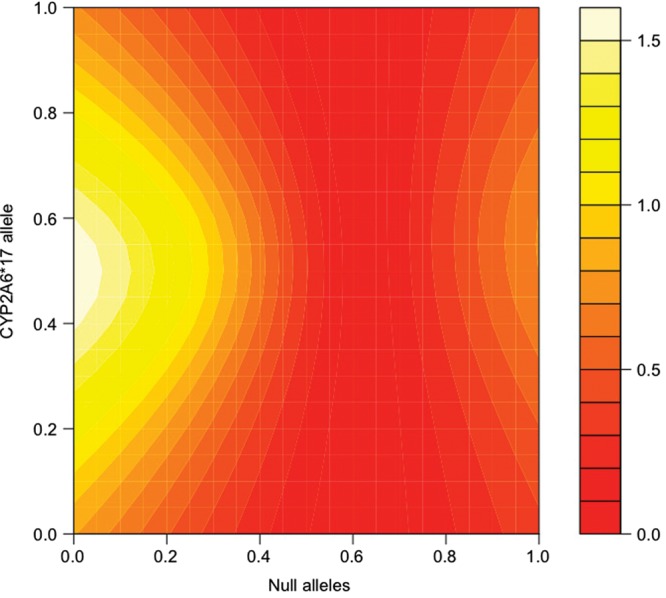
CYP2A6*17 and null alleles, modeling the association with the estimated metric in dependent African Americans. The fit of the association between CPD and the predicted metabolism metric determined by the model, scanning allele parameters used to calculate the prediction between zero activity (0.0) and maximum activity (1.0). Essentially, the map demonstrates a variety of possible models, with differing relationships between their allele parameters, and the relative ability of each model to predict a metabolism metric that is significantly correlated with CPD. Points along the diagonal from lower left to upper right correspond to models where the two scanned parameters are equal. Assumed null alleles are CYP2A6*2, *4 and *12. The color key refers to the –log10 of the P-value for the association between the metabolism metric and CPD in dependent African Americans. Coordinates color coded as >1.3 (dark yellow) represent significant associations (P < 0.05).
Additionally, in order to estimate a set of new allele parameters that collaboratively optimize the model, an expectation–maximization (EM) algorithm (18) was followed to iteratively vary parameters maximizing the association between CPD and the predicted metric (see Materials and Methods). Final parameter estimates produced by this algorithm (Tables 5 and 6) did not vary widely from those determined by the initial maximization step.
To confirm the value of these procedures to estimate new allele parameters based on the association with CPD, we used the final parameters determined in European Americans from the COGEND set (Table 6) to recalculate the estimated metabolism metric in NAG nicotine-dependent smokers. Use of these new parameters improved the model fit and statistical significance of the association (from P= 0.044 to 0.0036), a statistically significant improvement (P= 0.02), demonstrating that the optimization did not merely over-fit the first data set and allowed improvement of the model without further in vivo measurements.
Genome-wide significant associations with CPD and functional variants of CYP2A6
The region of chromosome 19 surrounding CYP2A6 is one of the four loci recently identified as associated with CPD with genome-wide significance in large studies of Europeans (10,11). The most significant SNP identified in a study of >60 000 subjects (10), rs4105144, is >2 kb 5′ of the CYP2A6 transcription start site and in LD (D′ = 1) with rs1801272, the defining SNP in the *2 CYPA6 null allele. The authors speculated that rs4105144 is more significantly associated with CPD than rs1801272 because it has a higher allele frequency (29.6%) than rs1801272 (3.9%) and is likely in LD with further unidentified loss-of-function CYP2A6 alleles (10). Our genotyping in CYP2A6 confirms that the minor alleles of rs61663607 (G) and rs1137115 (A) lie on the background of the minor allele of rs4105144 (D′ = 1), whereas rs61663607A–rs1137115G alleles lie on the background of the rs4105144 major allele (D′ = 0.953) in European Americans. Therefore, the minor allele of rs4105144 marks common slow-metabolizing alleles,*1A(51A) (6), *1H and *2 (19), while the major allele marks common normal metabolizing alleles, *1B and *1D (6), along with the slow-metabolizing allele, *9.
It is also possible that due to the complications of genotyping in this locus, the genome-wide significant result reported for rs4105144 (10) also reflects the impact of important copy-number variants, including *4 and *12 (Table 1). rs4105144 is an exceedingly difficult polymorphism to accurately genotype. It is located in a region of very high similarity to at least three other chromosomal regions in the reference genome, 5′ of CYP2A7, CYP2A13 and a pseudogene. The 200 bp surrounding rs4105144 is 88–97% identical to these three regions. Genotyping such a SNP therefore relies upon the ratio of major to minor alleles across all four regions; copy number variation or other polymorphism in any and all of these loci, depending on the primers and probes used in the particular genotyping method, will affect this ratio and lead to difficulty determining homozygote and heterozygote calls. Furthermore, because the minor allele of rs41405144 (T) is also the fixed allele in the other three regions, deletion alleles are generally erroneously called as the minor allele (see Supplementary Material, Fig. S1). We genotyped rs41405144 in all or part of COGEND by three different methods (Sequenom, Taqman, direct Sanger sequencing) and found the results difficult to interpret, especially in the case of deletion alleles: deletion homozygotes (−/−, i.e. *4/*12) were invariably called as minor allele homozygotes (T/T), and major allele hemizygotes (C/−) were generally called as heterozygotes (C/T). It is likely that rs41405144 has been previously erroneously reported as in LD with other SNPs that are in disequilibrium with deletion alleles, and that rs41405144, as reported, represents the combined impact of most of the common CYP2A6 loss-of-function alleles in Europeans, including copy number variants. rs41405144 is not part of any commercially available genotyping chip, and the SNP was imputed for the majority of the sample in the GWAS based on the Phase II CEU HapMap samples (10). Furthermore, dramatically different minor allele frequencies among Europeans are reported for rs41405144 according to HapMap and 1000 Genomes pilot-1 data (http://www.ncbi.nlm.nih.gov). This is most likely due to differences in allele calling rather than true frequency differences across populations.
The story is different for rs3733829, the most significant chromosome 19 SNP identified in another recent study (11), and located 40 kb 3′ of CYP2A6 in an exon of the EGLN2 gene. There was no difficulty genotyping rs3733829, a common SNP in European Americans (minor allele frequency = 0.37) and we also found a significant association with CPD among European American-dependent smokers (n= 1041, P= 0.006). Although the LD in European Americans between rs3733829 and all of the individual CYP2A6 polymorphisms determined in European Americans in this study (Table 1) is very low (R2= 0.08 for rs1137115, and R2≤ 0.01 for all other SNPs, Fig. 7), a preponderance of slower-metabolizing CYP2A6 alleles (*1A, *1H, *2, *4, *9, *12) fall on the major allele; 46% of rs3733829 major allele haplotypes carry slow-metabolizing CYP2A6 variants, whereas only 20% of minor allele haplotypes carry slow-metabolizing variants. However, the associations between CPD and rs3733829, and with the metabolism metric predicted from CYP2A6 genotype, both remain statistically significant in a multivariate regression, demonstrating that they are in part independent of one another.
Figure 7.
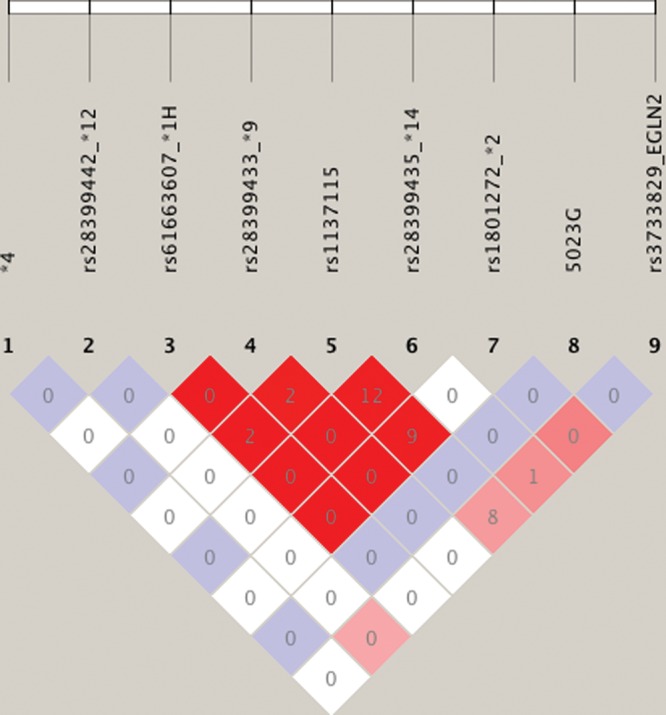
LD (R2 and D′) plot of functional variants in CYP2A6 and rs3733829 in EGLN2 among European Americans. *4 refers to the CYP2A6 deletion allele. Numbers represent the R2 value expressed as a percentile. Red squares represent pairs with logarithm of odds (LOD) scores for LD ≥ 2 and D′ = 1.0, pink represent LOD ≥ 2 and D′ < 1.0, blue represent D′ = 1 but LOD < 2, white squares represent LOD < 2 and D′ < 1.0. Plot generated using HaploView v4.2.
We were also able to directly test the association between rs3733829 genotype and nicotine metabolism following oral administration as previously determined in 189 European Americans (6). rs3733829 is significantly associated with the measured nicotine metabolism metric (P= 0.0007); however, it ceases to be a significant predictor in a multivariate regression model that includes slow-metabolizing CYP2A6 haplotypes (*1A, *2, *4, *9, *12), demonstrating that the association between rs3733829 and the measured metabolism metric is not independent of CYP2A6 genotype. However, the relatively small amount of variance in measured metabolism explained by rs3733829 genotype (R2= 0.05) would not appear to account for its association with CPD. The single most important individual predictor of nicotine metabolism in European Americans, rs1801272, explains a considerably larger portion of the variance in nicotine metabolism (R2= 0.14) (6), yet fails to be individually significantly associated with CPD in this study (Table 4). Therefore, we propose that the association between rs3733829 and CPD demonstrated here and elsewhere (11) is a synthetic association (16) accounted for by several CYP2A6 alleles, as well as other genetic factors on chromosome 19 associated with smoking behavior but independent of variation in the metabolism of nicotine to cotinine following oral administration.
DISCUSSION
The region of chromosome 19 surrounding the CYP2A6 gene is an exemplar of highly heterogeneous loci associated with complex human phenotypes. The largest contributor to nicotine metabolism, CYP2A6 is highly polymorphic, including multiple common null and intermediate-activity alleles in all studied populations, as well as less-frequent alleles with uncertain activities. Associations between CYP2A6 genotype and smoking phenotypes have previously been tested by dividing subjects into broad categories based on CYP2A6 diplotype, but this method suffers from important shortcomings: out of convenience, it forces an essentially continuous trait to be treated as an ordinal variable, divisions are arbitrary according to the genotype distribution in a given data set and made according to the assumptions of the experimenter based on a variety of evidence about different alleles. Thus, comparisons can vary widely depending on how diplotypes are categorized and the prevalence of different alleles in study populations. We previously set out to develop a predictive model to translate CYP2A6 genotype into a single continuous variable based on a measured nicotine metabolism endophenotype, for use in further genetic studies (6). Use of this model limits bias by defining parameters based on a single uniform body of experimental data without interpretation; the only assumptions made were in classifying known null alleles, CYP2A6*2 and *4. It does not, for example, differentiate between genetic variants that alter gene expression, mRNA splicing or stability, enzymatic function or any combination of effects. Because the model translates CYP2A6 genotype into a continuous variable, the association between genotype and phenotype can also be measured across an entire sample rather than only comparing the extremes of genotype based on assumed categories. We do not assume that the metric determined in the original in vivo experiment is the best possible measure for relating genotype to smoking phenotypes, but the significant association demonstrated here provides strong evidence that the metric is a physiologically relevant proxy for CYP2A6 activity.
A further valuable utility of a predictive model of gene function is that optimization of the model to fit a robust phenotype association can be used to generate testable quantitative hypotheses about model parameters. Such has been previously employed to predict thermodynamic parameters governing molecular interactions between transcription factors and DNAs in a pathway associated with sporulation efficiency in Saccharomyces cerevisiae (20). Here, we attempt to optimize our model using the robust association with CPD in humans to predict the relative impact of new CYP2A6 alleles upon nicotine metabolism. These results are naturally limited by sample size and allele frequencies, but new allele parameters following optimization of the model separately in European Americans and African Americans generally conform to prior reports of allele function, including designating CYP2A6*12 (6,21) and *20 (22) as null alleles, and *1H, *23 and *17 (23,24) as reduced function alleles. Importantly, estimation of new allele parameters, derived from the COGEND data set, without assumptions about new allele activities, significantly improved the association between the predicted metabolism metric and CPD in a second independent data set (the Nicotine Addition Genetics Project), demonstrating that the procedure did not merely over-fit the data. Considering the allele frequencies and magnitude of changes to the parameters, this improvement was due largely to the inclusion of the CYP2A6*1H allele. *1H, defined by the polymorphism −745G (rs61663607), which disrupts a CCAAT box in the 5′ promoter region, has been shown to reduce protein expression according to an in vitro luciferase assay (25), and is common among both European (7.3%) and African Americans (10.5%). To our knowledge, the allele has not yet been associated with in vivo nicotine metabolism or CPD. In our previous study of 189 European Americans, including 30 *1H alleles, we found a suggestive effect of *1H on in vivo nicotine metabolism, but not one sufficiently statistically different from an assumed full activity reference allele (P= 0.056) to include *1H in the predictive model. Here, we provide further evidence, indirectly through the association with CPD, that *1H differs functionally from other CYP2A6*1 alleles in Europeans. Notably, different parameters for the *1H allele were estimated for European and African American smokers. However, the variant allele, rs61663607G, used to define *1H in this study is in high R2 with at least eight other non-coding SNPs throughout the CYP2A6 gene in Europeans (26), any of which could also contribute to the association between *1H and lower CPD or slower metabolism, and LD between these markers differs in Africans.
Interestingly, duplication alleles among African Americans were predicted to be loss-of-function alleles, consistent with the exceptionally slow metabolism previously reported in a subject of African descent possessing at least three copies of CYP2A6 (24). Duplication alleles identified in subjects of African descent are not the same as those found in Europeans and Asians, and the activity of these alleles relative to a single copy of the reference allele is not settled (24,27). Future corroboration of reduced activity in the common duplication allele among African Americans would serve to affirm the value of the approach presented here in predicting the activity of novel variants. The prediction of haplotypes carrying the minor allele of rs28399440 (amino acid change F118L) as null alleles also led us to further investigate with Sanger sequencing and confirm that eight of nine rs28399440 carriers among dependent smokers analyzed carried *26 (F118L, R128, S131A) or *27 (F118L, R203Frameshift) alleles, both previously confirmed as null alleles in vitro (24). This result demonstrates both the power of the method to make useful predictions for relatively rare alleles, and the danger of not accounting for complete haplotypes.
These results highlight the potential difficulties of identifying genetic associations in highly polymorphic loci with multiple common variants impacting gene function. It has been hypothesized, with a few likely examples given, that significant genetic associations found by genome-wide studies may be caused by LD with multiple less-frequent variants that directly impact phenotype (16). We find this to be the case with rs4105144, the intergenic SNP adjacent to CYP2A6 recently found to be genome-wide significantly associated with CPD (10). We find that the minor allele of rs4105144 marks most loss-of-function CYP2A6 alleles found commonly in Europeans. Additionally, we find that rs3733829, a SNP located in the EGLN2 gene 40 kb away from CYP2A6, and previously reported to be associated with CPD, is also associated with measured nicotine metabolism due to its complex LD with multiple CYP2A6 polymorphisms. However, rs3733829 is a relatively poor proxy for CYP2A6 genotype or measured nicotine metabolism, indicating a more complex story likely involving further unidentified factors.
The distinction between nicotine dependence and cigarette consumption as phenotypes in genetic studies of smoking behavior is underscored by the results presented here. As has been previously asserted, it is reasonable to expect that titration of plasma nicotine level by cigarette consumption should occur only in dependent smokers (13,28). CYP2A6 genotype may not be the only factor that is associated with cigarette consumption but not associated with progression to dependence itself, and as such, the power of studies to detect genetic associations with phenotypes such as consumption may be improved by excluding participants with insufficient symptoms to qualify as nicotine dependent. This is especially evident among African Americans, among whom nicotine dependence is less correlated with CPD than among European Americans. Indeed, the significant association between inferred metabolism and CPD among African Americans identified here required the inclusion of low-CPD nicotine-dependent subjects indistinguishable by CPD from non-dependent subjects. This is the first study to demonstrate that an association between CYP2A6 and cigarette consumption holds among African Americans despite large differences in mean CPD between African American and European American populations.
The path drawn between the CYP2A6 gene, nicotine metabolism and cigarette consumption represents a uniquely straightforward opportunity to connect a complex phenotype to genotype via a predictive model of allelic activity. This model is especially useful because determination of genotype or CPD is relatively easy and inexpensive, whereas direct measurement of nicotine metabolism is not always possible, especially in existing data sets. But metabolism is by no means the only scenario where these methods might be applied and the example of CYP2A6 could point the way to similar investigations of phenotypes and genetic pathways of greater complexity.
MATERIALS AND METHODS
Study subjects
This study complies with the Code of Ethics of the World Medical Association and obtained informed consent from participants and approval from the appropriate Washington University institutional review boards. COGEND is a multi-site project in the USA (29) designed to recruit dependent smokers (FTND ≥ 4) and non-dependent smokers (FTND = 0 among European Americans or FTND = 0–1 among African Americans). All subjects analyzed were self-identified as being of European or African American ancestry, and race was previously verified using EIGENSTRAT (30). Sample demographics were previously described (29,31).
The NAG recruited subjects from two different sites: the Queensland Institute of Medical Research (QIRM) in Australia and the University of Helsinki in Finland (32). For the purposes of this project, only information from the Australian arm of the NAG was used. Families were identified through heavy-smoking index cases by the use of previously administered interview and questionnaire surveys of the community-based Australian register of twins, including two cohorts of the Australian Twin Panel, which included spouses of the older of these two cohorts. The ancestry of the Australian samples is predominantly Anglo-Celtic or northern European (>90%).
Phenotype
Smoking phenotypes were assessed by direct interview. Current CPD was determined in COGEND by the question ‘On the days you smoked in the past 12 months, about how many cigarettes did you usually have per day’. Subjects who had not smoked in the previous 12 months did not provide this measure of CPD. CPD was also analyzed as a four-level categorical trait (CPD ≤ 10, 10 < CPD ≤ 20, 20 < CPD ≤ 30 and CPD > 30), as in previous studies (33).
Genotyping
Polymorphism nomenclature follows official recommendations (http://www.cypalleles.ki.se/cyp2a6.htm) except that CYP2A6*1A is defined by the A allele of rs1137115 throughout. TaqMan CNV assay, Hs00010002_cn (Applied Biosystems, Foster City, CA, USA), was used to determine CYP2A6 copy number. Copy number variation was analyzed by real-time PCR using an ABI-7900 real-time PCR system. Each real-time PCR run included within-plate duplicates and an RNase P reference assay. CopyCaller v1.0 software (Applied Biosystems) was used to interpret results. SNPs were genotyped by a variety of methods: among the majority of subjects, rs1137115 and rs28399435 were previously determined using a custom designed array (29). The remaining subjects were genotyped for rs1137115 and rs28399435 using the KBioscience Competitive Allele Specific PCR genotyping system (KASPar, KBioscience, Hoddesdon, Herts, UK) (Supplementary Material, Table S2). Carriers of the minor alleles of the SNPs that define the CYP2A6*28 allele, rs28399463 and rs8192730, were initially identified using a PCR assay with the reverse primer TAAACTGCCCCTTgTCATcC, where the lower case nucleotides indicate the SNP positions, and forward primer GTCCCCCAAACTCCTGCCTAGA, and measured using SYBR-Green reagent in a 7900HT Fast Real-Time PCR System (Applied Biosystems) under the following conditions: 20 μl volume containing 2× SYBR-Green Fast Mix (Applied Biosystems) and 400 nm each primer; PCR profile: 50°C 2 min, 95°C 10 min, followed by 40 cycles of 15 s at 95°C and 1 min 63°C. All *28 positive subjects were confirmed, and zygosity determined, by Sanger sequencing using primers following Haberl et al. (26).
A subset of minor allele carriers for rs28399442 were confirmed as carriers of the CYP2A6*12 allele using a PCR assay following Haberl et al. (26). rs4105144 was interrogated by Taqman (assay C_43815914_10, Applied Biosystems), Sequenom (Supplementary Material, Table S2) and Sanger sequencing using the primers CTGTGTGGAGGGAACAAAGG and CAGGCCCAGGTGCAGACT. All fragments to be sequenced were amplified under the same conditions [25 μl volume containing 5× GoTaq Flexi buffer (Promega), 5× Q-Solution (Qiagen), 100 μm each dNTP, 400 nm each primer, 1.25 GoTaq Polymerase (Promega); PCR profile: 94°C followed by 34 cycles of 45 s at 94°C, 45 s at 62°C and 1 min at 72°C]. DNA sequence was analyzed using Sequencher software (v4.7, Gene Codes Corp). rs61663607 was genotyped by both a custom TaqMan assay (Applied Biosystems) and a custom KASPar assay (KBioscience) (Supplementary Material, Table S2). rs3733829 was genotyped using TaqMan assay, C_2883084_1 (Applied Biosystems). All other SNPs were genotyped by KASPar or Sequenom MassARRAY according to the recommended procedures (KASPar, KBioscience, Hoddesdon; MassARRAY, Sequenom, San Diego CA, USA) with custom designed primers summarized in Supplementary Material, Table S2. KASPar assays were set up as 10 or 20 μl reactions and measured with the 7500 or 7900HT Fast Real- Time PCR Systems (Applied Biosystems). To type rs61736436, PCR products were first generated using primers originally designed to identify a 3′ gene conversion reported to coincide with the minor allele of rs61736436 (24), TGCAAGTGTACCTGGCAGGAAA and CGCATCTTCCCCCCATTCTTATA (26). This product was used as template in the subsequent KASPar reaction. To enhance genotyping efficiency, SNPs with low minor allele frequencies genotyped by KASPar or using the Syber-Green reagent (rs28399440, rs28399444, rs56256500, rs61736436, rs6413474 and rs72549432) were initially genotyped in pools of eight subjects; this method was generally sensitive enough to estimate the number of minor alleles in a pool; subjects from minor allele positive pools were subsequently genotyped individually. KASPar assays for low- frequency minor-allele SNPs were confirmed by Sanger sequencing using primers following Haberl et al. (26). rs4986891, rs59552350 and rs28399445 were typed in rs28399440 minor allele carriers by Sanger sequencing (26).
Haplotype and diplotype determination
Diplotypes were initially assigned to all subjects based on seven polymorphisms previously found associated with measured nicotine metabolism (6). Individuals determined to carry three copies of CYP2A6 were assumed to be heterozygous for a CYP2A6*1X2 duplication allele. Individuals determined to carry only one copy of the gene were assumed to be heterozygous for a CYP2A6*4 deletion allele. No subjects were determined to carry 0 or >3 copies of CYP2A6. Based on previous Sanger sequencing in 189 individuals including 9 CYP2A6*12 carriers, rs28399442 and rs55925467 were genotyped as potential proxies for the *12 allele. All rs28399442 minor allele heterozygotes were also heterozygous for the minor allele of rs55925467; however, 14 of 130 rs55925467 minor allele carriers were homozygous for the major allele of rs28399442. These 14 subjects and a group of rs28399442 heterozygotes, including all 8 African American rs28399442 heterozygotes, were tested for the presence of the *12 allele with a PCR assay (26). All assayed rs28399442 minor allele carriers were positive for the *12 allele, whereas all rs28399442 major allele homozygotes were negative. rs28399442 was subsequently used as a proxy for the *12 allele. Consistent with prior reports, rs1137115, rs1801272, rs28399433 and rs28399435 were determined to have D′ = 1 with each other in the genotyped sample (n= 2497). rs1137115 minor allele haplotypes were defined as CYP2A6*1A(51A) except for rs1801272 and rs28399433 minor allele carriers, defined as CYP2A6*2 and CYP2A6*14 carriers, respectively. rs28399433 minor allele haplotypes were defined as CYP2A6*9. In one subject, a carrier for the *38 and *12 alleles, the polymorphisms were assumed to lie on different chromosomes, as previously described (6). rs61663607 minor allele haplotypes were defined as CYP2A6*1H with the exception of African Americans determined to carry three copies of CYP2A6; 83.3% of these subjects were rs61663607 minor allele (G) carriers, whereas none of the European Americans determined to carry three CYP2A6 copies carried the rs61663607G allele; all other typed polymorphisms were assumed not to fall on the duplication allele. LD with rs3733829 was determined using Haploview (34).
Statistical analysis
Statistical analyses were performed using the software package ‘R’ (R Foundation for Statistical Computing, Vienna, Austria). All t-tests performed were two-sided. Analyses were performed separately on European and African American samples. Regression analyses in the NAG data set were performed in Stata (StataCorp, College Station, TX, USA) using the ‘robust cluster’ feature to correct for family relationships.
The predicted nicotine metabolism metric for all subjects was calculated from CYP2A6 diplotype based on the previously published model (6). Briefly, the original parameters were derived from the regression, log (1−metric) = log(α) + log(βH1) + log(βH2). The metabolism metric can be calculated for any genotyped subject by the equation:
where α is the intercept, βH1 represents the first CYP2A6 haplotype and βH2 represents the second haplotype for each subject. To calculate the metric in terms of the original experimental results, derived from the percent deuterated nicotine converted to deuterated cotinine 30 min after oral administration of deuterated nicotine in 189 European American subjects (6) the parameters are:
α = 0.56;
β = 1.00 for CYP2A6*2, *4, *12 and *38 (null alleles);
0.65 for CYP2A6*9;
0.57 for CYP2A6*1A(51A);
0.42 for all other CYP2A6 haplotypes.
In Tables 5 and 6, re-estimated parameters for all alleles in European and African Americans are normalized to range between 0 (null) and 1 (full activity). The actual haplotype parameters, for use in the above equation, are also provided in Supplementary Material, Table S3.
To test associations with further CYP2A6 alleles, genotype at the defining SNP was first included in a multivariate regression together with the predicted metric estimate. Haplotype and SNP variables were coded as number of alleles (0–2) and copy number as number of CYP2A6 copies (1–3, no deletion homozygotes were identified). To estimate parameters for the new alleles initially, diplotypes were recoded and the best association between the predicted metric and CPD was determined for each individual allele, varying the parameter for each tested allele between 0.42 and 1. Subsequently, to test the possibility of estimating new parameters for all genotyped alleles from the association with CPD, this procedure was then repeated iteratively for every allele (minor allele frequency > 0.5% by ethnicity), only assuming the *2 and *4 alleles to have zero activity (parameter = 1) and all alleles not differentiated by the model to have full activity (parameter = 0.42); the assumed activities of these alleles act as reference anchors from which the relative activities of other alleles can be estimated. Following a simple EM algorithm (18), beginning with the experimentally derived parameters, the best-fitting parameters determined individually for each allele were inputted into the model in the subsequent iteration until the algorithm converged. To display parameter estimates intuitively in tables, estimates were subtracted from 1 and normalized, so that all parameter estimates range between of 0 and 1, corresponding to assumed zero and full activity, respectively. P-values in Tables 5 and 6 were determined from the Chi-squared distribution of the test statistic D, defined as two times the difference between the log likelihood computed for two competing models: the first model was the association between CPD and the metabolism metric, where the metric was calculated using the final parameters determined by the EM algorithm; for P ≠ 0 the alternative model was identical except that the metric was recalculated changing one parameter to zero activity; for P ≠ 1 the alternative model was identical except that the metric was recalculated changing one parameter to full activity (see above).
Figures 3–6 were generated by recalculating the metabolism metric varying the undetermined parameters in 20 steps between 0 and 1 and plotting the P-values of the associations between the recalculated metric values and CPD in the subsets of subjects. To display the parameter values along the axes more intuitively, the range was inverted so that 0 corresponds to the model parameter 1 (zero activity) and 1 corresponds to the model parameter 0 (maximum activity).
SUPPLEMENTARY MATERIAL
FUNDING
This work was supported by funding from the National Institutes of Health, grants T32 MH014677-32 (A.J.B.), CA089392 (J.P.R., S.E.M., L.J.B. and A.G.), CA77598 (S.E.M.), DA021237 (L.J.B.), DA12854 (P.A.M.), DA027995 (O.H. and P.A.M.) and DA025888 (L.J.B.).
Supplementary Material
ACKNOWLEDGEMENTS
The authors wish to thank and mention the following: investigators directing data collection for COGEND are Laura Bierut, Naomi Breslau, Dorothy Hatsukami and Eric Johnson. Data management is organized by Nancy Saccone and John Rice. Laboratory analyses are led by Alison Goate. Data collection is supervised by Tracey Richmond.
Conflict of Interest statement. L.J.B., A.G. and J.P.R. are listed as inventors on Issued US Patent 8,080,371, ‘Markers for Addiction’ covering the use of certain SNPs in determining the diagnosis, prognosis and treatment of addiction.
REFERENCES
- 1.Schoedel K.A., Hoffmann E.B., Rao Y., Sellers E.M., Tyndale R.F. Ethnic variation in CYP2A6 and association of genetically slow nicotine metabolism and smoking in adult Caucasians. Pharmacogenetics. 2004;14:615–626. doi: 10.1097/00008571-200409000-00006. [DOI] [PubMed] [Google Scholar]
- 2.Benowitz N.L., Pomerleau O.F., Pomerleau C.S., Jacob P., 3rd Nicotine metabolite ratio as a predictor of cigarette consumption. Nicotine Tob. Res. 2003;5:621–624. doi: 10.1080/1462220031000158717. [DOI] [PubMed] [Google Scholar]
- 3.Jarvik M.E., Madsen D.C., Olmstead R.E., Iwamoto-Schaap P.N., Elins J.L., Benowitz N.L. Nicotine blood levels and subjective craving for cigarettes. Pharmacol. Biochem. Behav. 2000;66:553–558. doi: 10.1016/s0091-3057(00)00261-6. [DOI] [PubMed] [Google Scholar]
- 4.Strasser A.A., Lerman C., Sanborn P.M., Pickworth W.B., Feldman E.A. New lower nicotine cigarettes can produce compensatory smoking and increased carbon monoxide exposure. Drug Alcohol Depend. 2007;86:294–300. doi: 10.1016/j.drugalcdep.2006.06.017. [DOI] [PubMed] [Google Scholar]
- 5.Hatsukami D.K., Lemmonds C., Zhang Y., Murphy S.E., Le C., Carmella S.G., Hecht S.S. Evaluation of carcinogen exposure in people who used ‘reduced exposure’ tobacco products. J. Natl Cancer Inst. 2004;96:844–852. doi: 10.1093/jnci/djh163. [DOI] [PubMed] [Google Scholar]
- 6.Bloom J., Hinrichs A.L., Wang J.C., von Weymarn L.B., Kharasch E.D., Bierut L.J., Goate A., Murphy S.E. The contribution of common CYP2A6 alleles to variation in nicotine metabolism among European-Americans. Pharmacogenet. Genomics. 2011;21:403–416. doi: 10.1097/FPC.0b013e328346e8c0. [DOI] [PMC free article] [PubMed] [Google Scholar]
- 7.Hukkanen J., Jacob P., 3rd, Benowitz N.L. Metabolism and disposition kinetics of nicotine. Pharmacol. Rev. 2005;57:79–115. doi: 10.1124/pr.57.1.3. [DOI] [PubMed] [Google Scholar]
- 8.Audrain-McGovern J., Al Koudsi N., Rodriguez D., Wileyto E.P., Shields P.G., Tyndale R.F. The role of CYP2A6 in the emergence of nicotine dependence in adolescents. Pediatrics. 2007;119:e264–e274. doi: 10.1542/peds.2006-1583. [DOI] [PubMed] [Google Scholar]
- 9.O'Loughlin J., Paradis G., Kim W., DiFranza J., Meshefedjian G., McMillan-Davey E., Wong S., Hanley J., Tyndale R.F. Genetically decreased CYP2A6 and the risk of tobacco dependence: a prospective study of novice smokers. Tob. Control. 2004;13:422–428. doi: 10.1136/tc.2003.007070. [DOI] [PMC free article] [PubMed] [Google Scholar]
- 10.Thorgeirsson T.E., Gudbjartsson D.F., Surakka I., Vink J.M., Amin N., Geller F., Sulem P., Rafnar T., Esko T., Walter S., et al. Sequence variants at CHRNB3-CHRNA6 and CYP2A6 affect smoking behavior. Nat. Genet. 2010;42:448–453. doi: 10.1038/ng.573. [DOI] [PMC free article] [PubMed] [Google Scholar]
- 11.Tobacco and Genetics Consortium. Genome-wide meta-analyses identify multiple loci associated with smoking behavior. Nat. Genet. 2010;42:441–447. doi: 10.1038/ng.571. [DOI] [PMC free article] [PubMed] [Google Scholar]
- 12.Pomerleau O.F., Collins A.C., Shiffman S., Pomerleau C.S. Why some people smoke and others do not: new perspectives. J. Consult. Clin. Psychol. 1993;61:723–731. doi: 10.1037//0022-006x.61.5.723. [DOI] [PubMed] [Google Scholar]
- 13.Malaiyandi V., Sellers E.M., Tyndale R.F. Implications of CYP2A6 genetic variation for smoking behaviors and nicotine dependence. Clin. Pharmacol. Ther. 2005;77:145–158. doi: 10.1016/j.clpt.2004.10.011. [DOI] [PubMed] [Google Scholar]
- 14.Liu T., David S.P., Tyndale R.F., Wang H., Zhou Q., Ding P., He Y.H., Yu X.Q., Chen W., Crump C., et al. Associations of CYP2A6 genotype with smoking behaviors in southern China. Addiction. 2011;106:985–994. doi: 10.1111/j.1360-0443.2010.03353.x. [DOI] [PMC free article] [PubMed] [Google Scholar]
- 15.Malaiyandi V., Lerman C., Benowitz N.L., Jepson C., Patterson F., Tyndale R.F. Impact of CYP2A6 genotype on pretreatment smoking behaviour and nicotine levels from and usage of nicotine replacement therapy. Mol. Psychiatry. 2006;11:400–409. doi: 10.1038/sj.mp.4001794. [DOI] [PubMed] [Google Scholar]
- 16.Dickson S.P., Wang K., Krantz I., Hakonarson H., Goldstein D.B. Rare variants create synthetic genome-wide associations. PLoS Biol. 2010;8:e1000294. doi: 10.1371/journal.pbio.1000294. [DOI] [PMC free article] [PubMed] [Google Scholar]
- 17.Goldstein D.B. The importance of synthetic associations will only be resolved empirically. PLoS Biol. 2011;9:e1001008. doi: 10.1371/journal.pbio.1001008. [DOI] [PMC free article] [PubMed] [Google Scholar]
- 18.Do C.B., Batzoglou S. What is the expectation maximization algorithm? Nat. Biotechnol. 2008;26:897–899. doi: 10.1038/nbt1406. [DOI] [PubMed] [Google Scholar]
- 19.Yamano S., Tatsuno J., Gonzalez F.J. The CYP2A3 gene product catalyzes coumarin 7-hydroxylation in human liver microsomes. Biochemistry. 1990;29:1322–1329. doi: 10.1021/bi00457a031. [DOI] [PubMed] [Google Scholar]
- 20.Gertz J., Gerke J.P., Cohen B.A. Epistasis in a quantitative trait captured by a molecular model of transcription factor interactions. Theor. Popul. Biol. 2010;77:1–5. doi: 10.1016/j.tpb.2009.10.002. [DOI] [PMC free article] [PubMed] [Google Scholar]
- 21.Al Koudsi N., Hoffmann E.B., Assadzadeh A., Tyndale R.F. Hepatic CYP2A6 levels and nicotine metabolism: impact of genetic, physiological, environmental, and epigenetic factors. Eur. J. Clin. Pharmacol. 2010;66:239–251. doi: 10.1007/s00228-009-0762-0. [DOI] [PMC free article] [PubMed] [Google Scholar]
- 22.Fukami T., Nakajima M., Higashi E., Yamanaka H., McLeod H.L., Yokoi T. A novel CYP2A6*20 allele found in African-American population produces a truncated protein lacking enzymatic activity. Biochem. Pharmacol. 2005;70:801–808. doi: 10.1016/j.bcp.2005.05.029. [DOI] [PubMed] [Google Scholar]
- 23.Ho M.K., Mwenifumbo J.C., Zhao B., Gillam E.M., Tyndale R.F. A novel CYP2A6 allele, CYP2A6*23, impairs enzyme function in vitro and in vivo and decreases smoking in a population of Black-African descent. Pharmacogenet. Genomics. 2008;18:67–75. doi: 10.1097/FPC.0b013e3282f3606e. [DOI] [PMC free article] [PubMed] [Google Scholar]
- 24.Mwenifumbo J.C., Al Koudsi N., Ho M.K., Zhou Q., Hoffmann E.B., Sellers E.M., Tyndale R.F. Novel and established CYP2A6 alleles impair in vivo nicotine metabolism in a population of Black African descent. Hum. Mutat. 2008;29:679–688. doi: 10.1002/humu.20698. [DOI] [PubMed] [Google Scholar]
- 25.von Richter O., Pitarque M., Rodriguez-Antona C., Testa A., Mantovani R., Oscarson M., Ingelman-Sundberg M. Polymorphic NF-Y dependent regulation of human nicotine C-oxidase (CYP2A6) Pharmacogenetics. 2004;14:369–379. doi: 10.1097/00008571-200406000-00006. [DOI] [PubMed] [Google Scholar]
- 26.Haberl M., Anwald B., Klein K., Weil R., Fuss C., Gepdiremen A., Zanger U.M., Meyer U.A., Wojnowski L. Three haplotypes associated with CYP2A6 phenotypes in Caucasians. Pharmacogenet. Genomics. 2005;15:609–624. doi: 10.1097/01.fpc.0000171517.22258.f1. [DOI] [PubMed] [Google Scholar]
- 27.Fukami T., Nakajima M., Yamanaka H., Fukushima Y., McLeod H.L., Yokoi T. A novel duplication type of CYP2A6 gene in African-American population. Drug Metab. Dispos. 2007;35:515–520. doi: 10.1124/dmd.106.013557. [DOI] [PubMed] [Google Scholar]
- 28.Tyndale R.F., Sellers E.M. Variable CYP2A6-mediated nicotine metabolism alters smoking behavior and risk. Drug Metab. Dispos. 2001;29:548–552. [PubMed] [Google Scholar]
- 29.Bierut L.J., Madden P.A., Breslau N., Johnson E.O., Hatsukami D., Pomerleau O.F., Swan G.E., Rutter J., Bertelsen S., Fox L., et al. Novel genes identified in a high-density genome wide association study for nicotine dependence. Hum. Mol. Genet. 2007;16:24–35. doi: 10.1093/hmg/ddl441. [DOI] [PMC free article] [PubMed] [Google Scholar]
- 30.Saccone N.L., Wang J.C., Breslau N., Johnson E.O., Hatsukami D., Saccone S.F., Grucza R.A., Sun L., Duan W., Budde J., et al. The CHRNA5-CHRNA3-CHRNB4 nicotinic receptor subunit gene cluster affects risk for nicotine dependence in African-Americans and in European-Americans. Cancer Res. 2009;69:6848–6856. doi: 10.1158/0008-5472.CAN-09-0786. [DOI] [PMC free article] [PubMed] [Google Scholar]
- 31.Saccone S.F., Hinrichs A.L., Saccone N.L., Chase G.A., Konvicka K., Madden P.A., Breslau N., Johnson E.O., Hatsukami D., Pomerleau O., et al. Cholinergic nicotinic receptor genes implicated in a nicotine dependence association study targeting 348 candidate genes with 3713 SNPs. Hum. Mol. Genet. 2007;16:36–49. doi: 10.1093/hmg/ddl438. [DOI] [PMC free article] [PubMed] [Google Scholar]
- 32.Saccone S.F., Pergadia M.L., Loukola A., Broms U., Montgomery G.W., Wang J.C., Agrawal A., Dick D.M., Heath A.C., Todorov A.A., et al. Genetic linkage to chromosome 22q12 for a heavy-smoking quantitative trait in two independent samples. Am. J. Hum. Genet. 2007;80:856–866. doi: 10.1086/513703. [DOI] [PMC free article] [PubMed] [Google Scholar]
- 33.Saccone N.L., Saccone S.F., Hinrichs A.L., Stitzel J.A., Duan W., Pergadia M.L., Agrawal A., Breslau N., Grucza R.A., Hatsukami D., et al. Multiple distinct risk loci for nicotine dependence identified by dense coverage of the complete family of nicotinic receptor subunit (CHRN) genes. Am. J. Med. Genet. B Neuropsychiatr. Genet. 2009;150B:453–466. doi: 10.1002/ajmg.b.30828. [DOI] [PMC free article] [PubMed] [Google Scholar]
- 34.Barrett J.C., Fry B., Maller J., Daly M.J. Haploview: analysis and visualization of LD and haplotype maps. Bioinformatics. 2005;21:263–265. doi: 10.1093/bioinformatics/bth457. [DOI] [PubMed] [Google Scholar]
Associated Data
This section collects any data citations, data availability statements, or supplementary materials included in this article.