

Abstract
O-linked glycans of secreted and membrane bound proteins play an important role in the pathogenesis of pancreatic cancer by modulating immune responses, inflammation, and tumorigenesis. A critical aspect of O-glycosylation, the position at which proteins are glycosylated with N-acetyl-galactosamine on serine and threonine residues, is regulated by the substrate specificity of UDP-GalNAc: polypeptide N-acetylgalactosaminyl-transferases (GalNAc-Ts). Thus, GalNAc-Ts regulate the first committed step in O-glycosylated protein biosynthesis, determine sites of O-glycosylation on proteins, and are important for understanding normal and carcinoma-associated O-glycosylation. We have found that one of these enzymes, GalNAc-T3, is overexpressed in human pancreatic cancer tissues, and suppression of GalNAc-T3 significantly attenuates growth of pancreatic cancer cells in vitro and in vivo. In addition, suppression of GalNAc-T3 induces apoptosis of pancreatic cancer cells. Our results indicate that GalNAc-T3 is likely to be involved in pancreatic carcinogenesis. Modification of cellular glycosylation occurs in nearly all types of cancer as a result of alterations in the expression levels of glycosyltransferases. We report guanine nucleotide binding protein, alpha transducing activity polypeptide 1 (GNAT1) as a possible substrate protein of GalNAc-T3. GalNAc-T3 is associated with O-glycosylation of GNAT1, and affects the subcellular distribution of GNAT1. Knocking down endogenous GNAT1 significantly suppresses the growth/survival of PDAC cells. Our results imply that GalNAc-T3 contributes to the function of O-glycosylated proteins and thereby affects the growth and survival of pancreatic cancer cells. Thus, substrate proteins of GalNAc-T3 should serve as important therapeutic targets for pancreatic cancers.
Keywords: polypeptide N-acetylgalactosaminyl-transferase, GalNAc-T3, pancreatic cancer, O-glycosylation, cell growth, apoptosis
Introduction
Pancreatic ductal adenocarcinoma (PDAC) is the fourth leading cause of death by cancer in the western world. It shows the worst mortality among common malignancies with a 5-year survival rate of less than 5% (Jemal et al., 2009; Wray et al., 2005). Thus, the development of novel approaches to prevent and treat PDAC is important.
Pancreatic O-glycosylated proteins have important biological functions, including the protection, lubrication, and moisturization of the surfaces of epithelial tissues that line ductal structures within the pancreas. Both the glycosylation and expression of O-glycosylated proteins become deregulated during the development and progression of PDAC (Moniaux et al., 2004). The O-glycosylation of glycoproteins is critical for their function to protect and control the local environment of the cell surface, whereby aberrant glycosylation of O-glycosylated proteins contributes to the transformation and metastatic capacity of cancer cells (Hollingsworth and Swanson, 2004). GalNAc-Ts are localized in the Golgi apparatus where mucin-type linkages (GalNacα1-O-Ser/Thr) are initiated. Once synthesized, GalNacα1-O-Ser/Thr can be additionally processed by different glycosyltransferases to form different core structures, such as Core1 (Galβ1-3GalNAcα-O-Thr/Ser) and Core2 [GlcNAcβ1-6(Galβ1-3)GalNAcα-O-Thr/Ser]. Carbohydrates of glycoproteins, which are displayed on cell membranes, are structurally changed during carcinogenesis (Hakomori, 1989). This carbohydrate heterogeneity has been applied to tumor markers for clinical diagnosis. For example, carbohydrate Antigen 19–9 (CA19-9) and carcinoembrionic antigen (CEA) are commonly used as markers of PDAC. Structural changes to the carbohydrates of glycoproteins may occur as a result of alterations in the expression levels of glycosyltransferases, which are implicated in the biosynthesis of glycoforms (Kondo A et al., 2006). Analysis of tissue-specific expression of these enzymes revealed that GalNAc-T3 is overexpressed by some PDAC cell lines (Sutherlin et al., 1997). Thus, overexpression of GalNAc-T3 may contribute to the function of O-glycosylated proteins produced by PDAC cells and thereby affect the ability of these cells to transform and survive in different organ environments.
In this study, we show that GalNAc-T3 is overexpressed in human PDAC tissues, and that overexpression of GalNAc-T3 correlates with oncogenic activity. Suppression of GalNAc-T3 expression in PDAC cells by RNA interference (RNAi) results in growth suppression of cancer cells in vitro and in vivo. We also report that GNAT1 may be a substrate protein of GalNAc-T3 and play a similarly important role in the viability of PDAC cells. It is likely that GalNAc-T3 acts on substrate proteins that are important for the growth and/or survival of PDAC cells, and contributes to cell growth/survival in an epigenetic manner based on their substrate specificities.
Results
Overexpression of GalNAc-T3 in PDAC
We compared the expression levels of GalNAc-Ts in human PDAC cell lines with the normal pancreatic ductal cell line, HPNE, by semiquantitative reverse transcription-PCR (RT-PCR). We found that high levels of GalNAc-T3 expression were present in six of eight PDAC cell lines when compared to HPNE cells (Figure 1a). Overexpression of GalNAc-T3 was confirmed by immunoblotting (Figure 1a).
Figure 1. Overexpression of GalNAc-T3 in PDAC.

(a) Expression of endogenous GalNAc-T3 in PDAC cells compared with the HPNE cell line, as determined by RT-PCR (upper panels) and western blotting using anti-GalNAc-T3 antibody (lower panels).
(b) Immunohistochemical staining of PDAC tissues using anti-GalNAc-T3 antibody. Original magnification: 200×.
(c) Immunohistochemical staining of normal pancreas tissues using anti-GalNAc-T3 antibody. Original magnification: 200×. (d and e) Representative expression pattern of GalNAc-T3 in two PDAC cases. In these cases, granular-staining was seen at the center and surrounding the tumors. Original magnification: 200×.
Immunohistochemical analysis of GalNAc-T3 expression in human PDAC tissues using an anti-GalNAc-T3 antibody showed strong signals in the cytoplasm of PDAC cells in four PDAC tissue sections from five patients. The expression of GalNAc-T3 in two cases of PDAC is shown in Figure 1b. In normal pancreatic tissues, GalNAc-T3 is weakly expressed in the acinar and ductal epithelium (Figure 1c). Furthermore, tissue-microarray analysis of 32 PDAC tissues shows that 21 of 32 PDACs express high levels of GalNAc-T3 (66%; Supplementary Table 1). Taking together all of the GalNAc-T3-positive PDAC specimens and the tissue microarray, immunohistochemical patterns show granular staining mostly restricted to the perinuclear areas in the cytoplasm in the center and in the surrounding areas of the tumors (Figure 1d, e).
Knockdown effects of GalNAc-T3 on the viability of PDAC cells
To assess whether GalNAc-T3 is essential for the growth of PDAC cells, we produced three independent RNAi constructs in the pSUPER system that targets GalNAc-T3. These constructs were transiently expressed in the moderately differentiated human PDAC cell lines S2-013 and BxPC3 in which GalNAc-T3 is highly expressed, and in the poorly differentiated human PDAC cell line PANC-1, which is GalNAc-T3 null. A knockdown effect by the siT3-1 and siT3-2 constructs was confirmed by RT-PCR and immunoblotting in S2-013 (Figure 2a). The effects of GalNAc-T3 on cell growth were determined from in vitro tissue culture assays. We found by colony-formation (Figure 2b) and MTT assays (Figure 2c) that S2-013 cells transfected with siT3-1 and siT3-2 were drastically reduced in number when compared with siT3-3, of which only a weak knockdown effect was apparent. Similar effects were obtained with the BxPC3 cell line; however, no significant differences were observed in PANC-1 cells in which GalNAc-T3 was not expressed (Figure 2d). These results suggest that GalNAc-T3 plays a role in PDAC cell viability.
Figure 2. Growth-inhibitory effect of GalNAc-T3 siRNAs in PDAC cells.

(a) Three GalNAc-T3 siRNA expression vectors (siT3-1, siT3-2, and siT3-3) and a Neo-pSUPERgfp vector as a negative control were transiently transfected into S2-013 cells. The knockdown effect of GalNAc-T3 was validated by RT-PCR (upper panels) and western blotting using anti-GalNAc-T3 (lower panels).
(b) Colony formation assays of S2-013 cells were carried out 14 days after neomycin selection. Data are representative of three independent experiments.
(c) MTT assays of S2-013 cells were performed to evaluate cell viability at 14 days with neomycin selection. Data are representative of three independent experiments and are shown as means ± SEM. *p < 0.001 and **p < 0.005 compared with control cells.
(d) MTT assays of BxPC3 and PANC-1 cells were performed to evaluate cell viability at 14 days with neomycin selection. Data are representative of three independent experiments and are shown as means ± SEM. *p < 0.001 and **p < 0.005 compared with control cells.
Stable knockdown of GalNAc-T3 in PDAC cell lines by RNAi
To further examine the effects of GalNAc-T3 on cell growth/survival, motility, and invasion, we generated clones that stably suppressed GalNAc-T3 expression by vector-based transfection of the siT3-2 plasmid in S2-013 cells, which express high levels of GalNAc-T3. Western blot analysis validated that stable GalNAc-T3 RNAi clones (siT3-clone1 and siT3-clone2) significantly suppressed GalNAc-T3 in S2-013 cells (Figure 3a). We also prepared control S2-013 cells transfected with a mock and a scrambled control vector (Neo-clone1 and Scr-clone1) to compare cell growth, motility, and invasion by in vitro culture assays and by an in vivo xenograft model. MTT assays showed that siT3-clone1 and siT3-clone2 grew much more slowly than control Neo-clone1 or Scr-clone1 (Figure 3b), in accordance with the results of MTT assays using transiently suppressed GalNAc-T3 (Figure 2c). These results indicate that lower levels of GalNAc-T3 expression suppress cell growth. Suppression of GalNAc-T3 fails to enhance or inhibit motility, as assessed by wound healing and transwell motility assays as well as by Matrigel invasion assays (data not shown).
Figure 3. Stable knockdown of GalNAc-T3 suppresses cell growth of PDAC.

(a) Western blot with anti-GalNAc-T3 antibody showing two S2-013 (siT3-clone1 and 2) clones transfected with siRNA for GalNAc-T3 and compared to mock (Neo-1) and scrambled (Scr-1) control clones.
(b) MTT assays in stable control and GalNAc-T3 RNAi S2-013 cells. Data are representative of three independent experiments and are shown as means ± SEM. *p < 0.001 compared with control cells.
(c) Tumor xenografts in stable control and GalNAc-T3 RNAi S2-013 cells. Two control and GalNAc-T3 RNAi clones were incubated in the dorsa at the proximal midline of 7-week-old nude mice. n = 5; error bars indicate SEM; *p < 0.005 compared with control cells.
We next examined the effect of suppressing GalNAc-T3 on tumor xenograft growth in nude mice. GalNAc-T3-silenced S2-013 clones displayed significantly decreased tumor growth kinetics compared with control xenografts (Figure 3c; 10 xenografts of 2 clones per group). This suggests that the loss of function of GalNAc-T3 suppresses the growth of xenografted PDAC tumors and that GalNAc-T3 might be involved in accelerating tumorigenesis in vivo.
Knockdown effects of GalNAc-T3 on apoptosis
We characterized the function of GalNAc-T3 in cell survival and determined the percentage of cells undergoing apoptosis between stable control and GalNAc-T3 S2-013 clones by flow cytometric analysis. ModFit cell cycle analysis software was used to analyze the percentage of cells undergoing apoptotic cell death. We found that the percentage of apoptotic cells increased when GalNAc-T3 was knocked down (Figure 4a, b). We calculated that 11.3 ± 0.3% of siT3-clone1 and 7.1 ± 2.9% of siT3-clone2 of S2-013 cells were undergoing apoptosis, whereas in control mock and scrambled cells, a basal level of 0.8 ± 0.4% and 0.8 ± 0.8% apoptotic cells was detected, respectively (Figure 4c). Moreover, by FACS analysis, suppression of GalNAc-T3 increased the number of cells at sub-G1, which coincides with the increased apoptotic cell population (Figure 4d). Thus, suppression of GalNAc-T3 drastically attenuates growth of PDAC cells and induces apoptosis, suggesting an essential role for GalNAc-T3 in maintaining the viability of PDAC cells.
Figure 4. Flow cytometric analysis of cell cycle distribution and apoptosis in stable control and GalNAc-T3 RNAi S2-013 cells.

(a and b) Cells were grown to approximately 70% confluence and removed from the culture surfaces by trypsinization, and DNA content and apoptosis were determined. Raw data were modeled using ModFit cell cycle analysis software. The profiles are representative histograms of triplicate assays. a, control; b, GalNAc-T3 RNAi cells.
(c) The percentage of apoptotic cells is shown between control and GalNAc-T3 RNAi S2-013 cells. Experiments were repeated three times; *p < 0.001, **p < 0.005 compared with control cells.
(d) The percentage of cells in the sub-G1 population was determined from at least 10,000 ungated cells between the control and GalNAc-T3 RNAi S2-013 cells. Experiments were repeated three times; *p < 0.05 compared with control cells.
GalNAc-T3 plays a role in inducing cell growth and survival
As shown in Figure 5a and in accordance with our flow cytometric data, we found a significantly higher number of apoptotic cells in GalNAc-T3 RNAi S2-013 cells as determined by in situ TUNEL staining. Additionally, the effect of GalNAc-T3 on cell proliferation was further studied by MIB-1 staining with control and GalNAc-T3 RNAi S2-013 cells (Figure 5b). MIB-1 recognizes the Ki-67 nuclear antigen, which is associated with cell proliferation and is found throughout the cell cycle (G1, S, G2, and M phases) but not in resting (G0) cells (Cattoretti et al., 1992). MIB-1 positive cells were significantly reduced in GalNAc-T3 depleted cells. To investigate the mechanism by which GalNAc-T3 induces cell growth/survival, the activities of extracellular signal regulated kinases 1 and 2 (ERK1/2), Akt, and prosurvival nuclear factor κB (NFκB) were assessed. The suppression of GalNAc-T3 did not change the phosphorylation levels of any of these molecules linking proliferation and apoptosis (data not shown).
Figure 5. The effects of GalNAc-T3 on cell growth and survival.
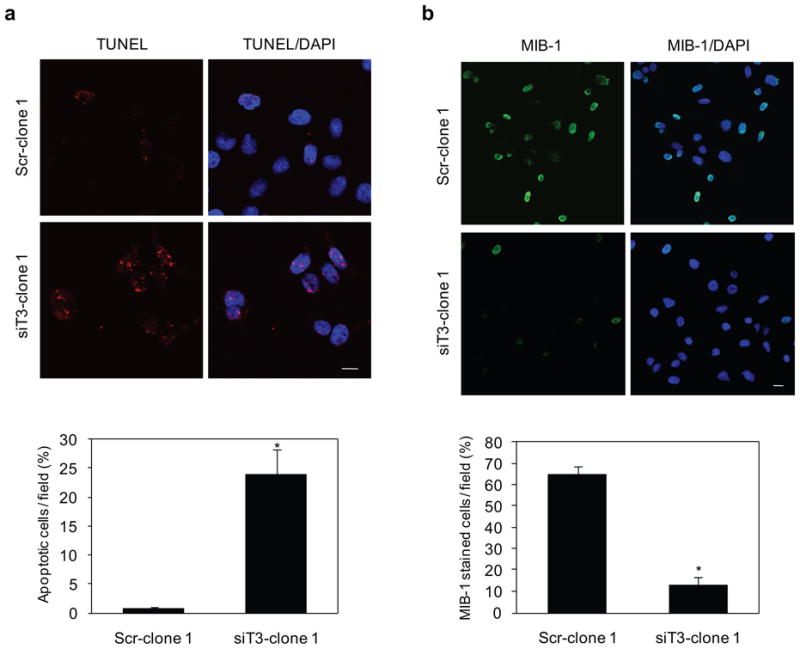
(a) Control and GalNAc-T3 RNAi S2-013 cells were subjected to an in situ apoptosis detection assay. The red signal indicates apoptosis. Blue, DAPI staining. The number of apoptotic cells was counted. Cells in four defined areas per group per experiment were quantified. Data are representative of three independent experiments. Columns, mean; bars, SD. *p<0.001 compared with control cells. Bar: 10 μm.
(b) Immunocytochemical staining in control and GalNAc-T3 RNAi S2-013 cells, as determined with anti-MIB-1 (green). Blue, DAPI staining. The percentage of MIB-1-stained cells is shown. Cells in four defined areas per group per experiment were quantified. Data are representative of three independent experiments. Columns, mean; bars, SD. *p<0.001 compared with control cells. Bar: 10 μm.
Identification of GNAT1 as a substrate protein of GalNAc-T3
To identify the target candidates of GalNAc-T3, we identified differently expressed proteins in the membrane fractions of stable control and GalNAc-T3 RNAi S2-013 cells by silver staining SDS-PAGE gels. O-glycosylated proteins generally attach to membrane and cell surfaces (Spiro 2002; Jensen 2006); thus, isolating subcellular fractions is useful for enriching membrane and membrane-associated proteins. Carbohydrate structural changes may occur as the result of alterations in the levels of glycosyltransferases, and glycosylation can alter the charge, conformation, and stability of proteins, and thereby induce heterogeneous protein profiles as a consequence of producing variable glycoforms (Kondo et al., 2006). Two 40-kDa bands were identified in GalNAc-T3 RNAi S2-013 cells, whereas only one band was observed in the control cells (Figure 6a). The 40-kDa bands were excised and analyzed by Q-TOF-MS after in-gel trypsin digestion, and identified as GNAT1. The peptide sequence coverage was 13% (Figure 6b). GNAT1 is a membrane-associated 3-subunit guanine nucleotide-binding protein (G protein), which stimulates the coupling of rhodopsin and cGMP-phoshodiesterase during visual impulses (Ruiz-Avila et al., 1995). The function of GNAT1 in PDAC cells is currently unknown. Two bands of GNAT1 (40-kDa-1 and −2) were confirmed in membrane fractions from GalNAc-T3 RNAi S2-013 cells by western blotting (Figure 7a). Only one band was observed in the control S2-013 cells (40-kDa-2; Figure 7a). Additionally, both of the 40-kDa GNAT1 bands were more abundantly expressed in the cytoplasmic fractions of GalNAc-T3 RNAi S2-013 cells compared to control cells (Figure 7b). In immunocytochemical staining, GNAT1 was observed in the cytoplasm and membranes of GalNAc-T3 RNAi S2-013 cells, whereas GNAT1 was expressed at the cell membranes and only a little expression of GNAT1 was seen in the cytoplasm of control cells (Figure 7c). Thus, suppression of GalNAc-T3 produced a different form of GNAT1 (40-kDa-1) and changed its intracellular distribution. To test if GalNAc-T3 affects the stability of the GNAT1 protein, we analyzed GNAT1 mRNA and protein expression levels in total lysates of control S2-013 and GalNAc-T3 RNAi cells. We found no differences in mRNA expression of GNAT1 between control and GalNAc-T3 RNAi S2-013 cells (Figure 7d); however, the steady-state level of 40-kDa-2, which is expressed in control cells, was decreased, and the altered 40-kDa-1 form was produced after GalNAc-T3 knockdown (Figure 7e). It is possible that knocking down endogenous GalNAc-T3 decreased the stability of the 40-kDa-2 form, perhaps by carbohydrate structural changes or a loss of O-glycosylation, and in turn produced the 40-kDa-1 form. These results suggest that GalNAc-T3 post-translationally catalyzes GNAT1, and that GNAT1 may be a substrate protein of GalNAc-T3.
Figure 6. Identification of GalNAc-T3-associated proteins.

(a) Membrane fractionated proteins from control and GalNAc-T3 RNAi S2-013 cells were examined by silver stain analysis.
(b) Percent coverage for GNAT1 is represented by the identified peptides in the total protein sequence (accession number NM_032166).
Figure 7. GNAT1 is a potential substrate for GalNAc-T3.

(a) Membrane fractionation of control and GalNAc-T3 RNAi S2-013 cells followed by western blotting using anti-GNAT1 antibody.
(b) Cytosolic fractionation of control and GalNAc-T3 RNAi S2-013 cells followed by western blotting using anti-GNAT1 antibody.
(c) Immunocytochemical staining in control and GalNAc-T3 RNAi S2-013 cells, as determined by anti-GNAT1 antibody (green) and DAPI staining (blue). Bars: 10 μm.
(d) RT-PCR analysis of steady-state levels of GNAT1 mRNAin control and GalNAc-T3 RNAi S2-013 cells.
(e) Western blot of steady-state levels of GNAT1 protein in control and GalNAc-T3 RNAi S2-013 cells.
Identification of O-glycosylation in GNAT1
We next assessed the O-glycosylation status of GNAT1 in S2-013 cells. First, total lysates from S2-013 cells were treated with sialidase to determine the effects of removing sialic acid residues from O-glycans or N-glycans in GNAT1 (Figure 8a). Mobility shifts before and after sialidase treatment showed that GNAT1 from S2-013 cells was sialidase-sensitive. This result indicates that GNAT1 is a glycoprotein that has O-glycans or N-glycans. To test whether the carbohydrates of GNAT1 were O-glycosylated, total S2-013 cell lysates were treated with peptide N-glycosidase F (PNGase) to remove the N-linked glycans (Figure 8b). We confirmed that the band of the single-span transmembrane N-glycoprotein E-cadherin was PNGase-sensitive, and found no obvious differences in band positions of GNAT1, thus indicating that GNAT1 is not glycosylated by N-linked carbohydrates. Additionally, S2-013 cell lysates were incubated with O-sialoglycoprotein endopeptidase (OSGE; Mellors and Lo, 1995), which cleaves the protein at O-linked glycans (Figure 8c). The GNAT1 band was significantly reduced after OSGE treatment. These results indicate that GNAT1 is an O-glycosylated glycoprotein.
Figure 8. GNAT1 is an O-glycosylated protein.

(a) Total cell lysates from S2-013 cells were treated with sialidase, followed by western blotting with anti-GNAT1 antibody.
(b) Total cell lysates from S2-013 cells were treated with PNGase, followed by western blotting with anti-GNAT1 antibodyand anti-E-cadherin antibody as a positive control of PNGase treatment.
(c) Total cell lysates from S2-013 cells were treated with OSGE, followed by western blotting with anti-GNAT1 antibody.
(d) Total cell lysates from GalNAc-T3 RNAi S2-013 cells (siT3-clone 1) were treated with OSGE, followed by western blotting with anti-GNAT1 antibody.
(e) Western blotting of immunoprecipitated GNAT1 from control and GalNAc-T3 RNAi S2-013 cells with anti-GNAT1 antibody and detection of glycochains of GNAT1.
We next assessed the potential O-glycosylation of GNAT1 in GalNAc-T3 RNAi S2-013 cells. The 40-kDa-1 form was not digested by OSGE treatment, whereas the 40-kDa-2 form was OSGE-sensitive (Figure 8d). A non-specific band was detected by western blotting using anti-GNAT1 antibody (Figure 8a, c, d). This band was at a much lower molecular weight than the apparent molecular weight of GNAT1, was seen in cell lysates with or without enzyme treatment, and was not shifted by the treatment. Thus, these results indicate that this band is not associated with GNAT1. Subsequently, the glycochain of GNAT1 was detected by a G-P sensor kit as the same sized molecule recognized by western blotting in control cells (Figure 8e). In concordance with the results shown in Figures 7e and 8d, the 40-kDa-2 form was decreased and the 40-kDa-1 form was not detected in GalNAc-T3 RNAi S2-013 cells (Figure 8e). These results indicate that the 40-kDa-1 form was not O-glycosylated by knocking down GalNAc-T3, and that GNAT1 is a specific substrate of GalNAc-T3.
Knockdown effects of GNAT1 on the viability of PDAC cells
MTT assays were used to examine the effect of reduced GNAT1 expression on cell growth of S2-013 cells, in which GNAT1 was highly expressed, and in GNAT1 null PANC-1 cells. As shown by western blot analysis, GNAT1 expression was markedly reduced in S2-013 cells 72 h after transfection with the GNAT1-targeting siRNA-oligonucleotide, in contrast to cells transfected with the scrambled siRNA-oligonucleotide (Figure 9a). As a consequence of reduced GNAT1 expression by siRNA, a significant decrease in S2-013 cell growth was observed; however, no significant differences were observed in PANC-1 cells in which GNAT1 was not expressed (Figure 9b). Additionally, suppression of GNAT1 in S2-013 cells decreased cell growth as assessed by MIB-1 staining (Figure 9c), and increased apoptosis in in situ TUNEL staining (Figure 9d). These studies demonstrate an important role of GNAT1 in PDAC cell viability.
Figure 9. GNAT1 induces cell growth and survival of PDAC cells.

(a) siRNA oligonucleotides targeting GNAT1 (siGNAT1) and negative scrambled control (Scr) were transiently transfected into S2-013 and PANC-1 cells. Western blotting validated the knockdown effect of GNAT1 in S2-013 cells.
(b) MTT assays of S2-013 and PANC-1 cells were performed to evaluate cell viability. Data are representative of three independent experiments and are shown as means ± SEM. *p < 0.005 compared with scrambled control cells.
(c) siRNA oligonucleotides targeting GNAT1 and negative scrambled control were transiently transfected into S2-013 cells. The percentage of MIB-1-stained cells is shown. Cells in four defined areas per group per experiment were quantified. Data are representative of three independent experiments. Columns, mean; bars, SD. *p<0.005 compared with control cells.
(d) Control and GNAT1 RNAi S2-013 cells were subjected to an in situ apoptosis detection assay. Cells in four defined areas per group per experiment were quantified. Data are representative of three independent experiments. Columns, mean; bars, SD. *p<0.005 compared with control cells.
Discussion
O-glycosylated proteins are associated with the differentiation and the malignant potential of cancers, such as altered cell adhesion, invasion, metastasis, recurrence, and prognosis (Brockhausen, 1999). In numerous pancreatic pathologic situations, O-glycosylated protein expression is deregulated, and aberrant expression of O-glycosylated proteins is often associated with a poor prognosis (Braga et al., 1992; Reis et al., 1999). O-glycosylation is important in many aspects of survival and protection of cells and organisms. Carcinomas commonly overexpress O-linked glycans in the form of cell-surface and secreted glycoproteins that present ligands for adhesion receptors, such as the selectins, which promote the ability of tumor cells to interact with host platelets, leucocytes, and endothelial cells (Fuster and Esko, 2005). Thus, GalNAc-Ts that regulate the initiation of O-glycosylation of glycoproteins are important for understanding aspects of tumor-associated aberrant O-glycosylation. We found GalNAc-T3 to be overexpressed in 66% of PDACs when compared with normal pancreas. O-glycosylation is carried out in part by the differential expression of GalNAc-Ts in normal tissues and tumors (White et al., 1995; Bennett et al., 1996), suggesting that the differential expression of O-linked carbohydrate antigens such as CA19-9 and CEA in PDAC may be explained by the differential expression and activity of specific GalNAc-Ts. Even though the extent of change in glycosylation due to malignancy or how clustered O-glycosylation occurs have not been studied in detail, overexpression of GalNAc-T3 in PDAC may be associated with aberrant production of tumor-associated O-glycosylation.
We demonstrated that suppression of GalNAc-T3 by RNAi significantly attenuates cell growth/survival of PDAC cells in vitro and in vivo. These results indicate that overexpressed GalNAc-T3 in PDAC cells is capable of O-glycosylation in a differential manner as compared to normal pancreatic epithelium, and that the formation of uncommon structures or novel sites of glycosylation due to aberrant glycosylation could contribute to malignant behavior. Because carbohydrates cannot be mutated directly, it is likely that GalNAc-T3 acts on substrate proteins that are important for the growth and/or survival of PDAC cells, and thereby contributes to cell growth/survival in an epigenetic manner based on the substrate specificities of these proteins. By Q-TOF analysis of control and GalNAc-T3 RNAi S2-013 cells, we identified a membrane-associated G-protein, GNAT1, as a substrate candidate for GalNAc-T3. We showed that by knocking down endogenous GNAT1, the growth/survival of PDAC cells was significantly suppressed, implying that GalNAc-T3 may function to induce cell viability through abnormal glycosylation of its substrates.
The mechanism by which knockdown of GalNAc-T3 decreases cell viability in S2-013 cells is by inhibiting proliferation and inducing apoptosis. Cell proliferation and apoptosis are linked by cell-cycle regulators and apoptotic stimuli that affect both processes (Alenzi, 2004). The phosphatidylinositide-3-OH kinase (PI3K)/Akt and the mitogen-activated protein kinase (MAPK)/ERK pathways have central roles in the regulation of cell proliferation and survival (Merighi et al., 2006). NFκB promotes cell survival through the expression of genes encoding anti-apoptotic proteins that directly block caspase activation (Andersen et al., 2005). In our study, GalNAc-T3 did not change the activity of ERK1/2, Akt, or NFκB, and the signal transduction pathway involved in GalNAc-T3-stimulated PDAC cell growth/survival is still unknown.
GNAT1 is an essential G-protein in the rod phototransduction pathway, and converts light stimulation of photoreceptor opsins into the activation of cyclic GMP phosphodiesterase (Ruiz-Avila et al., 1995). The post-translational modifications of GNAT1 are currently unknown. We showed that GNAT1 is an O-glycosylated protein (Figure 8a-c, e), and that the increased molecular size of GNAT1 (the 40-kDa-1 form) produced by GalNAc-T3 knockdown has no O-glycans (Figure 8d, e). This indicates that GalNAc-T3 is associated with cancer-associated O-glycosylation of GNAT1. We noted that GNAT1 in control S2-013 cells remains bound to membranes (Figure 7a, c), and knocking down GalNAc-T3 changed the subcellular distribution of GNAT1 from the plasma membrane to the cytoplasm (Figure 7b, c). It is possible that the 40-kDa-1 form of GNAT1 produced by GalNAc-T3 knockdown is predominantly expressed in the cytoplasm due to loss of O-glycosyl structures. When rod GNAT1 is stimulated by light, its subunits dissociate, leave the membrane, and equilibrate throughout the rod cell (Rosenzweig et al., 2007). Cone transducin subunits do not dissociate during activation and remain sequestered within the membranes, indicating that the subunits of GNAT1 remain associated during activation in their native environments (Rosenzweig et al., 2007). Our results suggest a new and unique finding in PDAC cells, that the altered structure of O-glycans of GNAT1 could reflect its membrane affinity and intracellular distribution.
It has been known that malignant transformation is associated with abnormal glycosylation, resulting in expression of altered carbohydrate determinants (Kannagi et al., 2004). Knockdown of either GalNAc-T3 or GNAT1 significantly attenuated growth and survival of PDAC cells, and thus it is likely that the 40-kDa-2 form of GNAT1 is associated with cell viability; however, the 40-kDa-1 form produced by GalNAc-T3 knockdown does not function to increase cell growth/survival. The underexpression, truncation, or altered branching patterns of certain glycans correlate with cell growth (Fuster and Esko, 2005). Altered O-glycans expressing terminal galactose in pancreatic and colon cancers suppress apoptosis, possibly through binding to a member of the β-galactoside-binding proteins, galectin-3 (Takenaka et al., 2004). Other studies have demonstrated that upregulated biosynthesis of complex O-glycosidically-linked glycans and galectin-3 favor breast cancer progression and brain metastasis (Mayoral et al., 2008; Li et al., 2010). Thus, a change in O-glycosylation of GNAT1 could contribute to a change towards a cancer phenotype and to malignant behavior. Future studies are essential for determining the structure and sites of O-glycans in GNAT1 by analyzing the O-glycans released from GNAT1 by OSGE digestion by the use of mass spectrometry. Furthermore, the differences between the 40-kDa-1 and 40-kDa-2 forms should be determined in order to evaluate whether structural changes occur as a result of alterations in the expression levels of GalNAc-T3. Thus, further studies are needed to identify the substrate O-glycosylated proteins of GalNAc-T3 that are essential for cell growth and/or survival of PDAC cells. Given the broad spectrum of O-glycoforms that are catalyzed by GalNAc-T3 on substrate proteins, these proteins should be promising targets for the development of novel drugs for PDAC patients.
Materials and Methods
Cell culture
Human PDAC cell lines PANC-1, BxPC3, SUIT-2, COLO357, HPAF, and MIA-PaCa2 were purchased from the American Type Culture Collection (ATCC). Human PDAC cell line S2-013, which is a subline of SUIT-2, was obtained from Dr. T. Iwamura (Iwamura et al., 1987). HPNE immortalized normal pancreatic epithelial cells were a kind gift from Dr. Ouellette (Lee et al., 2005). Cells were grown in Dulbecco’s modified Eagle’s medium (DMEM; Gibco-BRL, Carlsbad, CA) supplemented with 10% heat-inactivated fetal calf serum at 37 °C saturated with 5% CO2 in a humidified atmosphere.
Antibodies
Polyclonal antibodies against human GalNAc-T3 were generated by multiple immunizations of a New Zealand white rabbit using synthetic peptides as described previously (Nomoto et al., 1999). Rabbit anti-GNAT1 antibody (ab3504) was purchased from Abcam (Cambridge, MA). Chicken Alexa 488-conjugated anti-rabbit IgG secondary antibody was obtained from Molecular Probes (Carlsbad, CA).
Generation of stable knockdown cell lines of GalNAc-T3
We used a pSUPERgfp vector (OligoEngine, Seattle, WA) for expression of siRNA. The target sequences for the scrambled negative control and GalNAc-T3 were 5′-TTCTCCGAACGTGTCACGT-3′ and 5′-GGTCTGATCACTGCTCGGT-3′, respectively. S2-013 cells were transfected with empty Neo-pSUPERgfp, a scrambled oligo-pSUPERgfp negative control, or a plasmid designed to express siRNA to GalNAc-T3, using FuGENE6 (Roche, Penzberg, Germany). Cells were selected in medium containing 500 μg/mL of geneticin to generate stable pSUPERgfp cell lines. Single clones were isolated and analyzed for protein levels by western blotting.
Mice and xenografts
Female athymic nude mice (NCr-nu/nu) 7 weeks of age and specifically pathogen-free were purchased from the National Cancer Institute. Mice were treated in accordance with the Institutional Animal Care and Use Committee guidelines. A suspension of 8 × 10⁵ cells of stable control (2 clones, total 10 mice) or GalNAc-T3 RNAi (2 clones, total 10 mice) derivative from S2-013 in 50 μL Hank’s balanced Salt Solution was injected s.c. into the dorsa of mice at the proximal midline. The tumors were measured every 5 to 7 days in two diameters with a dial caliper. Volumes were determined using the formula a2× b × 0.52 (where a is the shortest and b is the longest diameter). All mice were sacrificed at the completion of the experiment, and tumors were fixed in 10% buffered formalin and paraffin embedded.
Flow cytometric analysis of apoptosis
Stable control and GalNAc-T3 RNAi cells of S2-013 were analyzed for apoptotic cell population by flow cytometry as previously described (Joshi et al., 2001). Briefly, 1 × 10⁶ cells were harvested by trypsinization and fixed in 70% ethanol. The cells were resuspended in 1 ml of Telford reagent containing EDTA (33.62 μg), RNase A (2.5 U), propidium iodide (50 μg), Triton X-100 (1.0 μl), and PBS (to a total volume of 1 ml). Cells were incubated at 4 °C for 24 h and analyzed with a BD FACSCalibur flow cytometer (Becton Dickinson, Franklin Lakes, NJ) using Cell Quest Acquisition Software (Becton Dickinson) for data acquisition. Following data collection, cell cycle distribution and apoptosis was modeled using ModFit LT (Verity Software House, Topsham, ME; Gray et al., 1980). The correlation between the flow cytometric data that measures the apoptotic peak and DNA laddering has been described previously (Telford et al., 1991).
In situ TUNEL assay
Manifestations of cell death were observed using fluorescent in situ terminal deoxynucleotidyl transferase-mediated uridine 5′-triphosphate-biotin nick end labeling (TUNEL staining). Cells were fixed with 4% formaldehyde, and the TUNEL reaction mixture was obtained by adding terminal deoxynucleotidyl transferase to a nucleotide mixture, as instructed by the manufacturer’s manual (Roche). Cells were then incubated with 50 μL TUNEL reaction mixture at 37 °C in the dark for 60 min. After rinsing with PBS, the nuclei of the specimens were counterstained with DAPI and visualized with a Zeiss LSM510 META microscope (Carl Zeiss, Gottingen, Germany).
Cytosol and membrane fractionation
Cells were homogenized in hypotonic buffer [20 mM Tris-HCl (pH 8.0), 150 mM NaCl, 1 mM EDTA, 1 mM PMSF, 1 mM Na3VO4] using a Dounce homogenizer, centrifuged at 700 × g for 5 min, and the postnuclear supernatant was then centrifuged at 100,000 × g for 1 h. The resulting supernatant was collected and used as the cytosolic fraction. The pellet was resuspended in hypotonic buffer containing 1% Triton X-100 and incubated on ice for 1 h. The supernatant component (particulate fraction) was centrifuged at 14, 000 × g for 20 min. Protein concentrations were determined by the Bio-Rad protein assay using BSA as a standard.
Mass spectrometric analysis
The membrane fractions from the stable scrambled negative control and GalNAc-T3 RNAi S2-013 cells were separated by 4–20% gradient SDS-PAGE and silver-stained. Bands that distinguished the proteins by knockdown of GalNAc-T3 from those in control cells were excised, digested in-gel with trypsin, and analyzed using a Q-TOF Ultima tandem mass spectrometer (Waters, Milford, MA) with electrospray ionization. Database searches of the acquired MS/MS spectra were performed using MASCOT v1.9.0 (Matrix Science, London, UK).
Enzyme treatment
Total cell lysates were treated with either 0.2 U/mL of sialidase (Roche) for 4 h at 37 °C, 100 units of peptide N-glycosidase F (New England BioLabs, Ipswich, MA) for 1 h at 37 °C, or 120 μg/mL O-sialoglycoprotein endopeptidase (Cedarlane, Ontario, Canada) for 4 h at 37 °C, and then analyzed by western blotting with anti-GNAT1 antibody.
Detection of sugar chains of GNAT1
S2-013 cells were lysed in lysis buffer [20 mM HEPES (pH 7.4), 100 mM KCl, 5 mM MgCl2, 0.5% Triton X-100, and protease inhibitor cocktail tablets (Roche)], and incubated with 2 μg of anti-GNAT1 antibody and protein G Sepharose. The detection of glycochains of GNAT1 was carried out with the use of a commercially available kit, G. P. Sensor (Honen, Tokyo, Japan). After immunoprecipitated GNAT1 was analyzed by western blotting, GNAT1 immobilized on the PVDF membrane was subjected to periodate oxidation. The aldehyde group formed by the periodate oxidations was coupled with biotin hydrazide. Biotin hydrazide-sugar chains were then coupled with streptavidin-horseradish peroxidase (HRP) conjugate. The HRP-labeled glycochains of GNAT1 were detected by enhanced chemiluminescence.
siRNA treatment
RNAi targeting GNAT1 and scrambled negative control siRNA oligonucleotides were purchased from Santa Cruz Biotechnology (43783 and 37007; Santa Cruz, CA). To examine the effect of the siRNAs on GNAT1 expression, S2-013 cells that expressed GNAT1 and PANC-1 cells that did not express GNAT1 were plated in six-well plates. After 20 h, the cells were transfected with 80 pmols of siRNA in siRNA transfection reagent (Santa Cruz) following the manufacturer’s instructions. After 72 h incubation, the cells were used for western blot analysis and MTT assays.
Supplementary Material
Acknowledgments
We thank Michel Ouellette for kindly providing us with the HPNE cells, and Tamotsu Takeuchi for supporting pathological experiments and helpful discussion. We also thank Janice Taylor and James Talaska for their excellent technical assistance. This work was funded by the NIH with grants to M.H. (U01CA111294; R01CA057362).
Footnotes
Conflict of interest
The authors have declared that no competing interests exist.
References
- Alenzi FQ. Links between apoptosis, proliferation and the cell cycle. Br J Biomed Sci. 2004;61:1–4. doi: 10.1080/09674845.2004.11732652. [DOI] [PubMed] [Google Scholar]
- Andersen MH, Becker JC, Straten P. Regulators of apoptosis: suitable targets for immune therapy of cancer. Nat Rev Drug Discov. 2005;4:399–409. doi: 10.1038/nrd1717. [DOI] [PubMed] [Google Scholar]
- Bennett EP, Hassan H, Clausen H. cDNA cloning and expression of a novel human UDP-N-acetyl-alpha-D-galactosamine. Polypeptide N-acetylgalactosaminyltransferase, GalNAc-T3. J Biol Chem. 1996;271:17006–17012. doi: 10.1074/jbc.271.29.17006. [DOI] [PubMed] [Google Scholar]
- Braga VM, Pemberton LF, Duhig T, Gendler SJ. Spatial and temporal expression of an epithelial mucin, Muc-1, during mouse development. Development. 1992;115:427–437. doi: 10.1242/dev.115.2.427. [DOI] [PubMed] [Google Scholar]
- Brockhausen I. Pathways of O-glycan biosynthesis in cancer cells. Biochim Biophys Acta. 1999;1473:67–95. doi: 10.1016/s0304-4165(99)00170-1. [DOI] [PubMed] [Google Scholar]
- Cattoretti G, Becker MH, Key G, Duchrow M, Schluter C, Galle J, et al. Monoclonal antibodies against recombinant parts of the Ki-67 antigen (MIB1 and MIB3) detect proliferating cells in microwave-processed formalin-fixed paraffin sections. J Pathol. 1992;168:357–363. doi: 10.1002/path.1711680404. [DOI] [PubMed] [Google Scholar]
- Fuster MM, Esko JD. The sweet and sour of cancer: glycans as novel therapeutic targets. Nat Rev Cancer. 2005;5:526–542. doi: 10.1038/nrc1649. [DOI] [PubMed] [Google Scholar]
- Gray JW, Dean PN. Display and analysis of flow cytometric data. Ann Rev Biophys Bioeng. 1980;9:509–539. doi: 10.1146/annurev.bb.09.060180.002453. [DOI] [PubMed] [Google Scholar]
- Hakomori S. Aberrant glycosylation in tumors and tumor-associated carbohydrate antigens. Adv Cancer Res. 1989;52:257–331. doi: 10.1016/s0065-230x(08)60215-8. [DOI] [PubMed] [Google Scholar]
- Hollingsworth MA, Swanson BJ. Mucins in cancer: protection and control of the cell surface. Nat Rev Cancer. 2004;4:45–60. doi: 10.1038/nrc1251. [DOI] [PubMed] [Google Scholar]
- Iwamura T, Katsuki T, Ide K. Establishment and characterization of a human pancreatic cancer cell line (SUIT-2) producing carcinoembryonic antigen and carbohydrate antigen 19–9. Jpn J Cancer Res. 1987;78:54–62. [PubMed] [Google Scholar]
- Jemal A, Siegel R, Ward E, Hao Y, Xu J, Thun MJ. Cancer statistics, 2009. CA Cancer J Clin. 2009;59:225–249. doi: 10.3322/caac.20006. [DOI] [PubMed] [Google Scholar]
- Jensen ON. Interpreting the protein language using proteomics. Nat Rev Mol Cell Biol. 2006;7:391–403. doi: 10.1038/nrm1939. [DOI] [PubMed] [Google Scholar]
- Joshi SS, Kuszynski CA, Bagchi D. The cellular and molecular basis of health benefits of grape seed proanthocyanidin extract. Curr Pharm Biotechnol. 2001;2:187–200. doi: 10.2174/1389201013378725. [DOI] [PubMed] [Google Scholar]
- Kannagi R, Izawa M, Koike T, Miyazaki K, Kimura N. Carbohydrate-mediated cell adhesion in cancer metastasis and angiogenesis. Cancer Sci. 2004;95:377–384. doi: 10.1111/j.1349-7006.2004.tb03219.x. [DOI] [PMC free article] [PubMed] [Google Scholar]
- Kondo A, Li W, Nakagawa T, Nakano M, Koyama N, Wang X, et al. From glycomics to functional glycomics of sugar chains: Identification of target proteins with functional changes using gene targeting mice and knock down cells of FUT8 as examples. Biochim Biophys Acta. 2006;1764:1881–1889. doi: 10.1016/j.bbapap.2006.10.011. [DOI] [PubMed] [Google Scholar]
- Lee KM, Yasuda H, Hollingsworth MA, Ouellette MM. Notch2-positive progenitors with the intrinsic ability to give rise to pancreatic ductal cells. Lab Invest. 2005;85:1003–1012. doi: 10.1038/labinvest.3700298. [DOI] [PubMed] [Google Scholar]
- Li M, Song L, Qin X. Glycan changes: cancer metastasis and anti-cancer vaccines. J Biosci. 2010;35:665–673. doi: 10.1007/s12038-010-0073-8. [DOI] [PubMed] [Google Scholar]
- Mayoral MA, Mayoral C, Meneses A, Villalvazo L, Guzman A, Espinosa B, et al. Identification of Galectin-3 and mucin-type O-glycans in breast cancer and its metastasis to brain. Cancer Invest. 2008;26:615–623. doi: 10.1080/07357900701837051. [DOI] [PubMed] [Google Scholar]
- Mellors A, Lo RY. O-sialoglycoprotease from Pasteurella haemolytica. Methods Enzymol. 1995;248:728–740. doi: 10.1016/0076-6879(95)48049-8. [DOI] [PubMed] [Google Scholar]
- Merighi S, Benini A, Mirandola P, Gessi S, Varani K, Leung E, et al. Modulation of the Akt/Ras/Raf/MEK/ERK pathway by A(3) adenosine receptor. Purinergic Signal. 2006;2:627–632. doi: 10.1007/s11302-006-9020-4. [DOI] [PMC free article] [PubMed] [Google Scholar]
- Moniaux N, Andrianifahanana M, Brand RE, Batra SK. Multiple roles of mucins in pancreatic cancer, a lethal and challenging malignancy. Br J Cancer. 2004;91:1633–1638. doi: 10.1038/sj.bjc.6602163. [DOI] [PMC free article] [PubMed] [Google Scholar]
- Nomoto M, Izumi H, Ise T, Kato K, Takano H, Nagatani G, et al. Structural basis for the regulation of UDP-N-acetyl-alpha-D-galactosamine: polypeptide N-acetylgalactosaminyl transferase-3 gene expression in adenocarcinoma cells. Cancer Res. 1999;59:6214–6222. [PubMed] [Google Scholar]
- Reis CA, David L, Correa P, Carneiro F, de Bolos C, Garcia E, et al. Intestinal metaplasia of human stomach displays distinct patterns of mucin (MUC1, MUC2, MUC5AC, and MUC6) expression. Cancer Res. 1999;59:1003–1007. [PubMed] [Google Scholar]
- Rosenzweig DH, Nair KS, Wei J, Wang Q, Garwin G, Saari JC, et al. Subunit dissociation and diffusion determine the subcellular localization of rod and cone transducins. J Neurosci. 2007;27:5484–5494. doi: 10.1523/JNEUROSCI.1421-07.2007. [DOI] [PMC free article] [PubMed] [Google Scholar]
- Ruiz-Avila L, McLaughlin SK, Wildman D, McKinnon PJ, Robichon A, Spickofsky N, et al. Coupling of bitter receptor to phosphodiesterase through transducin in taste receptor cells. Nature. 1995;376:80–85. doi: 10.1038/376080a0. [DOI] [PubMed] [Google Scholar]
- Spiro RG. Protein glycosylation: nature, distribution, enzymatic formation, and disease implications of glycopeptides bonds. Glycobiology. 2002;12:43R–56R. doi: 10.1093/glycob/12.4.43r. [DOI] [PubMed] [Google Scholar]
- Sutherlin ME, Nishimori I, Caffrey T, Bennett EP, Hassan H, Mandel U, et al. Expression of three UDP-N-acetyl-alpha-D-galactosamine: polypeptide GalNAc N-acetylgalactosaminyltransferases in adenocarcinoma cell lines. Cancer Res. 1997;57:4744–4748. [PubMed] [Google Scholar]
- Takenaka Y, Fukumori T, Raz A. Galectin-3 and metastasis. Glycoconj J. 2004;19:543–549. doi: 10.1023/B:GLYC.0000014084.01324.15. [DOI] [PubMed] [Google Scholar]
- Telford WG, King LE, Fraker PJ. Evaluation of glucocorticoid-induced DNA fragmentation in mouse thymocytes by flow cytometry. Cell Prolif. 1991;24:447–459. doi: 10.1111/j.1365-2184.1991.tb01173.x. [DOI] [PubMed] [Google Scholar]
- White T, Bennett EP, Takio K, Sorensen T, Bonding N, Clausen H. Purification and cDNA cloning of a human UDP-N-acetyl-alpha-D-galactosamine: polypeptide N-acetylgalactosaminyltransferase. J Biol Chem. 1995;270:24156–24165. doi: 10.1074/jbc.270.41.24156. [DOI] [PubMed] [Google Scholar]
- Wray CJ, Ahmad SA, Matthews JB, Lowy AM. Surgery for Pancreatic Cancer: Recent Controversies and Current Practice. Gastroenterology. 2005;128:1626–1641. doi: 10.1053/j.gastro.2005.03.035. [DOI] [PubMed] [Google Scholar]
Associated Data
This section collects any data citations, data availability statements, or supplementary materials included in this article.