Abstract
The cell–microenvironment interaction is critical for cells to perceive environmental cues and co-ordinate signaling cascades to regulate physiological functions. Herein, a soft-lithography technique, micropattern via micromolding in capillaries (MIMIC), is explored to create cell-adhesive micropatterns on glass coverslips. Genetically encoded Src and RhoA fluorescence resonance energy transfer (FRET) biosensors are used to monitor the Src and RhoA activities in nonpatterned cells (stochastically migrating cells, SMCs) and those constrained to grow on micropatterned surfaces (restrictedly migrating cells, RMCs). The results reveal that epidermal growth factor (EGF) induces a decrease of RhoA and an increase of Src activities with biphasic time courses in RMCs. In contrast, the time courses of such activities in SMCs upon EGF stimulation are relatively monophasic. The inhibition of Src activity, actin network, or myosin machinery abolishes the biphasic RhoA response upon EGF stimulation in RMCs. The results indicate that this microenvironment effect on the biphasic RhoA activation in RMCs is mediated by Src and actomyosin machinery. Through the integration of FRET and micropatterning technologies, it is demonstrated that the microenvironment impacts significantly on cell shapes and subsequently the spatiotemporal signaling network of RhoA and Src in living cells. The results help to advance mechanistic understanding of how cells perceive and interpret microenvironments to co-ordinate intracellular molecular signals and ultimately physiological responses.
Keywords: biosensors, cells, fluorescence resonance, energy transfer, lithography, pattern formation
1. Introduction
The cell–environment interaction is critical for cells to perceive the surrounding environment and control appropriate physiological functions. In particular, it is increasingly clear that cells are living in an environment full of microenvironments, which play a critical role in driving normal tissue development as well as tumor initiation and progression.[1] Microenvironments include the surrounding microstructures and their associated extracellular matrix (ECM), soluble factors, and neighboring cells.[2] The interaction between cells and their microenvironments can regulate cellular behavior and functions through a cascade of signaling events.[3,4] Innovative technologies have brought tremendous advancement in the development of biomaterials with elegant micro/nanostructures and properties.[5–8] However, there is a lack of understanding of the molecular mechanisms by which microenvironment controls cell shapes and subsequently signaling molecules at subcellular levels in living cells.
Soft lithography techniques using patterned polydimethylsiloxane (PDMS) molds and poly(vinyl alcohol) have provided powerful tools for creating micropatterns and studying their effects on cellular functions.[9–12] Therefore, microenvironmental cues can be manipulated in a spatially controlled manner, thus allowing precise control of both cell–ECM and cell–cell adhesions.[13] In notable prior work, Chen et al. demonstrated that the decreased cell adhesive area can suppress cell growth and induce cell apoptosis.[14] In addition, Lin and Helmke[15] have shown that the micropatterned structure can affect the morphological changes in response to shear stress in vascular endothelial cells. Nelson and Chen[16] designed a bowtie-shaped pattern on glass surfaces coated with fibronectin (Fn) to guide cells to form pairs. Cell–cell contacts in this case were simplified to junctions between only two neighboring cells with specific shapes. Under these well-controlled and adhesion-mediated environments, the results showed that cell proliferation can be positively regulated by cell–cell contacts.[16]
Traditional biochemical techniques have provided a tremendous amount of information on how signaling molecules interact inside cells to regulate cellular functions. It is generally necessary in these assays, however, to kill the cells and cause various levels of damage due to the fixation or lysis procedures, which may result in the alteration or loss of information. Biosensors based on fluorescence resonance energy transfer (FRET) provide a powerful tool to visualize and quantify the spatiotemporal molecular activities in living cells and study the cellular responses to the mechanical and material properties of the surrounding environment.[17–19] For example, an Src FRET biosensor (Src: a family member of proto-oncogenic tyrosine kinases) consisting of an SH2 domain and a specific substrate peptide concatenated between a cyan fluorescent protein (CFP) and a yellow fluorescent protein (YFP) has allowed the visualization of Src activation upon mechanical stimulation.[18,20] A synthetic oligopeptide with a FRET capability was successfully designed to monitor the cell traction force and mechanical stiffness of the substrate where cells are seeded.[21] FRET has also been applied to measure the RhoA (Ras homologue gene family, member A) activities at cell edges on top of micropatterned inert surfaces.[22] However, there is a lack of study on the effect of microenvironment on the cell shape and subsequently the molecular hierarchy and signaling cascades inside living cells.
Src and RhoA have been shown to play crucial roles for different cells to perceive the extracellular environment, including microenvironment,[23] ECM proteins,[24] and mechanical stiffness.[25] Besides the Src FRET biosensors developed in our laboratory,[18,20] FRET-based RhoA biosensors have also been developed to visualize the spatiotem-poral dynamics of RhoA activities in living cells.[26,27] Matsuda's research group developed a RhoA biosensor (Raichu-RhoA-1737x) which contains sequentially CFP, RhoA (amino acid 1-189), a flexible linker, the RhoA-binding domain (RBD) from its substrate molecule PKN, and Venus (a YFP variant).[27] The activation of RhoA can induce intramolecular binding between RhoA and the RBD, which leads to a change of distance/orientation between the CFP and Venus, and enhances FRET signals.[27–31] Another FRET RhoA biosensor was independently developed by Hahn's group, which contained sequentially a full-length RhoA, CFP, a flexible linker, YFP, and the RBD of rhotekin.[26] This biosensor has also been successfully applied to the study of various cellular functions, including migration and polarity during chemotaxis.[26,32,33]
In this work, we explored a soft lithography technique, micropattern via micromolding in capillaries (MIMIC), to pattern the cell-adhesive protein Fn and cell-repulsive component Pluronic 127 into defined geometries on silanized glass coverslips. In combination with genetically encoded FRET biosensors, this technique allows the investigation of the effect of microenvironment on signal transduction in living cells. As such, we monitored the activities of Src and RhoA in nonpatterned HeLa cells (stochastically migrating cells, SMCs) and those constrained to grow on micropatterned surfaces (restrictedly migrating cells, RMCs). Our results revealed that the basal levelofRhoA activity is higher and that of Src activity is lower in RMCs on Fn-coated strips (10mm in width) as compared to SMCs. Interestingly, epidermal growth factor (EGF) induced a different response of RhoA and Src in RMCs compared to that in SMCs. Further results indicate that the effect of microenvironment on RhoA is mediated by Src and the actomyosin machinery. Therefore, microenviron-ments can significantly affect the spatiotemporal activation patterns of RhoA and Src in living cells, possibly through the regulation of cell shapes and intracellular stress.[34]
2. Results and Discussion
Fn is an ECM protein to which HeLa cells attach preferentially over hydrophobic surfaces.[35] Pluronic 127 is a nontoxic triblock copolymer (polyethylene glycol–polypro-pylene glycol–polyethylene glycol), which can protect the surface from Fn adsorption and cell adhesion.[36] In this work, Fn and Pluronic 127 were combined to create adhesive and repulsive regions for cell cultures on the glass surface, respectively.[37]
To create patterned microenvironments on the silanized glass, we applied the MIMIC and channel-outgas techniques (Figure 1A). The PDMS mold was first spontaneously sealed on the silanized/oxidized glass to form a network of empty channels.[38] Fn solution was then applied to the inlet of the channels to fill the space. The channel-outgas technique was further applied to aspirate the gas inside the channels and allow the atmospheric pressure to compel the Fn solution to flow through the channels to the outlet.[39] After the adsorbed Fn layer was dried, the PDMS mold was removed to allow the incubation of Pluronic 127. As such, Fn can be patterned as 10-μm strips surrounded by Pluronic 127-covered spaces on glass (Figure 1B). HeLa cells transfected with FRET biosensors were then cultured on the Fn/Pluronic-patterned glass to examine the pattern efficacy. The cells adhered exclusively to the Fn strips and remained in those regions for at least 24h (Figure 1C). The cells transfected with FRET biosensors were also successfully constrained to grown on these patterns (Figure 1D).
Figure 1.
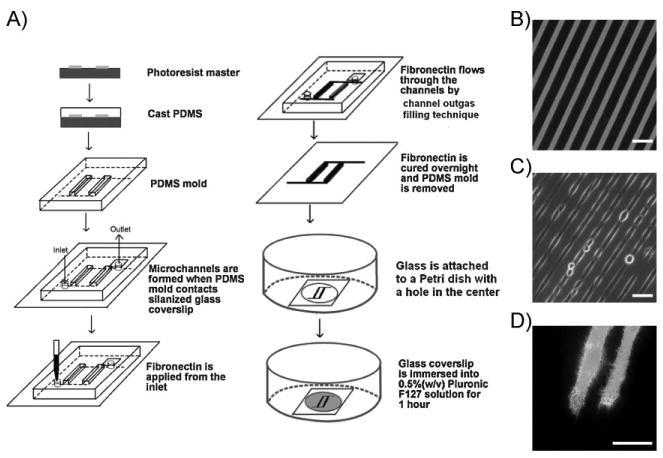
Micropatterning on the silanized glass. A) Schematic drawing of the procedure for MIMIC. B) Fluorescence image of a pattern of NHS-rhodamine-conjugated Fn on silanized glass. C) Phase-contrast image (40×) of transfected HeLa cells cultured on the patterned surface for 3 h. D) Emission ratio images (100×) of the RhoA biosensor in transfected HeLa cells cultured on the patterned surface for 3 h. Scale bars: 40 μm.
We then examined the effects of the micropatterns on the signaling events in living cells. FRET biosensors were applied to characterize the spatiotemporal activation of RhoA and Src in RMCs or SMCs.[18,40] As shown in Figure 2A, the RhoA activity in RMCs was higher at the cell periphery than the perinuclear regions. Interestingly, RhoA activity in SMCs formed ringlike patterns, which alternated between high and low levels in regions extending from the cell edge to the nucleus (Figure 2B). While the molecular details of these ring structures in RhoA activities await further exploration, the outer ring with high RhoA activity may result from the nascent and dynamic integrin activation at the cell periphery,[41] whereas the inner ring may represent the relatively high stress occurring at the convergent zone where retrograde actin flow of the lamella meets the anterograde actin flow of the cell body.[42,43] Despite the same Fn density on patterned and non-patterned surfaces, EGF clearly induced a biphasic decrease of RhoA activity in RMCs (after an initial decrease, the RhoA activity bounced back and then decreased again; Figure 2A), whereas the response in SMCs appeared to be relatively monophasic (the RhoA activity continuously decreased after stimulation; Figure 2B). Indeed, the RhoA activity in a RMC is higher at 15.4 min than that at 2.3 or 48.4 min after EGF stimulation (Figure 2A). Statistical analysis further revealed that the basal level of RhoA activity in RMCs was significantly higher than that in SMCs (Figure 2C). Averaged and normalized time courses of RhoA activity also indicate that RMCs caused a biphasic decrease of RhoA, with a significant difference between RMCs and SMCs occurring around 5 min after EGF stimulation (Figure 2D). These results suggest that the microenvironment consisting of Fn patterns, possibly through its effect on cell shapes, markedly altered the RhoA activities before and after EGF stimulation.
Figure 2.
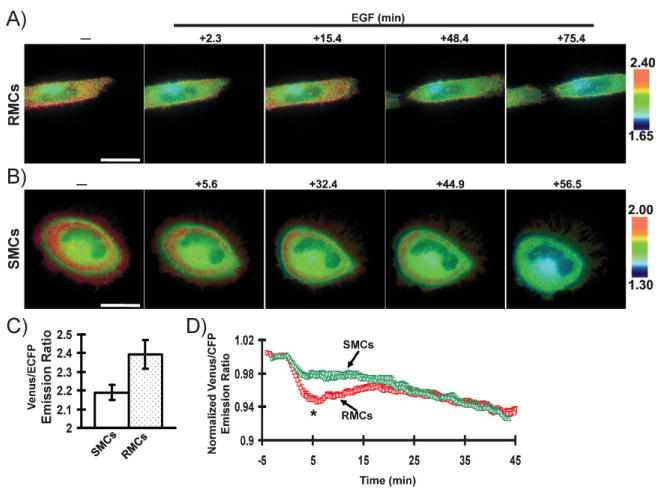
FRET response of the RhoA biosensor in living cells. A,B) Venus/enhanced cyan fluorescent protein (ECFP) emission ratio images of the RhoA biosensor before and after EGF (50 ng mL_1) stimulation at various time periods as indicated for A) RMCs or B) SMCs. C) Averaged basal level of Venus/ECFP emission ratio of the RhoA biosensor before EGF stimulation in RMCs (cell number = 30) and SMCs (cell number=31), as indicated. D) Time courses of normalized Venus/ECFP emission ratio (mean ± standard error of the mean, SEM) of the RhoA biosensor in RMCs (cell number =9) and SMCs (cell number = 6).The * represents a statistically significant difference between RMCs and SMCs at the indicated time point. Scale bars: 40 μm.
Since Src kinase has been shown to downregulate RhoA activity in response to integrin activation,[44] we tested the hypothesis that Src activity is also manipulated by micro-patterned Fn surfaces. As shown in Figure 3A, Src activity displayed a biphasic increase in RMCs when challenged by EGF. In contrast, SMCs had a monophasic activation of Src in response to EGF (Figure 3B). A lower basal level of Src activity was also observed in RMCs (Figure 3C). Statistical analysis further confirmed the biphasic increase of Src activity in RMCs, with a significant difference between RMCs and SMCs occurring at 5min upon EGF stimulation (Figure 3D). These results suggest that the Fn microenvironment had a counter-weighting effect on the Src and RhoA activities in response to EGF.
Figure 3.
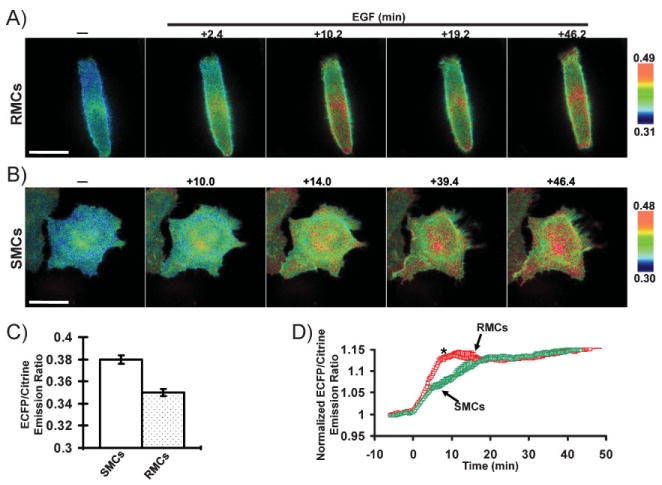
FRET response of the Src biosensor in living cells. A,B) ECFP/Citrine emission ratio images of the Src biosensor before and after EGF (50 ng mL_1) stimulation at various time periods as indicated in A) RMCs or B) SMCs. C) Averaged basal level of the ECFP/Citrine emission ratio of the Src biosensor before EGF stimulation in RMCs (cell number = 71) and SMCs (cell number=43). D) Time courses of normalized ECFP/Citrine emission ratio (mean±SEM) of the Src biosensor in RMCs (cell number=7) and SMCs (cell number=5). The * represents a statistically significant difference between RMCs and SMCs at the indicated time point. Scale bars: 40 μm.
Previous studies suggest that Src activity regulates RhoA via p190RhoGAP.[44] In fact, Src can phosphorylate and hence activate p190RhoGAP, which can lead to a decrease in the RhoA activity.[45] Hence, the activation of Src is inversely correlated with that of RhoA. The counter-weighted responses of RhoA and Src upon EGF stimulation observed in our study are thus in line with these previous studies. Further experiments revealed that PP1, an inhibitor of Src family tyrosine kinases, eliminated the EGF-induced biphasic decrease of RhoA activity in RMCs (Figure 4A). In contrast, the RhoA activity in SMCs was not significantly affected by PP1 (Figure 4B). These results suggest that the microenvironment effect on RhoA activity in response to EGF is mediated by src kinase.
Figure 4.
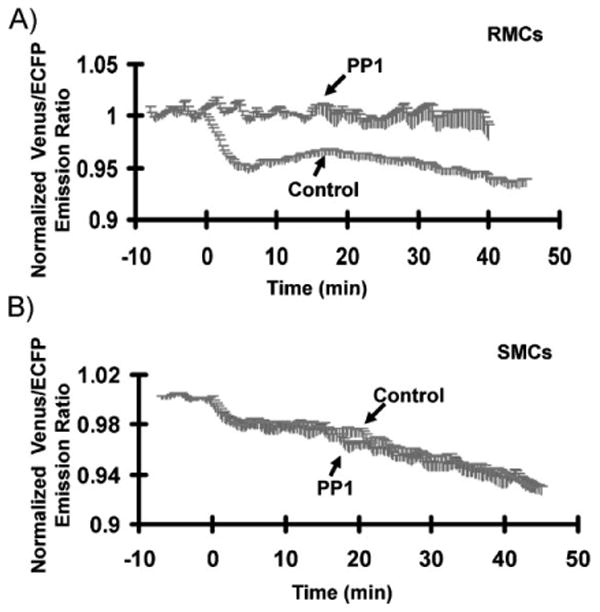
Role of Src in mediating the microenvironmental effect on the FRET response of the RhoA biosensor. A,B) Time courses of normalized Venus/ECFP emission ratio (mean ± SEM) of the RhoA biosensor in response to EGF in A) RMCs and B) SMCs pretreated with (“PP1”) (the cell numbers for RMC and SMC are 4 and 6, respectively) or without PP1 (“Control”) (the cell numbers for RMC and SMC are 9 and 6, respectively), as indicated.
Since Src has been well documented to connect integrins and the actin cytoskele-ton,[24] which are major players regulating RhoA activity,[34] we reasoned that Src may mediate the micropattern effect on the EGF-regulated RhoA activity via the actin network. Indeed, the disruption of cytoske-letal actin filaments by cytochalasin D eliminated the biphasic RhoA response upon EGF stimulation in RMCs (Figure 5A). The modulation of actomyosin contractility by the inhibition of myosin light chain kinase (MLCK) with ML-7[46,47] or of myosin II with blebbistatin[48] also abolished the biphasic RhoA response upon EGF stimulation in RMCs (Figure 5B). Consistently, the higher basal level of RhoA activity in RMCs was inhibited by the treatment with cytochalasin D, ML-7, or blebbistatin (Figure 5C). Given the important roles of actin filaments, MLCK, and myosin in regulating actomyosin machinery,[49,50] it appears that the micropattern and its subsequent effect on cell shapes affect the Src activity and actomyosin machinery to regulate the mechanical tension and RhoA activity. In fact, there is ample evidence indicating that the actomyosin contractility and mechanical tension play crucial roles in regulating how cells perceive and interpret chemomechanical microenvironments.[23,25,51] Therefore, the micropattern and its subsequent impact on cell shape/structure may affect intracellular stress.[52] This altered intracellular stress may affect the conformational changes or interactions between signaling molecules to regulate a coordinated distribution of Src and RhoA activity. Indeed, it has been shown that mechanical tension can directly stretch intracellular molecules and expose their domains to affect the molecular interaction and cell physiology.[51,53] It remains unclear, however, as to which molecules are the initial sensing elements in perceiving these microenvironmental cues and converting them into intracellular biochemical signals. Future studies are warranted to explore and identify the signaling molecules upstream to Src kinase that operate as the initial transduction elements.
Figure 5.
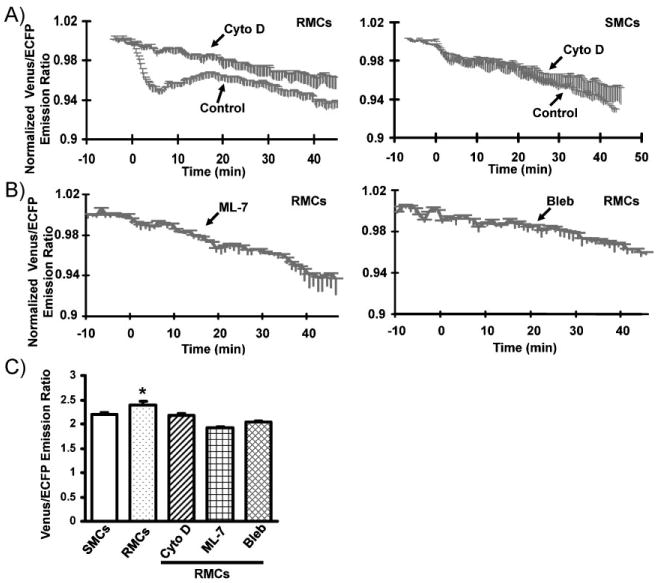
Role of actomyosin in mediating the microenvironmental effect on the FRET response of the RhoA biosensor. A,B) Time courses of normalized Venus/ECFP emission ratio (mean±SEM) of the RhoA biosensor in response to EGFin A) RMCsand SMCs pretreated with (“Cyto D”) (the cell numbers for RMC and SMC are 4 and 6, respectively) or without cytochalasin D (“Control”) (the cell numbers for RMC and SMC are 9 and 6, respectively), and in B) RMCs pretreated with ML-7 (“ML-7”; cell number=5) or blebbistatin (“Bleb”; cell number=5), as indicated. C) Bar graph representing the averaged basal level of the Venus/ECFP emission ratio (mean±SEM) of the RhoA biosensor before EGF stimulation in SMCs (cell number = 31), or in RMCs (cell number = 30) with or without pretreatment by the inhibitors cytochalasin D (Cyto D), ML-7, or blebbistatin (Bleb). The * represents a statistically significant difference between the indicated group (the control RMCs without inhibitor treatment) and all the other groups (SMCs, and the RMCs treated with different inhibitors).
The biphasic responses of Src and RhoA in RMCs upon EGF stimulation are also intriguing. Although the detailed molecular mechanism awaits further investigation, a possible scenario could be as follows. The initial increase of Src and decrease of RhoA in response to EGF are accompanied by a concomitant cell-body expansion, which quickly reaches the lateral boundary of the patterned Fn strip. The subsequently forced arrest of cell-body progression induces the buildup of intracellular tension, which causes the decline of Src activity and the resurgence of RhoA activity. The cell eventually finds its way to expand along the strip direction, which releases the tension and leads to the ultimate Src increase and RhoA decline. This is consistent with the current understanding that RhoA and Src are associated with the induction and dissipation of the intracellular tension, respectively.[24,54] In support of this note, the inhibition of actomyosin machinery, which diminishes the cellular tension, abolished the biphasic responses of RhoA in RMCs (Figure 5A,B).
3. Conclusions
In summary, with genetically encoded FRET biosensors, we have successfully visualized the molecular activities in cells constrained on micropatterned surfaces. Our results revealed that Src and RhoA activities are differentially regulated in response to EGF in RMCs as compared to SMCs. Both Src and RhoA displayed biphasic responses in RMCs, but not in SMCs. Src activity and its related actomyo-sin machinery mediate this microenviron-mental effect on the biphasic response of RhoA activity. These results suggest that microenvironment may regulate a coordinated molecular hierarchy of Src and RhoA to impact on the physiological properties of cells. The information obtained could advance our mechanistic understanding of how cells perceive and interpret microenvironments to coordinate intracellular molecular signals and ultimately physiological responses.
4. Experimental Section
Preparation of the molds
PDMS molds were created by casting the prepolymer of PDMS against silicon masters developed by photolithography. In general, silicon wafers were first cleaned with a piranha wet etch (H2SO4/H2O2, volume ratio = 7:3), followed by a deionized water rinse and baking at 200°C for 5 min to remove the water. The wafers were then spin-coated with a negative photoresist SU8 2015 at 3000 rpm for 30 s and then baked at 95°C for 3 min. Photoresist-coated wafers were exposed to UV light (exposure energy 140 mJ cm&minus2) through transparent masks for 22 s and subsequently baked at 95°C for 3 min. Exposed wafers were developed by SU8 developer for 3 min, rinsed, and dried. The silicon masters were rinsed with 2% sodium dodecyl sulfate solution and blow-dried to aid subsequent release of the PDMS. Prepolymer of PDMS was poured over the silicon masters and cured at 60°C overnight. The elastomeric molds with the negative pattern of the silicon masters were peeled off to prepare for further experimental procedures.
Micropattern via micromolding in capillaries (MIMIC)
Glass coverslips were cleaned with a piranha wet etch (H2SO4/H2O2, volume ratio = 7:3) for 20 min followed by a deionized water rinse and blown dry. Cleaned glass coverslips were immersed in 2% dimethyldichlorosilane in chlorobenzene for 10s, rinsed with acetone, ethanol, and deionized water, blow-dried, and oxidized by UV-generated ozone for 1 min. The PDMS molds were also rinsed thoroughly with acetone, ethanol, and deionized water. The molds were then dried and placed on the silanized glass coverslips. Inlet and outlet holes 2 mm in diameter were punched with a dermal biopsy punch. A drop of rhodamine-labeled Fn solution (40 μg mL_1) was applied to the inlet. The channel-outgas filling technique was used to apply a vacuum to lead the solution from the inlet, down the channel, and finally to the outlet. The microfluidic samples were placed at room temperature overnight to allow the surface deposition of Fn before the PDMS molds were peeled off. Subsequently, the glass coverslips were assembled with Petri dishes to form glass-bottomed dishes. Pluronic F127 (0.5%, w/v) in phosphate-buffered saline (PBS) was then applied to these dishes to cover the glass surface for 1 h before rinsing with PBS (Figure 1).
Cell culture
HeLa cells were cultured in Dulbecco's modified Eagle's medium (DMEM) supplemented with 10% fetal bovine serum (FBS). The cells were transfected with plasmids using lipofectamine 2000 (Invitrogen) and starved with 0.5% FBS for 36-48 h. The transfected cells were then suspended by trypsin-EDTA and seeded on Fn-patterned or nonpatterned glass-bottomed dishes for 3-6 h before EGF stimulation.
Microscopy, image acquisition, and analysis
Before imaging, the cell culture medium was changed to CO2-independent medium (Invitrogen) with 0.5% FBS. For detection of FRET, the cells were maintained on the microscope stage at 37°C. The cells were imaged on a Zeiss Axiovert microscope equipped with a cooled CCD camera and controlled by MetaFluor 6.2 software. An excitation filter of 420/20 nm, a dichroic mirror of 450 nm, and emission filters of 475/40 nm for ECFP and of 535/25 nm for Venus/Citrine were applied for imaging. A neutral density (typically 1 or 5%) was used to control the excitation light intensity so that the photobleaching effect was minimal and undetectable in our system. The time interval for each imaging acquisition was set to be 60 s. The ratiometric images of Venus/ECFP (for the RhoA biosensor,[27] a kind gift from Dr. Michiyuki Matsuda at Kyoto University, Japan) or ECFP/Citrine (for the Src biosensor[18]) were computed and generated by the MetaFluor software to represent the spatiotemporal FRET signals. Statistical analysis was performed by using a Student's t-test function of the Excel software (Microsoft) to evaluate the statistical difference between groups. A significant difference was determined by P value (<0.05).
Acknowledgments
We thank Drs. Roger Y. Tsien and Michiyuki Matsuda for precious reagents and constructs. Thanks also to Prof. Bruce Wheeler for help in editing the manuscript. This work was supported in part by grants from the Wallace H. Coulter Foundation and Beckman Laser Institute, Inc. (Y.W.)
Footnotes
Rho small GTPases, member A; Src: a family member of proto-oncogenic tyrosine kinases; FRET: fluorescence resonance energy transfer.
Contributor Information
Tae-Jin Kim, Neuroscience Program, University of Illinois at Urbana-Champaign, IL 61801 (USA).
Jing Xu, Department of Bioengineering and The Beckman Institute for Advanced Science and Technology, University of Illinois at Urbana-Champaign, IL 61801 (USA).
Rui Dong, Dr., Department of Chemistry, University of Illinois at Urbana-Champaign, IL 61801 (USA)
Dr. Shaoying Lu, Department of Bioengineering and The Beckman Institute for Advanced Science and Technology, University of Illinois at Urbana-Champaign, IL 61801 (USA)
Prof. Ralph Nuzzo, Department of Chemistry, University of Illinois at Urbana-Champaign, IL 61801 (USA)
Prof. Yingxiao Wang, Neuroscience Program, University of Illinois at Urbana-Champaign, IL 61801 (USA) yingxiao@uiuc.edu; Department of Bioengineering and The Beckman Institute for Advanced Science and Technology, University of Illinois at Urbana-Champaign, IL 61801 (USA); Department of Molecular and Integrative Physiology and Center for Biophysics and Computational Biology, Institute of Genomic Biology, University of Illinois at Urbana-Champaign, IL 61801 (USA)
References
- 1.Hanahan D, Weinberg RA. Cell. 2000;100:57–70. doi: 10.1016/s0092-8674(00)81683-9. [DOI] [PubMed] [Google Scholar]
- 2.Nelson CM, Bissell MJ. Annu Rev Cell Dev Biol. 2006;22:287–309. doi: 10.1146/annurev.cellbio.22.010305.104315. [DOI] [PMC free article] [PubMed] [Google Scholar]
- 3.Cukierman E, Pankov R, Yamada KM. Curr Opin Cell Biol. 2002;14:633–639. doi: 10.1016/s0955-0674(02)00364-2. [DOI] [PubMed] [Google Scholar]
- 4.Saneinejad S, Shoichet MS. J Biomed Mater Res. 1998;42:13–19. doi: 10.1002/(sici)1097-4636(199810)42:1<13::aid-jbm3>3.0.co;2-r. [DOI] [PubMed] [Google Scholar]
- 5.Liu GY, Amro NA. Proc Natl Acad Sci USA. 2002;99:5165–5170. doi: 10.1073/pnas.072695699. [DOI] [PMC free article] [PubMed] [Google Scholar]
- 6.Liu M, Amro NA, Liu GY. Annu Rev Phys Chem. 2008;59:367–386. doi: 10.1146/annurev.physchem.58.032806.104542. [DOI] [PubMed] [Google Scholar]
- 7.Yim EK, Leong KW. Nanomedicine. 2005;1:10–21. doi: 10.1016/j.nano.2004.11.008. [DOI] [PubMed] [Google Scholar]
- 8.Wang X, Liu C. Nano Lett. 2005;5:1867–1872. doi: 10.1021/nl051016w. [DOI] [PubMed] [Google Scholar]
- 9.Vielmetter J, Stolze B, Bonhoeffer F, Stuermer CA. Exp Brain Res. 1990;81:283–287. doi: 10.1007/BF00228117. [DOI] [PubMed] [Google Scholar]
- 10.Cheng CM, LeDuc PR. Mol Biosyst. 2006;2:299–303. doi: 10.1039/b606496p. [DOI] [PubMed] [Google Scholar]
- 11.Takayama S, Ostuni E, LeDuc P, Naruse K, Ingber DE, Whitesides GM. Nature. 2001;411:1016. doi: 10.1038/35082637. [DOI] [PubMed] [Google Scholar]
- 12.Kubicek JD, Brelsford S, Ahluwalia P, LeDuc PR. Langmuir. 2004;20:11552–11556. doi: 10.1021/la0487646. [DOI] [PubMed] [Google Scholar]
- 13.Chen CS, Jiang XY, Whitesides GM. MRS Bull. 2005;30:194–201. [Google Scholar]
- 14.Chen CS, Mrksich M, Huang S, Whitesides GM, Ingber DE. Science. 1997;276:1425–1428. doi: 10.1126/science.276.5317.1425. [DOI] [PubMed] [Google Scholar]
- 15.Lin X, Helmke BP. Biophys J. 2008;95:3066–3078. doi: 10.1529/biophysj.107.127761. [DOI] [PMC free article] [PubMed] [Google Scholar]
- 16.Nelson CM, Chen CS. FEBS Lett. 2002;514:238–242. doi: 10.1016/s0014-5793(02)02370-0. [DOI] [PubMed] [Google Scholar]
- 17.Tsien RY. Annu Rev Biochem. 1998;67:509–544. doi: 10.1146/annurev.biochem.67.1.509. [DOI] [PubMed] [Google Scholar]
- 18.Wang Y, Botvinick EL, Zhao Y, Berns MW, Usami S, Tsien RY, Chien S. Nature. 2005;434:1040–1045. doi: 10.1038/nature03469. [DOI] [PubMed] [Google Scholar]
- 19.Wang Y, Shyy JY, Chien S. Annu Rev Biomed Eng. 2008;10:1–38. doi: 10.1146/annurev.bioeng.010308.161731. [DOI] [PubMed] [Google Scholar]
- 20.Na S, Collin O, Chowdhury F, Tay B, Ouyang M, Wang Y, Wang N. Proc Natl Acad Sci USA. 2008;105:6626–6631. doi: 10.1073/pnas.0711704105. [DOI] [PMC free article] [PubMed] [Google Scholar]
- 21.Kong HJ, Polte TR, Alsberg E, Mooney DJ. Proc Natl Acad Sci USA. 2005;102:4300–4305. doi: 10.1073/pnas.0405873102. [DOI] [PMC free article] [PubMed] [Google Scholar]
- 22.Hodgson L, Chan EW, Hahn KM, Yousaf MN. J Am Chem Soc. 2007;129:9264–9265. doi: 10.1021/ja072900m. [DOI] [PubMed] [Google Scholar]
- 23.McBeath R, Pirone DM, Nelson CM, Bhadriraju K, Chen CS. Dev Cell. 2004;6:483–495. doi: 10.1016/s1534-5807(04)00075-9. [DOI] [PubMed] [Google Scholar]
- 24.Thomas SM, Brugge JS. Annu Rev Cell Dev Biol. 1997;13:513–609. doi: 10.1146/annurev.cellbio.13.1.513. [DOI] [PubMed] [Google Scholar]
- 25.Engler AJ, Sen S, Sweeney HL, Discher DE. Cell. 2006;126:677–689. doi: 10.1016/j.cell.2006.06.044. [DOI] [PubMed] [Google Scholar]
- 26.Pertz O, Hodgson L, Klemke RL, Hahn KM. Nature. 2006;440:1069–1072. doi: 10.1038/nature04665. [DOI] [PubMed] [Google Scholar]
- 27.Yoshizaki H, Ohba Y, Kurokawa K, Itoh RE, Nakamura T, Mochizuki N, Nagashima K, Matsuda M. J Cell Biol. 2003;162:223–232. doi: 10.1083/jcb.200212049. [DOI] [PMC free article] [PubMed] [Google Scholar]
- 28.Yoshizaki H, Ohba Y, Parrini MC, Dulyaninova NG, Bresnick AR, Mochizuki N, Matsuda M. J Biol Chem. 2004;279:44756–44762. doi: 10.1074/jbc.M402292200. [DOI] [PubMed] [Google Scholar]
- 29.Nakamura T, Aoki K, Matsuda M. Brain Res Mol Brain Res. 2005;139:277–287. doi: 10.1016/j.molbrainres.2005.05.030. [DOI] [PubMed] [Google Scholar]
- 30.Kurokawa K, Matsuda M. Mol Biol Cell. 2005;16:4294–4303. doi: 10.1091/mbc.E04-12-1076. [DOI] [PMC free article] [PubMed] [Google Scholar]
- 31.Yamana N, Arakawa Y, Nishino T, Kurokawa K, Tanji M, Itoh RE, Monypenny J, Ishizaki T, Bito H, Nozaki K, Hashimoto N, Matsuda M, Narumiya S. Mol Cell Biol. 2006;26:6844–6858. doi: 10.1128/MCB.00283-06. [DOI] [PMC free article] [PubMed] [Google Scholar]
- 32.El-Sibai M, Pertz O, Pang H, Yip SC, Lorenz M, Symons M, Condeelis JS, Hahn KM, Backer JM. Exp Cell Res. 2008;314:1540–1552. doi: 10.1016/j.yexcr.2008.01.016. [DOI] [PMC free article] [PubMed] [Google Scholar]
- 33.Wong K, Pertz O, Hahn K, Bourne H. Proc Natl Acad Sci USA. 2006;103:3639–3644. doi: 10.1073/pnas.0600092103. [DOI] [PMC free article] [PubMed] [Google Scholar]
- 34.Jaffe AB, Hall A. Annu Rev Cell Dev Biol. 2005;21:247–269. doi: 10.1146/annurev.cellbio.21.020604.150721. [DOI] [PubMed] [Google Scholar]
- 35.Tan JL, Tien J, Chen CS. Langmuir. 2002;18:519–523. [Google Scholar]
- 36.Amiji M, Park K. Biomaterials. 1992;13:682–692. doi: 10.1016/0142-9612(92)90128-b. [DOI] [PubMed] [Google Scholar]
- 37.Tan JL, Liu W, Nelson CM, Raghavan S, Chen CS. Tissue Eng. 2004;10:865–872. doi: 10.1089/1076327041348365. [DOI] [PubMed] [Google Scholar]
- 38.Xia YN, Whitesides GM. Angew Chem. 1998;110:568–594. [Google Scholar]; Angew Chem Int Ed. 1998;37:551–575. [Google Scholar]
- 39.Monahan J, Gewirth AA, Nuzzo RG. Anal Chem. 2001;73:3193–3197. doi: 10.1021/ac001426z. [DOI] [PubMed] [Google Scholar]
- 40.Kurokawa K, Nakamura T, Aoki K, Matsuda M. Biochem Soc Trans. 2005;33:631–634. doi: 10.1042/BST0330631. [DOI] [PubMed] [Google Scholar]
- 41.Vielkind S, Gallagher-Gambarelli M, Gomez M, Hinton HJ, Cantrell DA. J Immunol. 2005;175:350–357. doi: 10.4049/jimmunol.175.1.350. [DOI] [PubMed] [Google Scholar]
- 42.Salmon WC, Adams MC, Waterman-Storer CM. J Cell Biol. 2002;158:31–37. doi: 10.1083/jcb.200203022. [DOI] [PMC free article] [PubMed] [Google Scholar]
- 43.Eichorst JP, Lu S, Xu J, Wang Y. PLoS One. 2008;3:E4082. doi: 10.1371/journal.pone.0004082. [DOI] [PMC free article] [PubMed] [Google Scholar]
- 44.Arthur WT, Petch LA, Burridge K. Curr Biol. 2000;10:719–722. doi: 10.1016/s0960-9822(00)00537-6. [DOI] [PubMed] [Google Scholar]
- 45.Dumenil G, Sansonetti P, Van Nhieu GT. J Cell Sci. 2000;113:71–80. doi: 10.1242/jcs.113.1.71. [DOI] [PubMed] [Google Scholar]
- 46.Fincham VJ, Brunton VG, Frame MC. Mol Cell Biol. 2000;20:6518–6536. doi: 10.1128/mcb.20.17.6518-6536.2000. [DOI] [PMC free article] [PubMed] [Google Scholar]
- 47.Higuchi H, Takemori S. J Biochem (Tokyo) 1989;105:638–643. doi: 10.1093/oxfordjournals.jbchem.a122717. [DOI] [PubMed] [Google Scholar]
- 48.Bertrand J, Winton MJ, Rodriguez-Hernandez N, Campenot RB, McKerracher L. J Neurosci. 2005;25:1113–1121. doi: 10.1523/JNEUROSCI.3931-04.2005. [DOI] [PMC free article] [PubMed] [Google Scholar]
- 49.Hartshorne DJ, Siemankowski RF. Annu Rev Physiol. 1981;43:519–530. doi: 10.1146/annurev.ph.43.030181.002511. [DOI] [PubMed] [Google Scholar]
- 50.Ye LH, Hayakawa K, Lin Y, Okagaki T, Fujita K, Kohama K. J Biochem. 1994;116:1377–1382. doi: 10.1093/oxfordjournals.jbchem.a124690. [DOI] [PubMed] [Google Scholar]
- 51.Johnson CP, Tang HY, Carag C, Speicher DW, Discher DE. Science. 2007;317:663–666. doi: 10.1126/science.1139857. [DOI] [PMC free article] [PubMed] [Google Scholar]
- 52.Nelson CM, Jean RP, Tan JL, Liu WF, Sniadecki NJ, Spector AA, Chen CS. Proc Natl Acad Sci USA. 2005;102:11594–11599. doi: 10.1073/pnas.0502575102. [DOI] [PMC free article] [PubMed] [Google Scholar]
- 53.Sawada Y, Tamada M, Dubin-Thaler BJ, Cherniavskaya O, Sakai R, Tanaka S, Sheetz MP. Cell. 2006;127:1015–1026. doi: 10.1016/j.cell.2006.09.044. [DOI] [PMC free article] [PubMed] [Google Scholar]
- 54.Matthews BD, Overby DR, Mannix R, Ingber DE. J Cell Sci. 2006;119:508–518. doi: 10.1242/jcs.02760. [DOI] [PubMed] [Google Scholar]


