

Abstract
Objective
CD4+FoxP3+ regulatory T cells (Treg) suppress effector T cells and prevent autoimmune disease. Treg function is deficient in active rheumatoid arthritis (RA), a loss which may play a role in the pathogenesis of this disease. We previously showed that a single nucleotide polymorphism in the Fc Receptor Like-3 (FCRL3) gene led to higher expression of FcRL3 on Treg+ and that FcRL3 Treg are functionally deficient in comparison to FcRL3− Treg. The objective of this work was to investigate the potential role of FcRL3 in rheumatoid arthritis.
Methods
A cross-sectional study was performed to evaluate the FCRL3 -169 genotype and FcRL3 expression on T cell subsets, including Treg, from peripheral blood samples of 51 patients with RA enrolled in the UCSF RA Cohort. Clinical data were obtained from the UCSF RA Cohort database.
Results
We found that patients with the FCRL3 -169C allele (genotype C/C or C/T) expressed significantly higher levels of FcRL3 on Treg, and on CD8+ and TCRγδ+ T cells, in comparison to RA patients with the T/T genotype. Higher FcRL3 expression on these T cell subpopulations correlated with RA disease activity in those patients harboring the FCRL3 -169C allele. Furthermore, FcRL3 expression on Treg was higher in patients with erosive RA disease and the FCRL3 -169C allele was overrepresented in patients with erosive RA disease.
Conclusion
FcRL3 expression, which is strongly associated with the presence of the FCRL3 -169C allele, may serve as a biomarker of RA disease activity.
Rheumatoid arthritis (RA) is a debilitating inflammatory arthritis affecting 1% of the world’s population. The etiology of RA is multifactorial and our knowledge of the specific environmental and genetic factors leading to and sustaining aberrant immune activation in the disease is limited. Regulatory T cells (Treg) are a subset of T cells that are critical in maintaining immune self-tolerance and preventing autoimmune disease1; as such, they may play a key role in RA pathogenesis. Treg mediate an inhibitory effect on immune activity by suppressing the proliferation and function of effector T cells. In mouse models of RA, adoptive transfer of Treg results in resolution of arthritis2. Studies utilizing peripheral blood samples from patients with RA have shown that Treg are functionally deficient and, moreover, anti-tumor necrosis factor (TNF) treatment restores Treg function in these patients3–6.
Recent work from our laboratory and from others has identified a transmembrane cell surface receptor, Fc Receptor Like-3 (FcRL3), that is highly expressed on CD4+ Treg but not on conventional CD4+ T cells7,8. FcRL3 is also expressed on other T cell subsets, B cells, and NK cells7,9,10. FcRL3 is part of a genetically-conserved gene family bearing high structural homology to classical Fc receptors, with multiple extracellular Ig domains and with intracellular domains that carry either immunoreceptor tyrosine based activation motifs (ITAMs), immunoreceptor tyrosine based inhibition motifs (ITIMs), or both11. Given these signaling domains and expression on multiple immune cell types, the FcRL family members likely modulate immune cell functions by affecting signaling pathways11–13.
No physiologic function has been ascribed to FcRL3 and its ligand is unknown. The presence of both ITAMs and ITIMs in the FcRL3 intracellular domain suggest that engagement of it by cognate ligand might enhance or inhibit cell function. In vitro studies utilizing the FcRL3 intracellular domain have shown that it may serve as a negative regulator of B cell receptor signaling14. Our lab has demonstrated that FcRL3+ Treg are less capable of suppressing effector T cell proliferation in vitro than their FcRL3− Treg counterparts8. Taken together, these data suggest FcRL3 may also function as a negative regulator of Treg function.
A single nucleotide polymorphism (SNP) in FCRL3 located in the promoter (-169 T→C, FCRL3_3, rs7528684) leads to enhanced NFκB binding and to increased FCRL3 promoter activity9. The FCRL3 -169C variant is associated with higher expression of FcRL3 on Treg and B cells8,9,15 and has been identified as a potential genetic risk factor in multiple autoimmune diseases, including RA, autoimmune pancreatitis, systemic lupus erythematosus, and autoimmune thyroid disease9,16,17. FcRL3 may therefore lie within a common pathway in autoimmune disease pathogenesis. In this study, we investigated the relevance of FcRL3 to RA disease by examining associations between the FCRL3 -169C variant, FcRL3 expression on FcRL3-expressing T cells subsets and B cells, RA disease activity, and erosive RA disease.
Materials and Methods
Study subjects
A total of 51 patients were recruited from the UCSF RA Cohort. All patients gave written informed consent using protocols approved by the UCSF Committee on Human Research. Patients who were seropositive for HIV and/or hepatitis C, over the age of 65, or with a history of an infection in the prior month were excluded. All patients met the 1987 American Rheumatism Association criteria for RA18. All clinical, lab, and radiographic parameters were ascertained through the UCSF RA Cohort Database. Radiographs of hands and feet were scored as “erosive” or “non-erosive” by the patients’ attending rheumatologist. A summary of the patient clinic characteristics is shown in Table 1.
Table 1.
Clinical characteristics of RA patients.
| Patient characteristics | N (%) |
|---|---|
| Number of patients | 51 |
| Female | 46 (90%) |
| Male | 5 (10%) |
| Age (mean +/− SD) | 47 (+/− 12) |
| Hispanic | 31 (61%) |
| Caucasian | 2 (4%) |
| African American | 4 (8%) |
| Asian | 14 (27%) |
| FCRL3 -169 C/C | 11 (21%) |
| FCRL3 -169 C/T | 21 (41%) |
| FCRL3 -169 T/T | 19 (38%) |
| DAS28 (Mean +/− SD) | 4.44 (+/− 1.66) |
| ESR (mm/hr) (mean +/− SD) | 34 (+/− 24) |
| Anti-TNF | 15 (30%) |
| DMARD alone | 18 (35%) |
| No anti-TNF or DMARD | 18 (35%) |
| CCP antibody positive | 46 (90%) |
| RhF positive | 51 (100%) |
| Erosive disease | 35 (67%) |
| Non-erosive disease | 16 (33%) |
| Erosive disease with FCRL3 -169 C/C or C/T | 25 (71% of total erosive patients) |
| Erosive disease with FCRL3 -169 T/T | 10 (29% of total erosive patients) |
| Non-erosive disease with FCRL3 -169 C/C or C/T | 7 (44% of total non-erosive patients) |
| Non-erosive disease with FCRL3 -169 T/T | 9 (56% of total non-erosive patients) |
Abbreviations: DAS28 = 28 joint disease activity score; ESR = erythrocyte sedimentation rate; anti-TNF = anti-tumor necrosis factor, DMARD = disease modifying anti-rheumatic drug; CCP antibody = cyclic citrullinated peptide antibody; RhF = rheumatoid factor; N=number of patients; SD=standard deviation
Tissues and cell isolation
PBMCs from blood were isolated by density centrifugation using Ficoll-Hypaque Plus (Amersham Biosciences, Piscataway, NJ). All washes were performed with 2% FBS in phosphate-buffered saline (PBS).
Antibodies and flow cytometric phenotyping
All phenotyping analyses were performed on fresh samples. PBMCs from RA patients were stained with either the anti-FcRL3 antibody (kindly provided by Genentech10) or with an irrelevant protein control (human serum albumin; Sigma-Aldrich, St. Louis, MO) that had been previously biotinylated by the FluoReporter mini-biotin protein labeling kit (Invitrogen). Secondary detection of FcRL3 or the control was performed with a streptavidin-Qdot655 conjugate (Invitrogen). FcRL3+ cells were defined by the negative control, as there was not a separate population of FcRL3+ cells but rather a continuum of expression. For additional cell surface phenotypic analysis, the following antibodies were used: anti-CD3 Alexa-700, anti-CD25 PeCy7, and anti-CD127 PE (all from BD Biosciences); anti-TCRγδ (eBiosciences); and anti-CD4 Texas Red and anti-CD8 PE-Cy5.5 (Caltag Laboratories). Dead cells were excluded from analysis by cell surface staining with the Aqua Live/Dead amine reactive dead cell stain reagent (Invitrogen).
For phenotyping, cells were incubated with the relevant antibodies diluted in PBS 2% FBS for 30 min on ice, followed by three washes with PBS 2% FBS. Secondary staining for FcRL3 detection with streptavidin-Qdot655 was then performed, followed by an additional three washes in PBS 2% FBS. Cells were then xed in 1% paraformaldehyde (Sigma) for flow cytometric analysis. Intracellular detection of FoxP3 was performed using anti-FoxP3 Pacific Blue (clone PCH101); the accompanying staining kit was provided by eBioscience and was used in accordance with the manufacturer’s protocol. Samples were acquired on an LSRII ow cytometer (BD Biosciences) and all data were analyzed using FlowJo software. Doublet discrimination based on forward scatter height versus area was performed to eliminate cellular aggregates.
SNP analysis
1 x 10⁶ PBMCs from each patient sample were stored as dry pellets at −80°C until analysis. DNA was isolated from the cell pellets using the DNeasy Blood and Tissue kit (Qiagen), according to the manufacturer’s instructions. The -169C and -169T FCRL3 alleles were discriminated from one another with a PCR-based 5’ nuclease genotyping assay that used unlabeled forward and reverse PCR primers (900 nM final concentration) and two allele-specific probes labeled with either VIC or FAM reporter dye (200 mM final concentration) (Applied Biosystems). Assay components were added to 20 ng DNA in a 20 ml reaction containing Taqman Universal PCR Mix. An AB Step One Plus instrument was used for amplification and detection, and AB system software was used for analysis.
Statistical analysis
Comparison of statistical differences in FcRL3 expression between groups was performed using Prism software and Mann-Whitney unpaired single comparison test, as indicated in the text for relevant figures. Differences were considered significant with p values of p<0.05 (*), p<0.01(**), or p<0.001(***) (all by Mann-Whitney). Linear regression analysis for scatter plot data was performed using Prism software and p values and r2 values are shown. A Fisher’s exact test was performed using Prism software to determine the significance of differences in allele frequency in between groups. A biostatistician from the UCSF Clinical and Translational Science Institute performed all regression analysis by using the R programming language (www.r-project.org). For quantitative outcomes (ESR and DAS) we used linear regression analysis to assess association between outcomes and predictors.
Results
FcRL3 expression on T cell subsets in RA patients correlates with the presence of the FCRL3 -169C allele
Previous work from our laboratory showed that higher FcRL3 expression on Treg from healthy donors was linked to the presence of the FCRL3 -169C allele (C/T or C/C genotype), but not with the T/T genotype8. In this study, we first determined whether FcRL3 expression on T cell subsets is affected by the FCRL3 -169C genotype in RA patients as well. This question was addressed using flow cytometric analysis of peripheral blood mononuclear cells (PBMCs) from 51 patients with RA who were enrolled in the UCSF RA Cohort.
The baseline characteristics of the RA patients in this study are shown in Table 1. The study population had a predominance of Hispanic (61%) and Asian (27%) patients. Of note, 21% had the FCRL3 -169C/C genotype, 41% were FCRL3 -169C/T, and 38% were homozygous for FCRL3 -169T. This distribution was similar to the expected genotype percentages for a known C allele frequency of 0.43 in Asian and 0.44 in European populations 17. The mean Disease Activity Score 28 joints (DAS28) was 4.44 (range 1.63 to 7.92). All patients were rheumatoid factor positive and 90% had antibodies to cyclic citrullinated peptides.
Since expression of FcRL3 on Treg was similar irrespective of whether they were defined as CD4+CD25+FoxP3+ cells or CD4+CD25+CD127lo cells (Figure 1A), we defined Treg as CD4+CD25+FoxP3+ for the purposes of the following data analysis. Consistent with our previous work in healthy individuals, we found that FcRL3 expression on Treg from the peripheral blood of RA patients was associated with the FCRL3 -169C allele in a dose-dependent manner (Figure 2A). The percentage of FcRL3+ Treg (% FcRL3+ Treg) and the mean FcRL3 expression on FcRL3+ Treg in RA patients were also associated with the FCRL3 -169C allele (data not shown). We also confirmed that, like FcRL3+ Treg in healthy individuals, FcRL3+ Treg in RA patients express low levels of CD45RA and CCR7 and high levels of PD-1 and CD62L (Supplemental Figure 1A-B). In addition, there was no statistically significant difference in the mean expression of FcRL3 on Treg or %FcRL3+ Treg between healthy controls and RA patients (Supplemental Figure 2A-B). Medications, ethnicity, and age did not result in significant changes in FcRL3 expression on Treg (Supplemental Figures 3A-C).
Figure 1. Representative FcRL3 flow cytometry staining on Treg, CD8+, and TCRγδ+ T cells.

PBMCs were isolated from patients with RA. FcRL3 expression [mean fluorescence intensity (MFI)] on Treg was quantified by flow cytometry. Treg were defined by either CD4+CD25+FoxP3+ or CD4+CD25+CD127lo. The FcRL3 MFI was similar using either method of Treg surface marker definition (A, FcRL3 MFI was 548 and 538, respectively). FcRL3 expression levels (MFI) on CD8+ and TCRγδ+ T cells (gated on CD4-CD8- CD3+ cells) were quantified by flow cytometry (B and C, respectively). The black line indicates FcRL3 staining and the gray line indicates staining with the negative control antibody.
Figure 2. The FCRL3 -169C variant is associated with higher FcRL3 expression on T cell subsets in RA patients.

PBMCs were isolated from RA patients and FcRL3 expression (MFI) on Treg (CD4+CD25+FoxP3+) (A), CD8+ T cells (B), and TCRγδ+ T cells (C) was quantified by flow cytometry and plotted with respect to the -169 FCRL3 genotype (C/C, C/T, or T/T). The relative expression of FcRL3 on Treg, CD8+, and TCRγδ+ T cell subsets is shown in (D). Differences were significant with a p value of p<0.05 (*), p<0.01(**), or p<0.001(***) (all by Mann-Whitney).
Since FcRL3 is expressed on CD8+, TCRγδ+ T cells, and B cells (Figure 1B and 1C, respectively and ref. 7), we also examined FcRL3 expression on these subpopulations in relation to the FCRL3 -169C variant. As previously shown by Gibson, et al.15 we also find that the FCRL3 -169C variant is associated with higher FcRL3 expression on CD19+ B cells (Supplemental Figure 4). As found in the case of FcRL3 expression on Treg, FcRL3 expression on CD8+ T and TCRγδ+ T cells was also associated with presence of the -169C FCRL3 allele (Figure 2B and 2C). Of the three T cell subsets examined, FcRL3 expression on Treg was significantly higher than on CD8+ and TCRγδ+ T cells (p<0.001, Figure 2D). Of note, the patients with the highest FcRL3 expression on Treg also had the highest FcRL3 expression on CD8+ and TCRγδ+T cells (data not shown). Taken together, these data show that the -169C FCRL3 allele is associated with higher expression of FcRL3 on T cell subsets.
FcRL3 expression on T cell subsets in RA patients correlates with RA disease activity and this association is especially evident in patients with the FCRL3 -169C allele
Treg function is deficient in RA patients3,4,6. Because FcRL3+ Treg are less suppressive than FcRL3- Treg, we hypothesized that high levels of FcRL3 expression on Treg (resulting in less functional Treg) would be associated with more pronounced RA disease activity8. We first examined the RA study patients a as single group and found that the levels of FcRL3 expression on Treg were correlated with a known marker of RA disease activity19: the erythrocyte sedimentation rate (ESR) (Supplemental Figure 5A, p=0.03, r2=0.10). FcRL3 expression on Treg also correlated with a validated, composite measure of RA disease activity: the DAS2820, (Supplemental Figure 5B) (p=0.04, r2=0.09).
Since the FCRL3 -169C allele confers enhanced NFκB transcription factor binding and FCRL3 promoter activity9, we hypothesized that the above FcRL3 associations with ESR and DAS28 would be especially evident in those RA patients with the -169C FCRL3 allele. Indeed, examination of the subset of RA patients harboring one or two FCRL3 -169C alleles in comparison to all patients revealed a stronger association between FcRL3 expression on Treg and ESR (Figure 3A) (p=0.003, r2=0.25) and DAS28 (Figure 3B) (p=0.002, r2=0.16). Reciprocally, the association between FcRL3 expression on Treg and RA disease activity was not observed in RA patients who had the FCRL3 -169T/T genotype (Figure 3C and 3D). Furthermore, the percentage of FcRL3+ Treg was associated with RA disease activity and this relationship was more evident in the RA patients harboring one or two FCRL3 -169C alleles (Supplemental Figure 6A-D). Again, the association between the percentage of FcRL3+ Treg and RA disease activity was not observed in patients with the FCRL3 -169T/T genotype (Supplemental Figure 6E-F). To assess whether FcRL3 expression on Treg and/or the FCRL3 - 169 genotype were independent predictors of RA disease activity, we performed multivariate regression analysis with both genotype and expression as predictors. We found that, in this study of 51 patients, FcRL3 expression on Treg was an independent predictor of RA disease activity (as assessed by DAS, p=0.02 or ESR, p=.04) while the FCRL3 -169 genotype was not (p>0.4).
Figure 3. FcRL3 expression on Treg is associated with RA disease activity parameters (ESR and DAS28) in RA patients with the -169C FCRL3 allele.

PBMCs from RA patients were isolated and FcRL3 expression (MFI) on Treg (CD4+CD25+FoxP3+) was quantified by flow cytometry. The scatter plot displays FcRL3 expression in relation to ESR and DAS28 for those RA patients with the FCRL3 -169C allele (C/C or C/T genotypes) (A and B, respectively) or the FCRL3 -169 T/T genotype (C and D, respectively). DAS28, ESR, and FcRL3 MFI measurements were all obtained on the same day and data was extracted from the UCSF RA Cohort Database. Linear regression analysis was performed: the p value and r2 are shown on each graph.
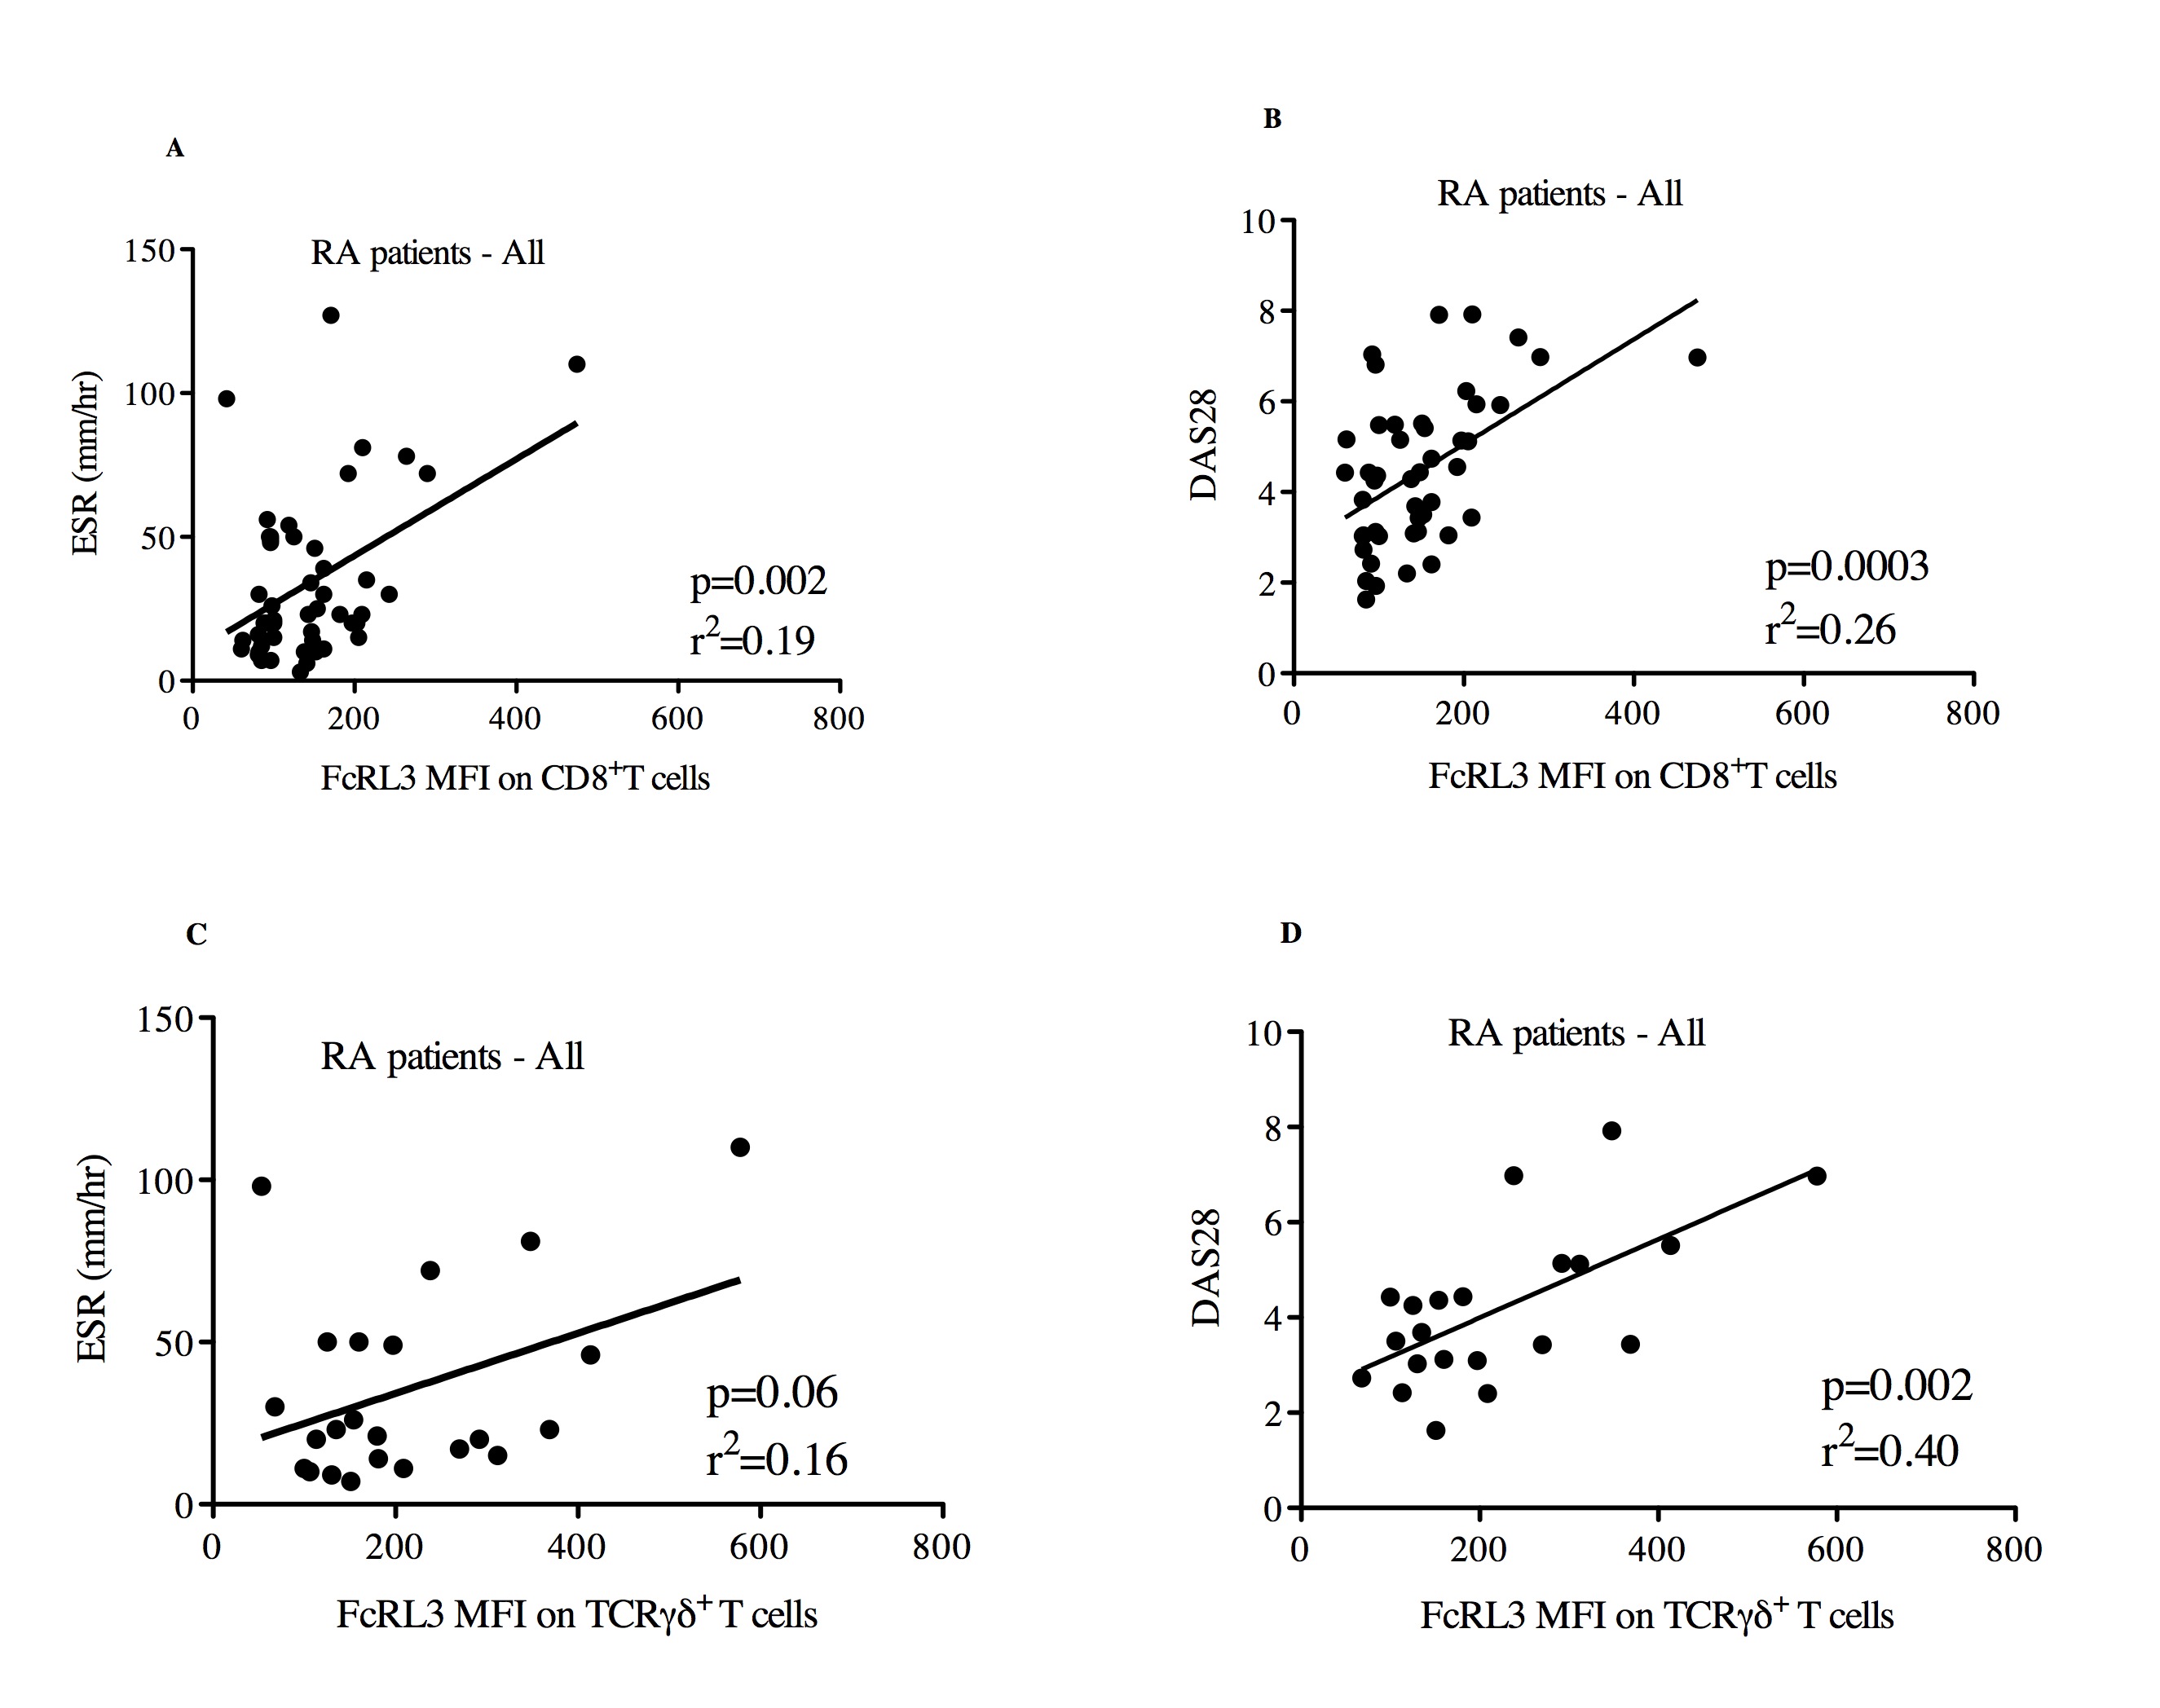
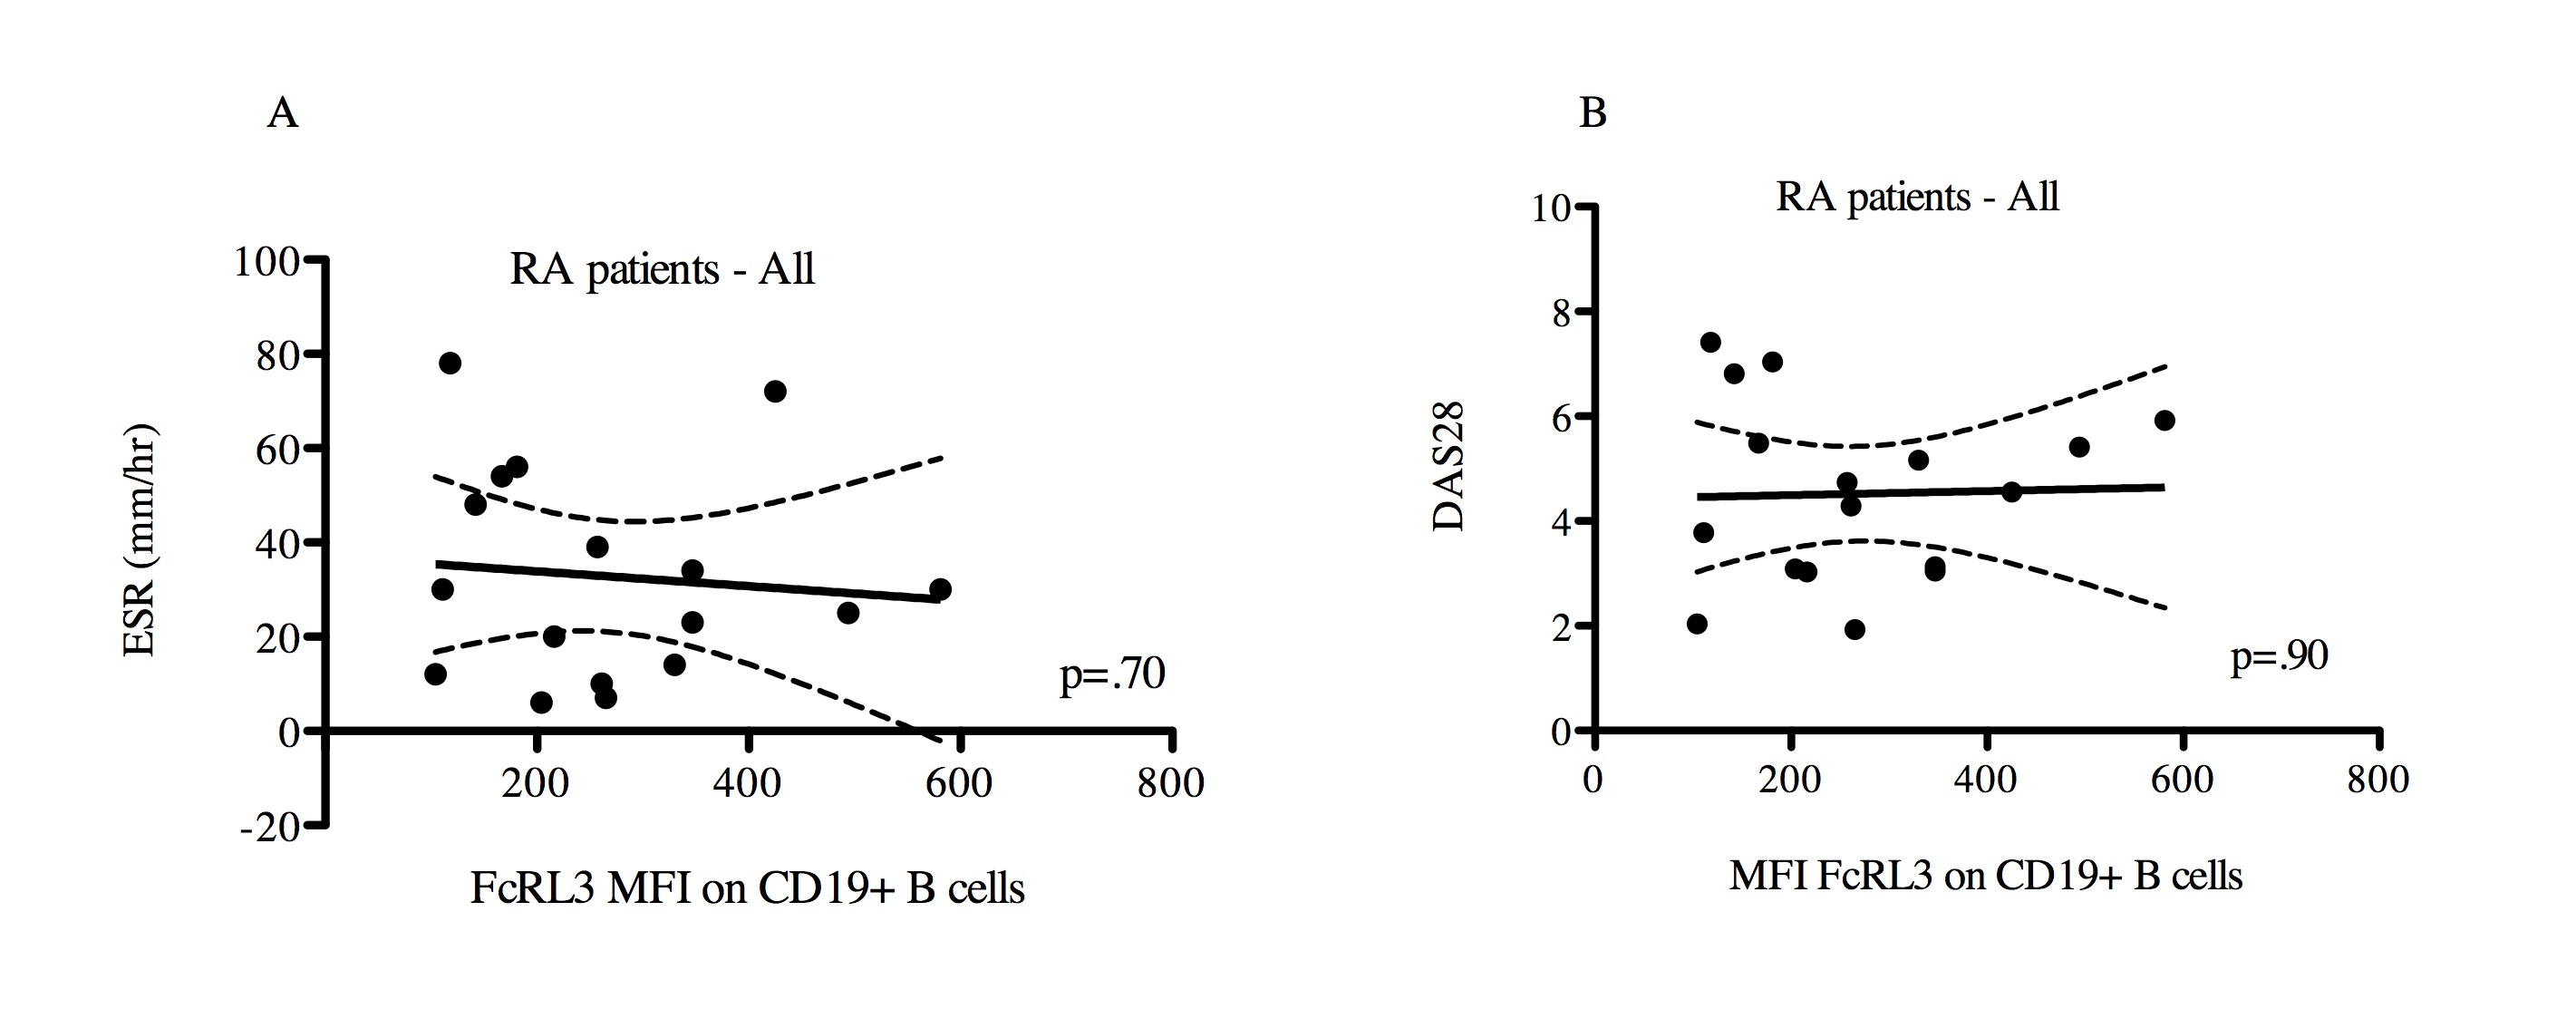
We next asked whether FcRL3 expression on other FcRL3-expressing immune cell subsets correlated with RA disease activity. When examining all RA patients as a single group, an association was observed between FcRL3 expression on CD8+ T cells and RA disease activity, as measured by ESR (Supplemental Figure 7A, p=0.002, r2=0.19) and DAS28 (Supplemental Figure 7B, p=0.0003, r2=0.26). As found in the case of FcRL3 expression on Treg, RA patients harboring a FCRL3 -169C allele showed a stronger association between FcRL3 expression on CD8+ T cells and ESR (Figure 4A) (p=0.002, r2=0.29) and DAS28 (Figure 4B) (p=0.0004, r2=0.34) than in all patients combined. Reciprocally, this association was not observed in RA patients who had the FCRL3 -169T/T genotype (data not shown). Examination of the TCRγδ+ T cell subset from RA patients as a single group showed a similar association between FcRL3 expression and RA disease activity measurements, ESR (Supplemental Figure 6C, p=0.06, r2=0.16) and DAS28 (Supplemental 6D, p=0.002, r2=0.40). As seen with Treg and CD8+ T cells, this association between FcRL3 expression and RA disease activity was more evident in RA patients with one or two FCRL3 -169C alleles (Figures 4C and 4D). Interestingly, we did not find an association between FcRL3 expression on CD19+B cells and RA disease activity (Supplemental Figures 8A-B). Collectively, these data show that higher levels of FcRL3 expression on Treg, CD8+, and TCRγδ+ T cells are associated with greater degrees of RA disease activity, and that this association is more evident in those RA patients that possess an FCRL3 -169C allele.
Figure 4. FcRL3 expression on CD8+ T cells and TCRγδ+ T cells is associated with RA disease activity parameters (ESR and DAS28) in RA patients with the -169C FCRL3 allele.

PBMCs from RA patients were isolated and FcRL3 expression (MFI) on CD8+ T cells was quantified by flow cytometry. For those RA patients with the FCRL3 -169C allele, C/C or C/T genotypes, the scatter plot displays the relationship between ESR and DAS28 with FcRL3 expression on CD8+ T cells (A and B, respectively) and TCRγδ+ T cells (C and D, respectively). DAS28, ESR, and FcRL3 MFI measurements were all obtained on the same day and data was extracted from the UCSF RA Cohort Database. Linear regression analysis was performed: the p value and r2 are shown on each graph.
Erosive RA disease is associated with the FCRL3 -169C allele and higher FcRL3 expression on Treg
Erosive RA disease identifies a subset of RA patients who have more destructive and debilitating RA, and is defined by visible bone erosions on radiographic films. Given the association between RA disease activity and FcRL3 expression on Treg, we hypothesized that the FCRL3 -169C allele would be more predominant in RA patients with erosive disease than in those without erosive disease. The data in Table 1 (bottom rows) show that there was a trend towards a higher frequency of FCRL3 -169C alleles in the subset of RA patients with erosive disease (non-erosive 44% vs. erosive 71%, Fisher’s exact test 0.057). In support of these data, the expression of FcRL3 on Treg was found to be significantly higher in RA patients with erosive disease than in those with non- erosive disease (Figure 5A, p=0.03). A trend towards an association between erosive RA disease and FcRL3 expression on either CD8+ or TCRγδ+ T cells (Figures 5B and 5C) was also found, although it did not reach statistical significance. These data, implicate FcRL3+ Treg as a relevant T cell subset associated with erosive RA disease.
Figure 5. RA patients with erosive disease express significantly higher FcRL3 on Treg.

PBMCs were isolated from RA patients and FcRL3 expression (MFI) on Treg was quantified by flow cytometry. FcRL3 expression on Treg (A), CD8+ (B), and TCRγδ+ T cells (C) was compared between erosive and non-erosive RA subsets. Data on erosive or non-erosive RA disease in these patients was extracted from the UCSF RA Cohort database. A Mann-Whitney test was performed to assess the significance of the differences.
Discussion
The results of this study demonstrate that, among RA patients who harbor one or two FCRL3 -169C alleles, FcRL3 expression on T cell subsets is associated with RA disease activity. Thus, we found that FcRL3 expression was higher on Treg, CD8+ T cells, and TCRγδ+ T cells in the presence of the FCRL3 -169C allele, and that such expression was correlated with RA disease activity as measured by ESR and DAS28. We also found that RA patients with erosive disease expressed higher levels of FcRL3 on Treg and exhibited increased frequency of the FCRL3 -169C allele. These observations suggest that FcRL3 expression, which is strongly associated with the FCRL3 -169C variant, may serve as a biomarker for RA disease activity.
Although several earlier studies identified the FCRL3 -169C variant as a genetic risk factor for RA, genome-wide association studies did not identify FCRL3 as a risk allele.9,21,22. Our results suggest that this variant, through its association with FcRL3 expression, maybe a genetic risk factor for developing recalcitrant RA disease activity and progression to erosive disease. Our findings support the recent report of Chen et al., which showed an association between the FCRL3 -169 genotype and erosive disease in Taiwanese patients with RA23. It is possible that the variability in identifying the FCRL3 -169C variant as a genetic risk factor for developing RA may be dependent on the severity of disease and/or ethnicity of the examined study population. Interestingly, a recent study by Maehlen, et al.24 showed that the FCRL3 -169 C/C genotype was associated with erosive RA in a large Scandanavian cohort, suggesting that our findings in a predominantly Hispanic and Asian RA cohort may apply more broadly to European populations.
It remains to be determined whether FcRL3 cell surface expression contributes to or is a consequence of RA disease activity. These are not mutually exclusive hypotheses, as basal levels of FcRL3 expression may be set by the FCRL3 -169 SNP, while inducible FcRL3 expression maybe driven by the FCRL3 -169 SNP and pro-inflammatory NFκB-inducing cytokines that are produced during active RA disease. An individual with the FCRL3 -169C allele might accordingly demonstrate higher basal levels of FcRL3 and upregulate FcRL3 expression to a greater extent in inflammatory settings. Furthermore, the regulation of FcRL3 expression likely involves additional factors, including other genetic factors, that are yet to be identified. Longitudinal studies of a large cohort will be necessary to elucidate a more definitive role for FcRL3 expression as a predictive biomarker for RA disease activity.
Previous work from our lab showed that FcRL3+ Treg are less suppressive than FcRL3− Treg and led us to postulate that FcRL3 may function as a negative regulator of Treg function8. Although the mechanism by which this occurs is unknown, it is likely that, similar to classical Fc receptors, FcRL3 can modulate immunoreceptor signaling through its ITIM/ITAM. There is in vitro evidence that B cell receptor signaling is downmodulated by the intracellular domain of FcRL3. While our data show that FcRL3 is most highly expressed on Treg, it is also expressed on CD8+ and TCRγδ+ T cells and, as seen with Treg, in a manner that correlates with RA disease activity. Furthermore, we have found that within CD8+ T cells, FcRL3 is expressed on those that are CD8+CD28- (unpublished data), a phenotype that has previously been reported to demonstrate suppressor function25. In addition, subpopulations of TCRγδ+ T cells are thought to have suppressive function26,27. It is interesting to speculate that FcRL3 may specifically function as a regulator of suppressor T cells and, by extension, that the high levels of FcRL3 found on CD8+ and TCRγδ+ T cells are relegated primarily to CD8+ and TCRγδ+ T cells with a suppressive function. Alternatively, given the presence of both ITAM and ITIM on its intracellular domain, FcRL3 may function as a positive or negative regulator in different T cell subsets or in response to different stimuli.
FcRL3 may play a pivotal role in a common pathway leading to autoimmune disease pathogenesis 16,17. Recent studies have demonstrated that NFκB activity is associated with decreased Treg function and RA disease activity4,28. It is possible that NFκB mediates this Treg dysfunction and consequent unbridled immune activation, at least in part, through upregulation of FcRL3 expression. If so, FcRL3 may represent a target for therapeutic intervention in the context of RA: downregulation or interruption of it would predictably lead to the emergence of a Treg pool that could more efficiently suppress the inflammatory state in RA. Further studies will be needed to characterize the role of FcRL3 on all FcRL3-expressing immune cells, including B cells and CD8+ and TCRγδ+ T cells, and to better assess its potential role as a therapeutic target in the setting of RA and other autoimmune diseases.
Supplementary Material
Acknowledgments
Funding for this project was provided by the American College of Rheumatology Research and Education Foundation Rheumatology Scientist Development Award to U.D.B. and the Rosalind Russell Arthritis Center to U.D.B., J.G., and J.I. Support was also provided by a grant (DPI OD00329) to J.M.M. from the National Institutes of Health (NIH) and by the Harvey V. Berneking Living Trust. J.M.M. is a recipient of the NIH Director’s Pioneer Award Program, part of the NIH Roadmap for Medical Research, through grant DPI OD00329.
We would like to thank Dr. Andy Polson and Genentech for providing the anti-FcRL3 antibody, which was crucial for these experiments. We would like to thank biostatistician, Dr. Saunak Sen, whose work on this project was also supported by CTSA grant UL1 RR024131 (its contents are solely the responsibility of the authors and do not necessarily represent the official views of the NIH). We are thankful to Terence Ho at the Division of Experimental Medicine Flow Cytometry Core for technical assistance, Dr. Satish Pillai for statistical assistance, and the McCune Laboratory members for helpful comments. We are especially grateful to the UCSF RA Cohort staff and patients.
Footnotes
The authors report no conflicts of interests related to this work.
References
- 1.Brusko TM, Putnam AL, Bluestone JA. Human regulatory T cells: role in autoimmune disease and therapeutic opportunities. Immunol Rev. 2008;223:371–390. doi: 10.1111/j.1600-065X.2008.00637.x. [DOI] [PubMed] [Google Scholar]
- 2.Oh S, Rankin AL, Caton AJ. CD4+CD25+ regulatory T cells in autoimmune arthritis. Immunol Rev. 2010;233:97–111. doi: 10.1111/j.0105-2896.2009.00848.x. [DOI] [PMC free article] [PubMed] [Google Scholar]
- 3.Valencia X, Stephens G, Goldbach-Mansky R, Wilson M, Shevach EM, Lipsky PE. TNF downmodulates the function of human CD4+CD25hi T-regulatory cells. Blood. 2006;108:253–261. doi: 10.1182/blood-2005-11-4567. [DOI] [PMC free article] [PubMed] [Google Scholar]
- 4.Zanin-Zhorov A, Ding Y, Kumari S, et al. Protein kinase C-theta mediates negative feedback on regulatory T cell function. Science. 2010;328:372–376. doi: 10.1126/science.1186068. [DOI] [PMC free article] [PubMed] [Google Scholar]
- 5.Flores-Borja F, Mauri C, Ehrenstein MR. Restoring the balance: harnessing regulatory T cells for therapy in rheumatoid arthritis. Eur J Immunol. 2008;38:934–937. doi: 10.1002/eji.200738107. [DOI] [PubMed] [Google Scholar]
- 6.Ehrenstein MR, Evans JG, Singh A, et al. Compromised function of regulatory T cells in rheumatoid arthritis and reversal by anti-TNFalpha therapy. J Exp Med. 2004;200:277–285. doi: 10.1084/jem.20040165. [DOI] [PMC free article] [PubMed] [Google Scholar]
- 7.Nagata S, Ise T, Pastan I. Fc receptor-like 3 protein expressed on IL-2 nonresponsive subset of human regulatory T cells. J Immunol. 2009;182:7518–7526. doi: 10.4049/jimmunol.0802230. [DOI] [PMC free article] [PubMed] [Google Scholar]
- 8.Swainson LA, Mold JE, Bajpai UD, McCune JM. Expression of the autoimmune susceptibility gene FcRL3 on human regulatory T cells is associated with dysfunction and high levels of programmed cell death-1. J Immunol. 2010;184:3639–3647. doi: 10.4049/jimmunol.0903943. [DOI] [PMC free article] [PubMed] [Google Scholar]
- 9.Kochi Y, Yamada R, Suzuki A, et al. A functional variant in FCRL3, encoding Fc receptor-like 3, is associated with rheumatoid arthritis and several autoimmunities. Nat Genet. 2005;37:478–485. doi: 10.1038/ng1540. [DOI] [PMC free article] [PubMed] [Google Scholar]
- 10.Polson AG, Zheng B, Elkins K, et al. Expression pattern of the human FcRH/IRTA receptors in normal tissue and in B-chronic lymphocytic leukemia. Int Immunol. 2006;18:1363–1373. doi: 10.1093/intimm/dxl069. [DOI] [PubMed] [Google Scholar]
- 11.Davis RS. Fc receptor-like molecules. Annu Rev Immunol. 2007;25:525–560. doi: 10.1146/annurev.immunol.25.022106.141541. [DOI] [PubMed] [Google Scholar]
- 12.Schreeder DM, Cannon JP, Wu J, Li R, Shakhmatov MA, Davis RS. Cutting edge: FcR-like 6 is an MHC class II receptor. J Immunol. 2010;185:23–27. doi: 10.4049/jimmunol.1000832. [DOI] [PMC free article] [PubMed] [Google Scholar]
- 13.Campbell JA, Davis RS, Lilly LM, Fremont DH, French AR, Carayannopoulos LN. Cutting edge: FcR-like 5 on innate B cells is targeted by a poxvirus MHC class I-like immunoevasin. J Immunol. 2010;185:28–32. doi: 10.4049/jimmunol.1000240. [DOI] [PMC free article] [PubMed] [Google Scholar]
- 14.Kochi Y, Myouzen K, Yamada R, et al. FCRL3, an autoimmune susceptibility gene, has inhibitory potential on B-cell receptor-mediated signaling. J Immunol. 2009;183:5502–5510. doi: 10.4049/jimmunol.0901982. [DOI] [PubMed] [Google Scholar]
- 15.Gibson AW, Li FJ, Wu J, et al. The FCRL3 -169CT promoter single-nucleotide polymorphism, which is associated with systemic lupus erythematosus in a Japanese population, predicts expression of receptor protein on CD19+B cells. Arthritis Rheum. 2009;60:3510–3512. doi: 10.1002/art.24915. [DOI] [PMC free article] [PubMed] [Google Scholar]
- 16.Chistiakov DA, Chistiakov AP. Is FCRL3 a new general autoimmunity gene? Hum Immunol. 2007;68:375–383. doi: 10.1016/j.humimm.2007.01.013. [DOI] [PubMed] [Google Scholar]
- 17.Kochi Y, Suzuki A, Yamada R, Yamamoto K. Genetics of rheumatoid arthritis: underlying evidence of ethnic differences. J Autoimmun. 2009;32:158–162. doi: 10.1016/j.jaut.2009.02.020. [DOI] [PubMed] [Google Scholar]
- 18.Arnett FC, Edworthy SM, Bloch DA, et al. The American Rheumatism Association 1987 revised criteria for the classification of rheumatoid arthritis. Arthritis Rheum. 1988;31:315–324. doi: 10.1002/art.1780310302. [DOI] [PubMed] [Google Scholar]
- 19.Ward MM. Relative sensitivity to change of the erythrocyte sedimentation rate and serum C-reactive protein concentration in rheumatoid arthritis. J Rheumatol. 2004;31:884–895. [PubMed] [Google Scholar]
- 20.Prevoo ML, van 't Hof MA, Kuper HH, van Leeuwen MA, van de Putte LB, van Riel PL. Modified disease activity scores that include twenty-eight-joint counts. Development and validation in a prospective longitudinal study of patients with rheumatoid arthritis. Arthritis Rheum. 1995;38:44–48. doi: 10.1002/art.1780380107. [DOI] [PubMed] [Google Scholar]
- 21.Kochi Y, Suzuki A, Yamada R, Yamamoto K. Ethnogenetic heterogeneity of rheumatoid arthritis-implications for pathogenesis. Nat Rev Rheumatol. 2010;6:290–295. doi: 10.1038/nrrheum.2010.23. [DOI] [PubMed] [Google Scholar]
- 22.Stahl EA, Raychaudhuri S, Remmers EF, et al. Genome-wide association study meta-analysis identifies seven new rheumatoid arthritis risk loci. Nat Genet. 2010;42:508–514. doi: 10.1038/ng.582. [DOI] [PMC free article] [PubMed] [Google Scholar]
- 23.Chen JY, Wang CM, Wu YJ, et al. Disease Phenotypes and Gender Association of FCRL3 Single-Nucleotide Polymorphism -169T/C in Taiwanese Patients with Systemic Lupus Erythematosus and Rheumatoid Arthritis. J Rheumatol. 2010 doi: 10.3899/jrheum.100437. [DOI] [PubMed] [Google Scholar]
- 24.Maehlen MT, Nordang GB, Syversen SW, van der Heijde DM, Kvien TK, Uhlig T, Lie BA. FCRL3 -169C/C Genotype Is Associated with Anti-citrullinated Protein Antibody-positive Rheumatoid Arthritis and with Radiographic Progression. J Rheum. 2011 Sep 1; doi: 10.3899/jrheum.110489. [DOI] [PubMed] [Google Scholar]
- 25.Suzuki M, Konya C, Goronzy JJ, Weyand CM. Inhibitory CD8+ T cells in autoimmune disease. Hum Immunol. 2008;69:781–789. doi: 10.1016/j.humimm.2008.08.283. [DOI] [PMC free article] [PubMed] [Google Scholar]
- 26.Born WK, Huang Y, Jin N, et al. Balanced approach of γδ T cells to type 2 immunity. Immunol and Cell Biol. 2010;88:269. doi: 10.1038/icb.2009.105. [DOI] [PubMed] [Google Scholar]
- 27.Thedrez A, Sabourin C, Gertner J, et al. Self/non-self discrimination by human γδ T cells: simple solutions for a complex issue? Immunol Rev. 2007;215:123–135. doi: 10.1111/j.1600-065X.2006.00468.x. [DOI] [PubMed] [Google Scholar]
- 28.Nagar M, Jacob-Hirsch J, Vernitsky H, et al. TNF activates a NF-kappaB-regulated cellular program in human CD45RA- regulatory T cells that modulates their suppressive function. J Immunol. 2010;184:3570–3581. doi: 10.4049/jimmunol.0902070. [DOI] [PubMed] [Google Scholar]
Associated Data
This section collects any data citations, data availability statements, or supplementary materials included in this article.