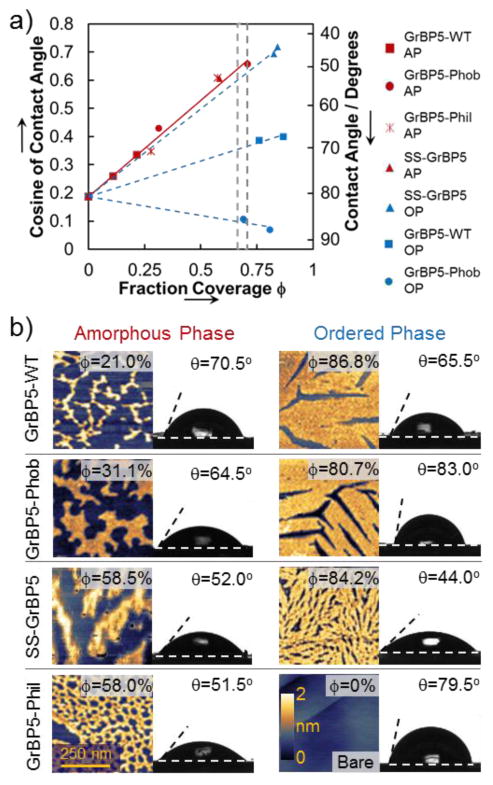
Figure 2.
(a) Plot of contact angle θ versus fraction coverage φ of peptides on graphite. The blue lines indicate linear trends above 70% coverage; the red line represents the linear trend for all peptides below 70% coverage. The change in slope between ordered (OP) and amorphous (AP) trend lines indicates the change in the displayed chemistry. The grey lines indicate the AP to OP transition region (b) AFM images showing typical examples of AP and OP structures, as well as the corresponding coverage and contact angles.

