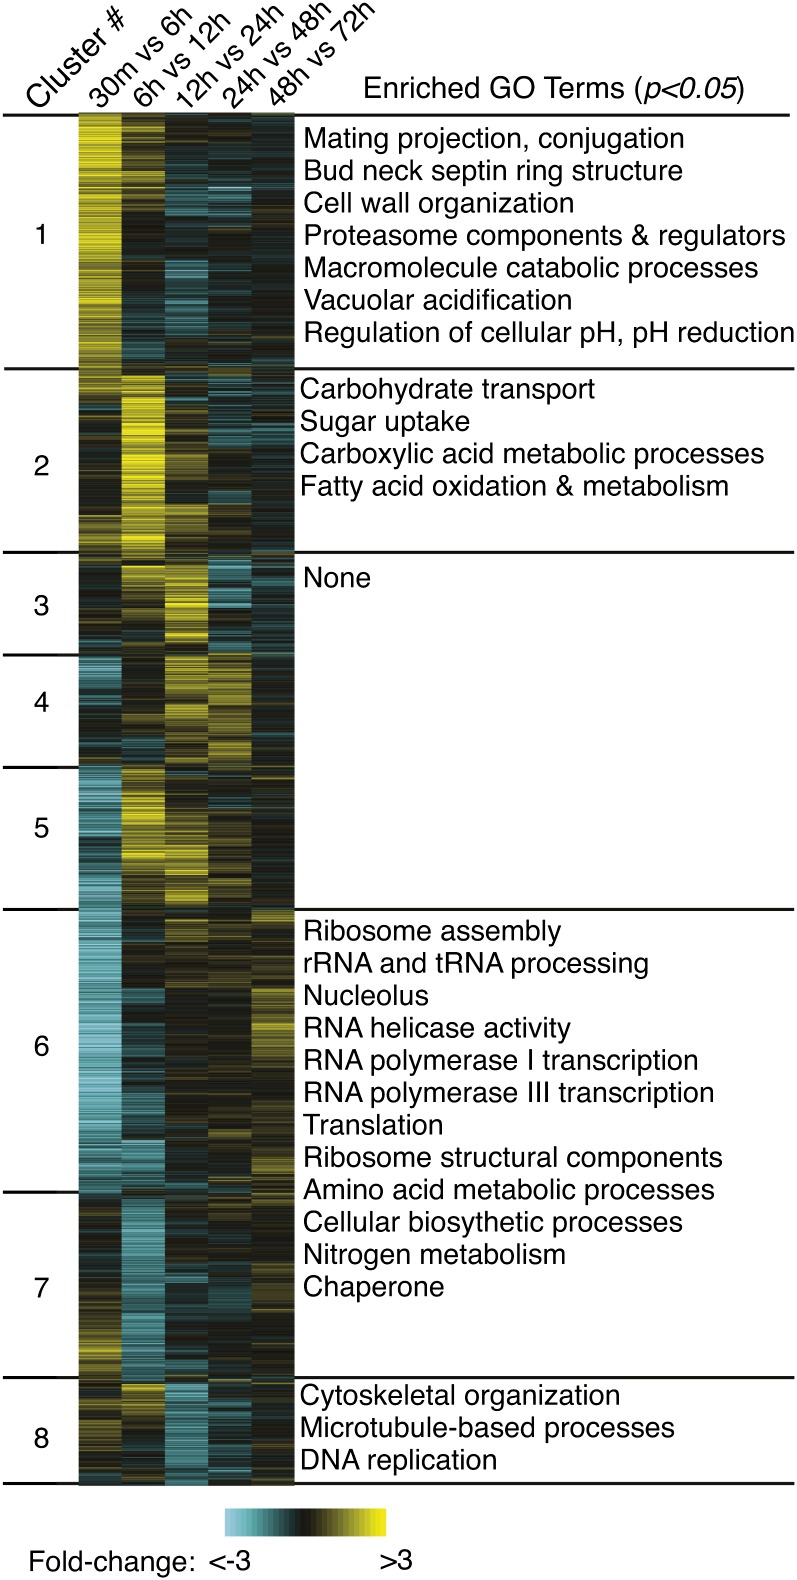
Figure 2 .
Developmental microarray data set defines eight stage-specific gene clusters. The top 3157 genes (as filtered by statistical significance and fold change) are represented as rows, and experiments as columns (labeled above). Yellow indicates an increase over the time period being assessed, blue indicates a decrease, and black indicates that the transcript level was unchanged between time points. The genes are arranged vertically into groups with similar expression profiles, as defined by a robust K-means clustering algorithm (1000 iterations, Pearson correlation similarity metric) with cluster designations on the left (1–8) and representative significantly enriched GO terms (P < 0.05) on the right (Ausubel et al. 1997).

