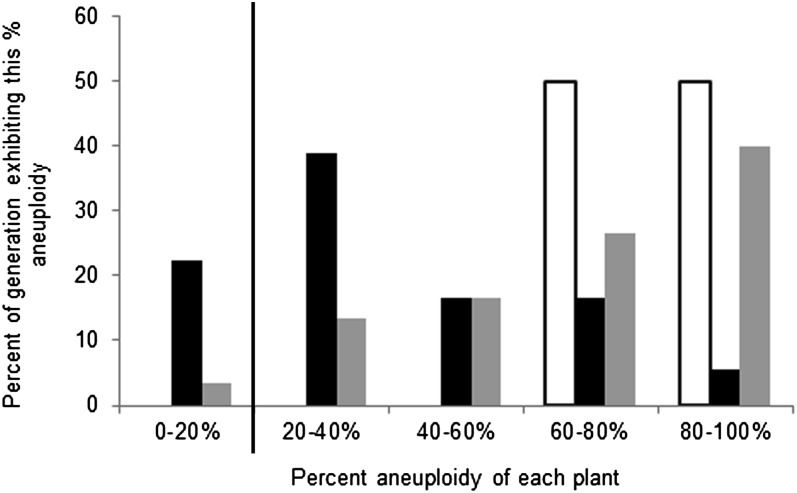
Figure 7 .
Frequency of plants with high levels of aneuploidy compared by generation. Multiple cells from each individual plant were assessed for their level of aneuploidy and grouped into five bins on the basis of the frequency of aneuploid cells in their tissue. Frequencies of plants belonging to each bin are graphed separately by generation. Open bars, F3; solid bars, F6; shaded bars, F7. Previous results in natural A. suecica populations (Wright et al. 2009) display aneuploidy in 0–20% of cells. Therefore, as a conservative estimate of aneuploidy contributed by the paternal parent, bins with >20% of aneuploid cells are separated from the background noise aneuploidy by the vertical line.

