Abstract
Most cancer cells are characterized by aneuploidy, an abnormal number of chromosomes. We have identified a clue to the mechanistic origins of aneuploidy through integrative genomic analyses of human tumors. A diverse range of tumor types were found to harbor deletions or inactivating mutations of STAG2, a gene encoding a subunit of the cohesin complex, which regulates the separation of sister chromatids during cell division. Because STAG2 is on the X chromosome, its inactivation requires only a single mutational event. Studying a near-diploid human cell line with a stable karyotype, we found that targeted inactivation of STAG2 led to chromatid cohesion defects and aneuploidy, whereas in two aneuploid human glioblastoma cell lines, targeted correction of the endogenous mutant alleles of STAG2 led to enhanced chromosomal stability. Thus, genetic disruption of cohesin is a cause of aneuploidy in human cancer.
One of the hallmarks of cancer is chromosomal instability, which leads to aneuploidy, translocations, loss of heterozygosity, and other chromosomal aberrations (1, 2). Chromosomal instability is an early event in cancer pathogenesis and is thought to generate the large number of genetic lesions required for a cell to undergo malignant transformation (3). It has been hypothesized that this instability is due to inactivating mutations in genes that control the mitotic checkpoint and chromosome segregation (4, 5). However, in the vast majority of human tumors the molecular basis of chromosomal instability and the aneuploidy it produces remains unknown.
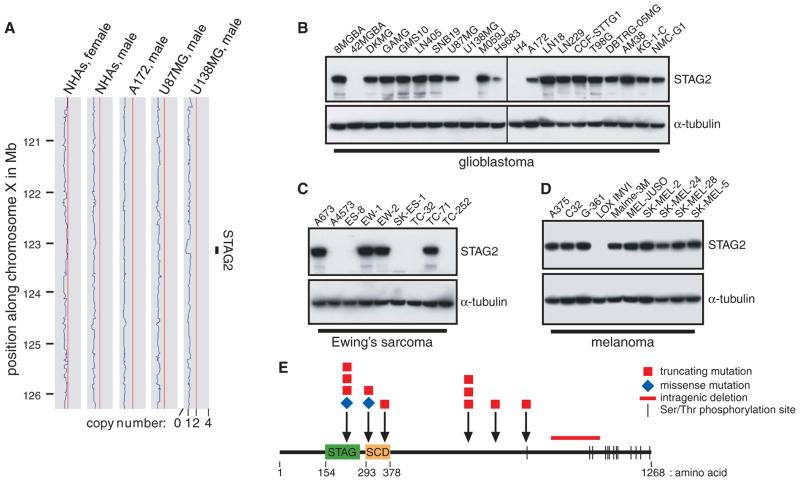
To explore this question, we followed up on previous studies in which we used Affymetrix 250K single-nucleotide polymorphism (SNP) arrays to identify novel regions of amplification and deletion in human glioblastoma cell lines (6–8). In U138MG cells, we identified a region of genomic deletion on the X chromosome containing the “stromal antigen” STAG2 gene (Fig. 1A and fig. S1). STAG2 encodes a 141-kD subunit of cohesin, a multimeric protein complex that is required for cohesion of sister chromatids after DNA replication and that is cleaved at the metaphase-to-anaphase transition to enable chromosome segregation (5, 9, 10). Occasional deletions of chromosome Xq25 encompassing the STAG2 locus have been observed in other cancer genome studies (11–13).
Fig. 1.
STAG2, a gene encoding a subunit of cohesin—a protein complex that regulates sister chromatid separation during cell division—is frequently altered in diverse human cancers. (A) Copy-number plots along the X chromosome for normal human astrocytes (NHAs) and A172, U87MG, and U138MG glioblastoma cells. A genomic deletion between 122.930 and 123.226 Mb encompassing the STAG2 gene is present in U138MG cells. (B to D) Western blots demonstrate complete loss of STAG2 expression in 3 out of 21 glioblastoma, 5 out of 9 Ewing’s sarcoma, and 1 out of 10 melanoma cell lines. (E) Diagram of the STAG2 protein with mutations identified.
As expected, U138MG cells had no detectable STAG2 protein (Fig. 1B). However, it was surprising that 42MGBA and H4 cells similarly lacked STAG2 protein expression, despite no evidence of copy number loss by SNP microarray. To investigate whether point mutations might be responsible for the absence of STAG2 expression in 42MGBA and H4 cells, we sequenced the 33 coding exons of STAG2 and identified a 25–base pair (bp) insertion leading to frameshift in H4 cells and a nonsense mutation in 42MGBA cells (table S1 and fig. S2). We next sequenced the gene in 68 glioblastoma primary tumors and xenografts. These studies identified four additional mutations: a missense mutation in the stromalin conservative domain (SCD), a mutation of the canonical exon 9 splice acceptor, a 2-bp deletion causing a frame-shift, and a point mutation in the exon 11 splice acceptor region (fig. S3).
Next, we performed Western blots on a panel of 135 additional human cancer cell lines from a variety of tumor types. This analysis identified 10 additional cell lines that had complete absence of STAG2 expression (Fig. 1, C and D, and figs. S4 and S5). Sequencing of the STAG2 gene revealed deletions or truncating mutations in 8 out of 10 of these samples (Fig. 1E and figs. S6 to S8). We then sequenced the STAG2 gene in 48 melanoma and 24 Ewing’s sarcoma tumors and found a 6-bp insertion in the stromal antigen (STAG) domain and a point mutation 8 bp upstream of the initiating methionine (fig. S9). The mutations were somatic (i.e., tumor-specific) in all cases with available matched nonneoplastic tissue (table S1). Tumor-derived mutations in the STAG2 gene caused aberrant localization of the protein product and altered chromatin association, consistent with functional inactivation (figs. S10 and S11). No mutations were identified in the STAG2 paralog STAG1, nor was any compensatory up-regulation of STAG1 detected in STAG2-deficient cells (fig. S12).
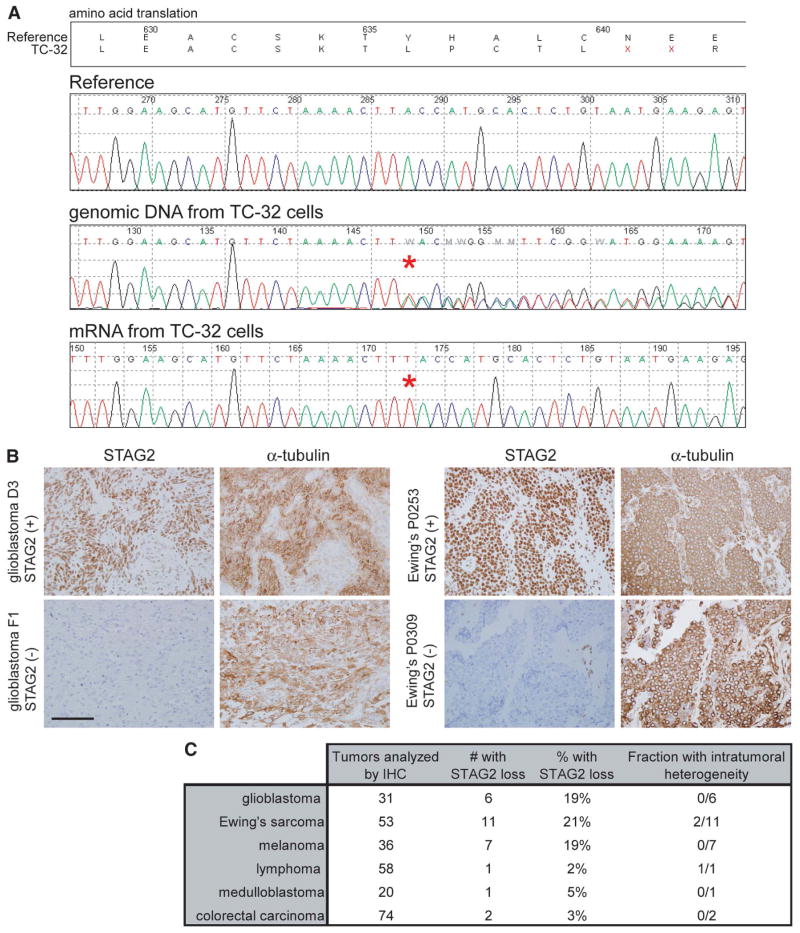
Four tumor samples harbored heterozygous mutations (table S1), despite complete absence of STAG2 expression. Each of these samples was derived from a female patient, which suggested that the remaining wild-type allele of STAG2 was on the inactivated X chromosome. Sequencing of the STAG2 mRNA from these four samples demonstrated that mRNA expression was derived exclusively from the mutant allele (Fig. 2A and fig. S8C). Treatment with the DNA methylase inhibitor 5-aza-2-deoxycytidine led to no reexpression of STAG2 from the wild-type allele in TC-32 cells and only minimal reexpression in A4573 cells (fig. S13), which demonstrated that X chromosome inactivation (and not promoter methylation) was responsible for the “single-hit” inactivation of STAG2 occurring in these tumors.
Fig. 2.
Single-hit genetic inactivation causes loss of STAG2 in diverse human tumor types. (A) STAG2 sequence traces from TC-32 Ewing’s sarcoma cells derived from a female patient. Whereas the genomic DNA is heterozygous for a single nucleotide insertion (T), the mRNA is derived exclusively from the mutant allele on the active X chromosome. (B) Immunohistochemistry identifies frequent loss of STAG2 expression in glioblastoma and Ewing’s sarcoma primary tumors. Scale bar, 100 μm. (C) Number of tumors successfully assessed by immunohistochemistry and the fraction demonstrating complete loss of STAG2 expression.
We next measured STAG2 expression in diverse human primary tumor samples by immunohistochemistry. Details regarding experimental methods and validation of antibody specificity are in the Materials and Methods (8) and fig. S14 and S15. Robust STAG2 expression was observed in all nonneoplastic tissues studied (fig. S16). In contrast, a significant fraction of glioblastomas, melanomas, and Ewing’s sarcomas had completely lost expression of STAG2, with occasional tumors demonstrating intratumoral heterogeneity (Fig. 2, B and C, and figs. S17 to S23). In tumors with STAG2 loss, adjacent nonneoplastic stroma, perivascular endothelial cells, and infiltrating lymphocytes were uniformly STAG2 positive (table S2), which further demonstrated the somatic nature of STAG2 inactivation in a substantial fraction of primary human cancers.
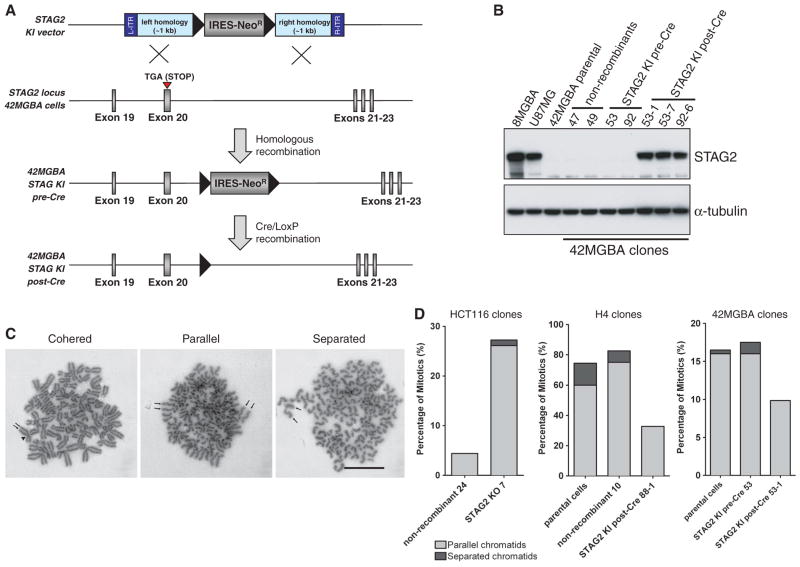
To determine whether endogenous mutations in STAG2 cause chromosomal instability and aneuploidy, we used human somatic cell gene targeting to correct the endogenous mutant allele of STAG2 in two aneuploid glioblastoma cell lines. H4 cells are reported to be hypertriploid with modal chromosome number 73 (range 63 to 78), and 42MGBA cells are hypertetraploid with modal chromosome number 89 (range 88 to 95). Adeno-associated virus (AAV) targeting vectors (14) were constructed and used to correct the 25-bp insertion mutation in exon 12 of H4 cells and the nonsense mutation in exon 20 of 42MGBA cells (Fig. 3A and figs. S24 and S25A). Western blots were then performed to document that correction of the mutations in H4 and 42MGBA cells led to reexpression of STAG2 protein (Fig. 3B and fig. S26A). Similarly, somatic-cell gene targeting was used to introduce a nonsense mutation into the endogenous wild-type allele of STAG2 in HCT116, a near-diploid human colorectal cancer cell line with stable karyotype (figs. S25B and S26B).
Fig. 3.
Targeted correction of the endogenous mutant allele of STAG2 in human glioblastoma cells restores sister chromatid cohesion. (A) An AAV-targeting vector was used to correct the endogenous nonsense mutation in exon 20 in 42MGBA cells, which left behind a FLOXed splice acceptor–internal ribosome entry site (IRES)–NeoR gene in the subsequent intron. These “pre-Cre” clones were then infected with adenoviral Cre, which led to excision of the FLOXed splice acceptor–IRES–NeoR gene in “post-Cre” clones. Black triangles indicate LoxP sites. (B) 42MGBA parental cells and two nonrecombinant clones fail to express STAG2 protein by Western blot. Two pre-Cre KI clones similarly fail to express STAG2 protein because the STAG2 transcript gets spliced to the IRES-NeoR gene. Three post-Cre KI clones express physiologic levels of corrected STAG2 protein, comparable to the levels in 8MGBA and U87MG glioblastoma cells with unmodified wild-type STAG2 alleles. (C) Examples of mitotic chromosome spreads from STAG2-deficient H4 cells with cohered, parallel, and fully separated sister chromatids. Arrows indicate each sister chromatid in a mitotic chromosome. Arrowhead points to the centromere. Scale bar, 2 μm. (D) Isogenic sets of STAG2-proficient and deficient cells were arrested in mitosis using taxol or nocodazole, Giemsa stained, and assayed for sister chromatid cohesion.
The cohesin complex plays several different roles in eukaryotic cell biology, including sister chromatid cohesion and regulation of chromatin architecture and transcription (15–17). We initially tested whether mutational inactivation of the cohesin subunit STAG2 contributes to improper sister chromatid cohesion using the STAG2 knockin (KI, H4 and 42MGBA) and knockout (KO, HCT116) cells. Cells were treated with either taxol or nocodazole to induce mitotic arrest, chromatids were visualized by Giemsa staining, and the percentages of parallel or separated chromatids were scored in a blinded fashion (Fig. 3, C and D). STAG2-proficient HCT116 cells demonstrated virtually perfect sister chromatid cohesion that was markedly abrogated upon knockout of STAG2. In contrast, STAG2-deficient H4 and 42MGBA cells demonstrated substantial defects in sister chromatid cohesion that were largely reverted upon targeted correction of STAG2. Depletion of STAG2 expression by lentiviral short hairpin RNA (shRNA) in HCT116 and additional near-diploid human cells with stable karyotypes led to similar defects in sister chromatid cohesion (fig. S27).
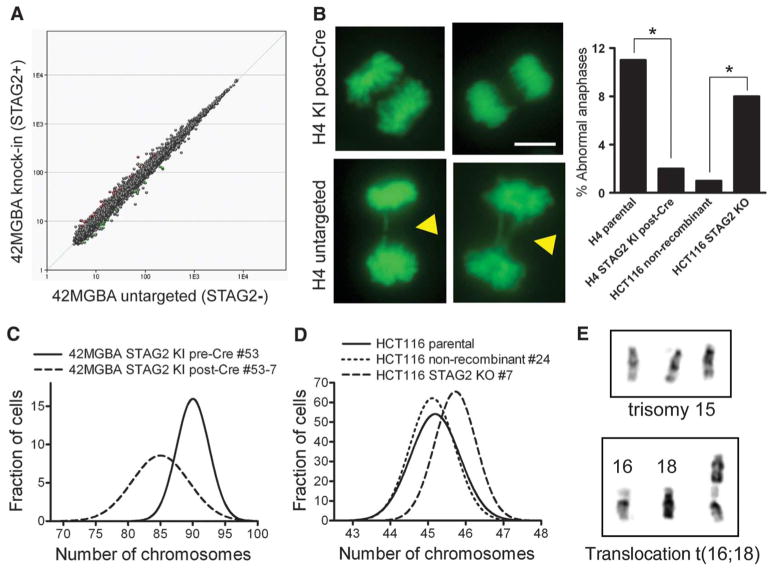
To explore whether STAG2 regulates transcription in human cancer cells, we used expression microarrays to measure global gene expression profiles in the three different sets of isogenic STAG2-corrected and STAG2 KO cells. As depicted in Fig. 4A, fig. S28, and tables S3 to S5, expression profiles of STAG2-proficient and deficient cells were remarkably similar [i.e., only 16 of 28,869 genes (0.06%) were modulated >1.5-fold in STAG2-corrected 42MGBA cells], which indicated that STAG2 is not likely to be a major regulator of global gene expression in human cancer. Furthermore, no genes were recurrently up- or down-regulated by STAG2 in more than one cell line. For example, Angiopoietin-2 expression was increased eightfold in multiple clones of STAG2 KO HCT116 cells but was not correspondingly down-regulated in STAG2 KI H4 or 42MGBA cells. These expression data suggest that the role of STAG2 in cancer pathogenesis is not due to a capacity to induce global transcriptional changes or to modulate the expression of specific tumor-promoting or suppressing genes.
Fig. 4.
Correction of mutant STAG2 alleles in human glioblastoma cells does not globally alter gene expression profile but reduces chromosomal instability. (A) Affymetrix GeneChip human gene 1.0 ST arrays were used to generate gene expression profiles in 42MGBA parental cells, two pre-Cre KI clones, and three post-Cre KI clones. The composite expression profile of the STAG2-mutant cells is plotted against the composite expression profile of the STAG2-corrected cells. (B) Imaging of chromosome dynamics using green fluorescent protein–histone H2B in untreated asynchronous cells (left) and quantification of abnormal mitotic figures in 100 anaphase cells (right) demonstrated lagging chromosomes and anaphase bridges (arrowheads) in STAG2-deficient cells. Scale bar, 5 μm. *P < 0.05. (C and D) Isogenic STAG2-proficient and deficient cells were arrested in prometaphase, and karyotypes were prepared using Wright’s stain. Chromosomes were counted in 100 cells for each cell line to determine the diversity of chromosome counts within the cell population. Chromosome counts are shown in fig. S30, and distribution curves from these data are shown here for STAG2-proficient and deficient 42MGBA cells (C) and HCT116 cells (D). (E) Examples of unique chromosomal aberrations present in individual HCT116 STAG2 KO cells.
Cell cycle analysis demonstrated that STAG2-proficient and deficient cells had similar percentages of cells in both G1 (2N) and G2/M (4N) (fig. S29). However, the 2N and 4N peaks were substantially wider in each of the STAG2-deficient cell lines than in their isogenic STAG2-proficient counterparts, which suggested that STAG2 inactivation resulted in altered chromosome counts (i.e., aneuploidy) in these cancer cells. Imaging of untreated asynchronous cells revealed the presence of abnormal mitotic figures, including lagging chromosomes and anaphase bridges in STAG2-deficient cells, characteristic of aneuploid divisions (Fig. 4B).
We next performed karyotypic analysis of these isogenic sets of cells. H4 cells had a wider distribution of chromosome counts than their STAG2-corrected derivatives (fig. S30A). Correction of mutant STAG2 in 42MGBA cells led to a reduction in chromosome number per cell (Fig. 4C and fig. S30, B and C). Similarly, HCT116 STAG2-proficient cells had a modal chromosome count of 45, whereas their STAG2-deleted derivatives had a modal chromosome count of 46 and occasional cells with higher chromosome counts (Fig. 4D and fig. S30D). Importantly, each STAG2-deficient HCT116 cell with 46 chromosomes had a unique karyotype (Fig. E and fig. S31). shRNA depletion of STAG2 in near-diploid cells with stable karyotype similarly led to altered chromosome counts (fig. S30E). Together, these results demonstrate that STAG2 loss causes chromosomal instability and aneuploidy in human cancer cells.
It has long been thought that mutational inactivation of genes that control chromosomal segregation is responsible for aneuploidy in human cancer. Targeted overexpression or genetic inactivation of factors involved in chromatin condensation, mitotic checkpoint, and chromosome segregation has demonstrated that these genes can function to maintain chromosomal stability [examples in (18, 19, 20, 21)]. However, analysis of human cancer samples has yielded only a few examples of putative chromosome instability genes that are mutated or deleted at an appreciable frequency (22–24). We have shown here that diverse human cancers harbor mutations in the X-linked chromatid cohesion gene STAG2 and that these mutations cause aneuploidy. We postulate that STAG2 is likely to function as a “caretaker” tumor suppressor gene that when inactivated results in chromosomal instability, similar to other caretaker genes like MLH1 and MSH2 that, when inactivated, result in nucleotide instability (25).
Supplementary Material
Acknowledgments
We thank K. Creswell, S. Sen, and Applied Genetics Laboratories for technical assistance; and M. White and the Brain Tumor Tissue Bank of Canada, S. Baker, F. Bunz, J.-M. Peters, and the Children’s Oncology Group for reagents and tumor samples. This research was supported by NIH grants R01CA115699 (T.W.), R21CA143282 (T.W.), SPORE grant CA097257 (C.D.J.), and American Cancer Society grant RSG0619101 (T.W.). Georgetown University has filed a patent application relating to the application of the mutations described in this work to the diagnosis and treatment of cancer. Y.S. is supported by the Intramural Research Programs of the National Human Genome Research Institute, NIH. Primer sequences are in table S6. For copy number arrays: the scanned array images and processed data sets have been deposited in the Gene Expression Omnibus (www.ncbi.nlm.nih.gov/geo, dataset GSE13021). For expression microarrays: the scanned array images and processed data sets have been deposited in the Gene Expression Omnibus (www.ncbi.nlm.nih.gov/geo, dataset GSE28214)
Footnotes
References and Notes
- 1.Hanahan D, Weinberg RA. Cell. 2011;144:646. doi: 10.1016/j.cell.2011.02.013. [DOI] [PubMed] [Google Scholar]
- 2.Lengauer C, Kinzler KW, Vogelstein B. Nature. 1998;396:643. doi: 10.1038/25292. [DOI] [PubMed] [Google Scholar]
- 3.Loeb LA. Cancer Res. 1991;51:3075. [PubMed] [Google Scholar]
- 4.Cahill DP, et al. Nature. 1998;392:300. doi: 10.1038/32688. [DOI] [PubMed] [Google Scholar]
- 5.Nasmyth K. Science. 2002;297:559. doi: 10.1126/science.1074757. [DOI] [PubMed] [Google Scholar]
- 6.Solomon DA, et al. Cancer Res. 2008;68:2564. doi: 10.1158/0008-5472.CAN-07-6388. [DOI] [PMC free article] [PubMed] [Google Scholar]
- 7.Solomon DA, et al. Cancer Res. 2008;68:10300. doi: 10.1158/0008-5472.CAN-08-3272. [DOI] [PMC free article] [PubMed] [Google Scholar]
- 8.Materials and methods are available as supporting material on Science Online.
- 9.Sumara I, Vorlaufer E, Gieffers C, Peters BH, Peters JM. J Cell Biol. 2000;151:749. doi: 10.1083/jcb.151.4.749. [DOI] [PMC free article] [PubMed] [Google Scholar]
- 10.Haering CH, Farcas AM, Arumugam P, Metson J, Nasmyth K. Nature. 2008;454:297. doi: 10.1038/nature07098. [DOI] [PubMed] [Google Scholar]
- 11.Walter MJ, et al. Proc Natl Acad Sci USA. 2009;106:12950. [Google Scholar]
- 12.Gorringe KL, et al. Genes Chromosomes Cancer. 2009;48:931. doi: 10.1002/gcc.20694. [DOI] [PubMed] [Google Scholar]
- 13.Rocquain J, et al. Am J Hematol. 2010;85:717. doi: 10.1002/ajh.21798. [DOI] [PubMed] [Google Scholar]
- 14.Kim JS, Bonifant C, Bunz F, Lane WS, Waldman T. Nucleic Acids Res. 2008;36:e127. doi: 10.1093/nar/gkn566. [DOI] [PMC free article] [PubMed] [Google Scholar]
- 15.Lara-Pezzi E, et al. J Biol Chem. 2004;279:6553. doi: 10.1074/jbc.M307663200. [DOI] [PubMed] [Google Scholar]
- 16.Wendt KS, et al. Nature. 2008;451:796. doi: 10.1038/nature06634. [DOI] [PubMed] [Google Scholar]
- 17.Kagey MH, et al. Nature. 2010;467:430. doi: 10.1038/nature09380. [DOI] [PMC free article] [PubMed] [Google Scholar]
- 18.Zhang N, et al. Proc Natl Acad Sci USA. 2008;105:13033. [Google Scholar]
- 19.Baker DJ, Jin F, Jeganathan KB, van Deursen JM. Cancer Cell. 2009;16:475. doi: 10.1016/j.ccr.2009.10.023. [DOI] [PMC free article] [PubMed] [Google Scholar]
- 20.Jallepalli PV, et al. Cell. 2001;105:445. doi: 10.1016/s0092-8674(01)00340-3. [DOI] [PubMed] [Google Scholar]
- 21.Sotillo R, et al. Cancer Cell. 2007;11:9. doi: 10.1016/j.ccr.2006.10.019. [DOI] [PMC free article] [PubMed] [Google Scholar]
- 22.Rajagopalan H, et al. Nature. 2004;428:77. doi: 10.1038/nature02313. [DOI] [PubMed] [Google Scholar]
- 23.Wang Z, et al. Cancer Res. 2004;64:2998. doi: 10.1158/0008-5472.can-04-0587. [DOI] [PubMed] [Google Scholar]
- 24.Barber TD, et al. Proc Natl Acad Sci USA. 2008;105:3443. [Google Scholar]
- 25.Kinzler KW, Vogelstein B. Nature. 1997;386:761–763. doi: 10.1038/386761a0. [DOI] [PubMed] [Google Scholar]
Associated Data
This section collects any data citations, data availability statements, or supplementary materials included in this article.


