Abstract
Recent experimental observations suggest that cells can show relatively precise and reliable responses to external signals even though substantial noise is inevitably involved in the signals. An intriguing question is the way how cells can manage to do it. One possible way to realize such response for a cell is to evolutionary develop and optimize its intracellular signaling pathways so as to extract relevant information from the noisy signal. We recently demonstrated that certain intracellular signaling reactions could actually conduct statistically optimal information processing. In this paper, we clarify that such optimal reaction operates near bifurcation point. This result suggests that critical-like phenomena in the single-cell level may be linked to efficient information processing inside a cell. In addition, improving the performance of response in the single-cell level is not the only way for cells to realize reliable response. Another possible strategy is to integrate information of individual cells by cell-to-cell interaction such as quorum sensing. Since cell-to-cell interaction is a common phenomenon, it is equally important to investigate how cells can integrate their information by cell-to-cell interaction to realize efficient information processing in the population level. In this paper, we consider roles and benefits of cell-to-cell interaction by considering integrations of obtained information of individuals with the other cells from the viewpoint of information processing. We also demonstrate that, by introducing cell movement, spatial organizations can spontaneously emerge as a result of efficient responses of the population to external signals.
Keywords: cellular information processing, autophosphorylation, ultrasensitivity, collective behavior
1. Introduction
A variety of cellular phenomena commonly suffer from substantial noise in intracellular reactions and their environmental signals. Recent experimental observations have revealed that the noise could be strong enough to disturb robust cellular processes and functions (Shahrezaei and Swain, 2008; Eldar and Elowitz, 2010). Nonetheless, cells often respond robustly to changing environments both at individual and population levels. At the individual level, examples include differentiation, metabolic switch, apoptosis, and chemotaxis (Blake et al., 2003, 2006; Ueda and Shibata, 2007; Fraser and Kaern, 2009; Macarthur et al., 2009; Zhang et al., 2009). They suggest that intracellular kinetics can perform information processing to efficiently extract information from noisy signals. On the problem of intracellular information processing, theoretical study has been focusing on structures of molecular networks and their dynamical properties behind these phenomena (Arai et al., 2010). In particular, it has been suggested that qualitative properties such as bifurcation structures play an important role in the information processing (Toyoizumi and Abbott, 2011).
The information processing at population level is also a key topic as collective behavior is ubiquitous in biological systems. In addition to intracellular kinetics, cell-to-cell interaction is crucial to understand mechanisms and benefits of robust responses. Examples include synchronization and quorum sensing (Pai and You, 2009; Mehta and Gregor, 2010).
Among various cellular information processing, of particular importance is information transmission (Cheong et al., 2011; Tkacik and Walczak, 2011), in which information of environmental change is transferred by multiple steps through molecular and cellular networks, and integrated at the end point to make responses. In this work, we consider that the process is simply modeled with three parts as x(t): environment → y(t): observation → z(t): environmental information. An intriguing question is how cells can robustly transmit the information of x(t) into the end point z(t) by chemical reactions, even though inevitable noise comes to the intermediate step y(t). Recently, for a binary environment x(t) ∈ {0, 1}, we showed that autophosphorylation and autodephosphorylation (aPadP) cycle is one of the implementations of the Bayesian inference at the individual level to perform the optimal information transmission to z(t) through noisy y(t) (Kobayashi, 2010; Kobayashi and Kamimura, 2011). In Kobayashi (2010), the aPadP cycle, z(t), was demonstrated to respond ultrasensitively to x(t). This fact suggests that the dynamic properties of z(t) has certain connection with bifurcation. Nonetheless, the connection between the optimal kinetics and bifurcation structures has not yet been investigated.
In addition, cells do not always behave individually but collectively. Cell-to-cell interactions enable cells to integrate the information zj of the environment x(t) that individual cells obtain. Therefore, collective information processing is also an important strategy of cells to realize robust response to the changing environment. However, little is known about what kind of cell-to-cell interaction can improve the information processing, especially information transmission.
This paper addresses the problem of information processing by focusing both on individual and population levels. By introducing non-linearity in feedback loops of the aPadP cycle, we show that the optimal information transmission dynamics operates near a bifurcation point at the individual level. At the population level, we investigate benefits of cell-to-cell interactions. We also demonstrate the effect of information processing to a collective motion by introducing a simple model.
2. Optimal Information Transfer by Intracellular Dynamics
2.1. Implementation by aPadP cycle
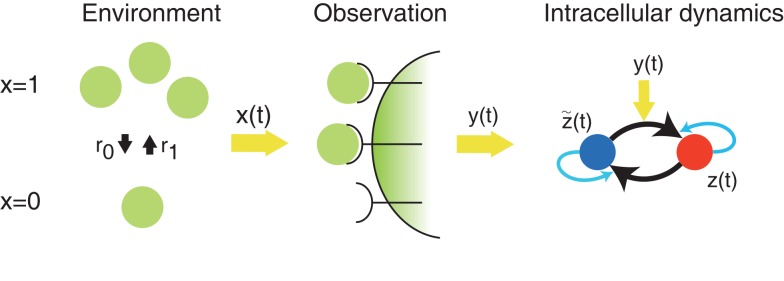
In this subsection, we explain the implementation of optimal decoding dynamics by the aPadP cycle, which was obtained in (Kobayashi, 2010). Figure 1 shows a schematic diagram of optimal information transfer by intracellular dynamics in (Kobayashi, 2010). The state of environment x(t) is binary as x(t) ∈ {0, 1}. The transition rates from 0 to 1, and 1 to 0 are denoted by r1 and r0, respectively. The role of observation is played by N0 receptors on the membrane: each receptor stochastically activates by following a Poisson point process in which the intensity parameter λ(t) = λ(x(t)) is a function of the state of the environment. Here, we denote λ1 = λ(x = 1) and λ0 = λ(x = 0).
Figure 1.
Schematic diagram of optimal information transfer by the aPadP cycle. x(t) represents the current state of the environment, and y(t) is the stochastic behavior of receptors in response to the state of environment. z(t) is an intracellular dynamics that is driven by the noisy y(t).
Given the above parameters, the optimal decoding dynamics was obtained in (Kobayashi, 2010) by using the theory of Bayesian inference as
| (1) |
where . The first terms of right-hand-side of equation (1) are identified as the aPadP cycle, in which zi and correspond to the ratio of phosphorylated and unphosphorylated molecules, respectively. The input from the observation is y(t) = N(t)/N0τ, where N(t) is the total number of activated receptors at t and τ is the duration a receptor being active. In the first terms, and can be regarded as phosphorylation and dephosphorylation reactions with autoregulatory feedback loops, respectively. The phosphorylation is induced by the noisy y(t). The second and third terms of equation (1) represent spontaneous phosphorylation and dephosphorylation reactions, respectively. Even though the formalism is valid for arbitrary positive values of r0 and r1, we assume r0 = r1 = r for the sake of simplicity in this paper.
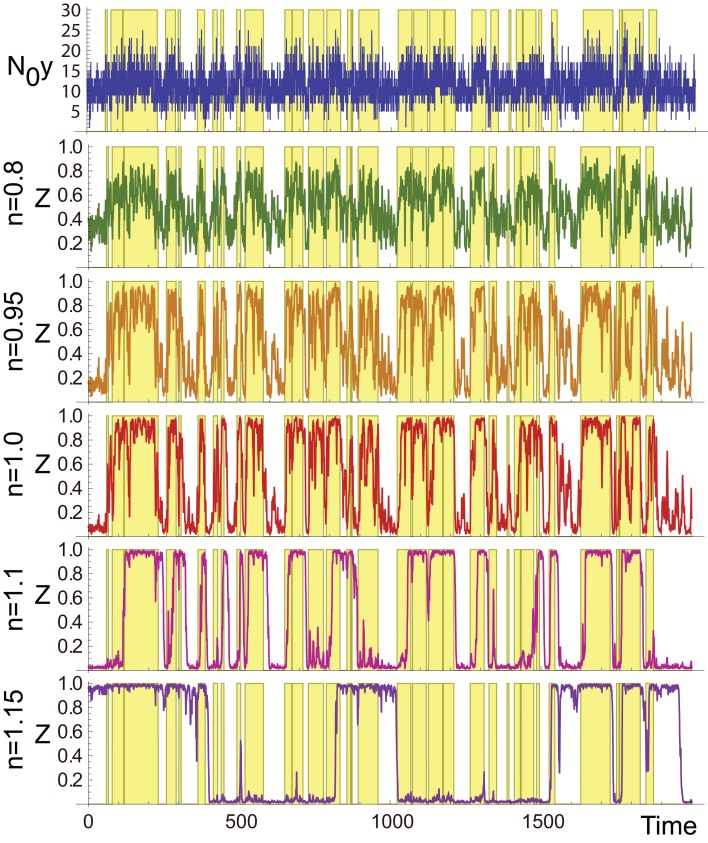
As demonstrated in Figure 2, zi in the aPadP cycle efficiently identifies the changes in x(t) even though the input y(t) is very noisy (see top and the fourth panel (n = 1) in Figure 2).
Figure 2.
Sample trajectories of N0y(t) (top) and zi for different values of n. The yellow-shaded region indicates the period when x(t) = 1, and the white region indicates x(t) = 0. The parameters are N0 = 100, λ1 = 0.13, λ0 = 0.1, and r0 = r1 = 0.03.
2.2. Non-linear model
In order to evaluate the underlying dynamical properties of the aPadP cycle, we extend equation (1) by introducing parameters that control non-linearity of autoregulatory feedback loops as
| (2) |
where n1 and n2 control the non-linearity of the feedbacks and v(n1, n2) is the time scale parameter. When n1 = n2 = 1 and v(n1, n2) = 1, then this model is reduced to the original aPadP cycle. For simplicity of comparison, we consider the case that n1 = n2 = n. In addition, the time scale is adjusted for comparison such that
holds approximately for 0.8 ≤ n ≤ 1.2. Here, y0 is the threshold value that satisfies F(1/2, y0) = 0.
3. Optimal Information Processing Near a Bifurcation Point
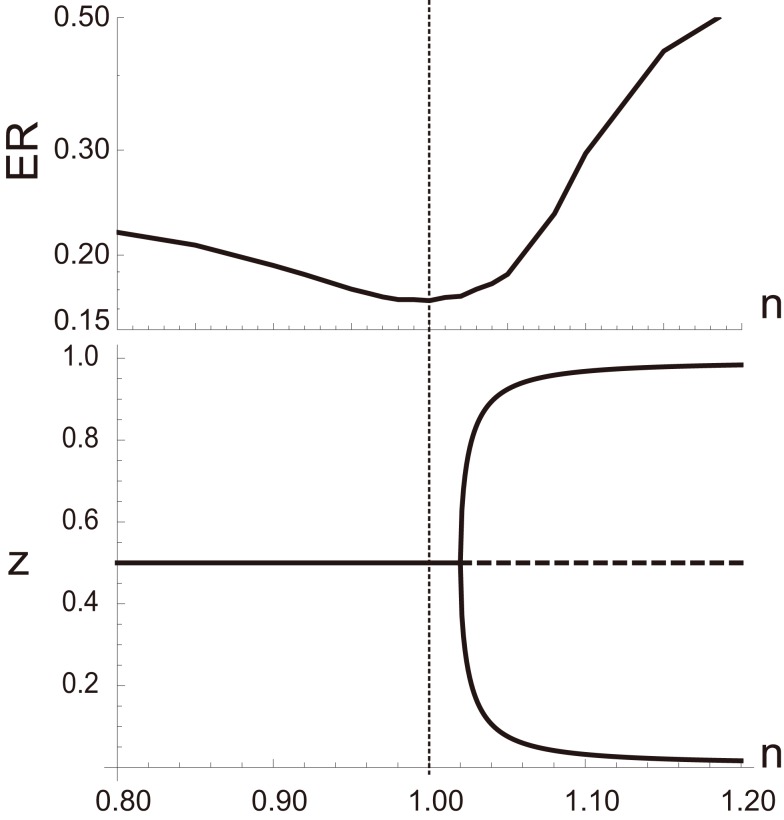
The aPadP cycle is an implementation for the information transmission dynamics that can efficiently extract information of input even with noisy y(t). As clarified in (Kobayashi, 2010), equation (1) has only single stationary state for a fixed y, and does not show any phase transition or bifurcation for all values of y. Nonetheless, the stationary state z as a function of y has highly non-linear dependency on y when r0 and r1 are small, suggesting that equation (1) is operating near bifurcation points. In fact, we can easily induce a deterministic bifurcation in equation (2) if we change the parameters, n1 and n2. For n1 = n2 = n, equation (2) shows deterministic saddle-node or pitchfork bifurcation when n is sufficiently greater than 1 as shown in the bottom panel of Figure 3. By numerically evaluating the performance of equation (2) to extract information from noisy y(t) by error rate (ER), we find that the performance is actually maximized when n is close to 1, indicating that the optimal information processing is achieved near the bifurcation point. To further clarify the relation between optimal information processing of noisy signal and the underlying dynamics, we transform equation (1) into the following equation by a coordinate transformation as :
Figure 3.
(Top) Error rate (ER) defined by as a function of n, where Id(u) = 1 when u is true and Id(u) = 0 otherwise. (Bottom) Bifurcation diagram of equation (1). All the parameters other than n are the same as those in Figure 2.
| (3) |
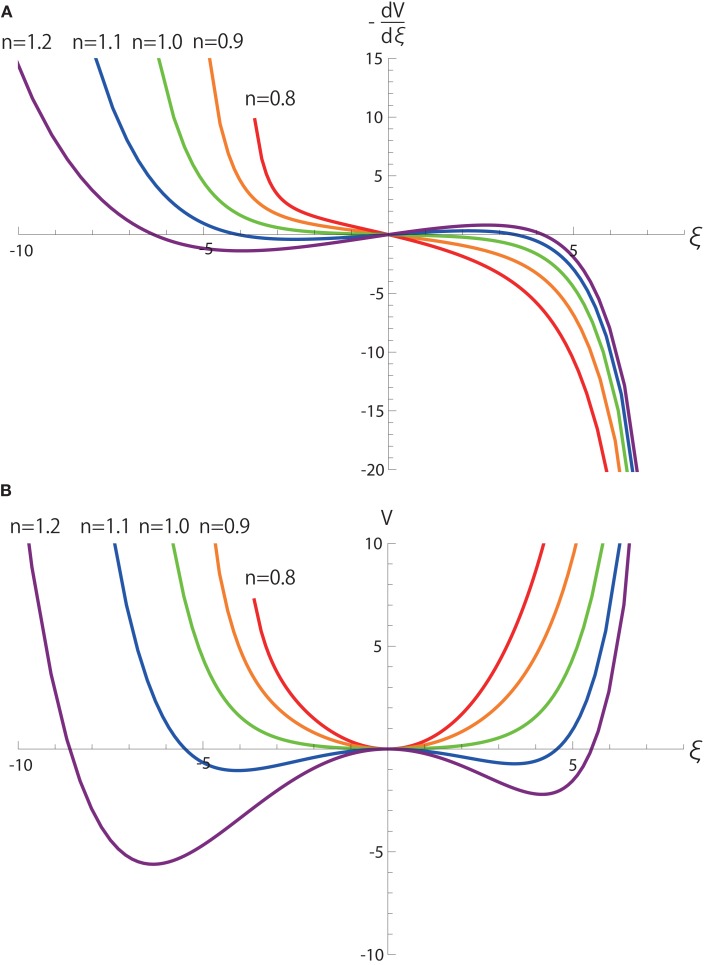
The first term including y(t) clearly demonstrates that y(t) is integrated on the coordinate ξ with a neutral dynamics. In other words, weights of integrating y(t) do not depend on the values of ξ, and thereby, when r0 = r1 = 0. The second terms including r0 and r1 introduces a single-well potential on ξ whose contribution is linearly dependent on r0 and r1 as shown in Figure 4. Thus, when r0 and r1 are small, the dynamics of ξ is dominated by the integration of noisy signal y(t) over an almost neutrally stable manifold.
Figure 4.
(A) and (B) V(ξ) as functions of ξ and n in equation (4). Here, v(n) = 1. All the parameters other than n are the same as those in Figure 2.
In addition, we consider the coordinate transformation for a general n, and thus equation (2) is written in the form,
| (4) |
Although the term cannot be obtained analytically with respect to ξ, we numerically calculate the term and its integral V as a function of ξ as in Figure 4. V clarifies that the dynamics become most neutral near the bifurcation point n = 1 because derivatives of V up to second order do not depend on ξ in the vicinity of ξ = 0.
4. Cell-to-Cell Interactions
In the population of cells, cell-to-cell interactions can bring a mechanism to integrate the information zj of individual cells.
To investigate the role and benefit of cell-to-cell interaction, we consider NC cells under the identical environment x(t). Each cell has N0 receptors and the aPadP cycle as its intracellular dynamics. We assume the i-th cell (i ∈ {1, …, NC}) receives information on x(t), zj(j ≠ i), from the other cells by cell-to-cell interaction. In order to represent the interaction, Gi(z) is introduced in addition to F(zi, y(t)) in equation (1).
4.1. Global interaction case
While there are several ways to realize cell-to-cell interaction, we assume in this paper that the i-th cell uses zj(t) from j-th cell in the same way as the optimal dynamics uses the noisy signals y(t). As clarified in (Kobayashi, 2010), the optimal kinetics updates zi by the log-likelihoods of receptors’ activations. In the same manner, zi and zj are fused to update zi as follows. For t′ = t + Δt,
| (5) |
By the normalization condition for zi(t′), equation (5) is written as
| (6) |
where .
For sufficiently small Δt, equation (6) can be written in the form of a differential equation as,
| (7) |
For the interaction term Gi(z), we consider a mean field of the other cells to study the effect on the cell i, thus, we make a sum for all the other cells j ≠ i as
| (8) |
where D is the coupling strength and NC − 1 is the total number of cells with which the i-th cell interacts. A cell updates its zi as .
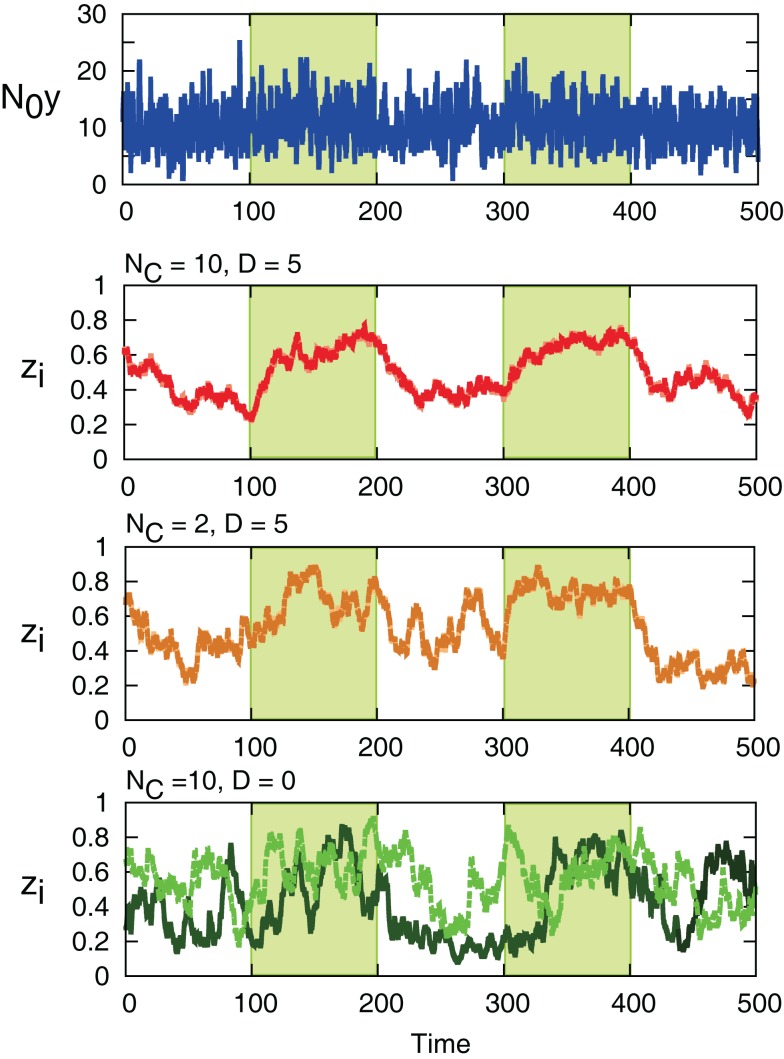
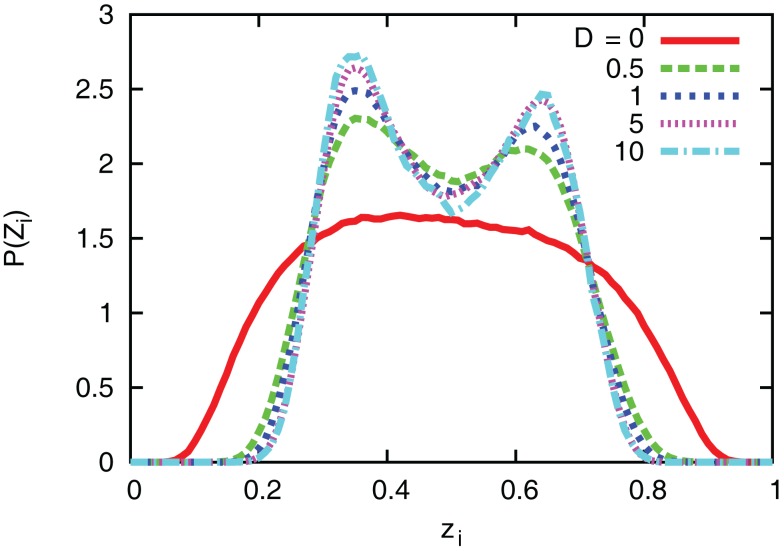
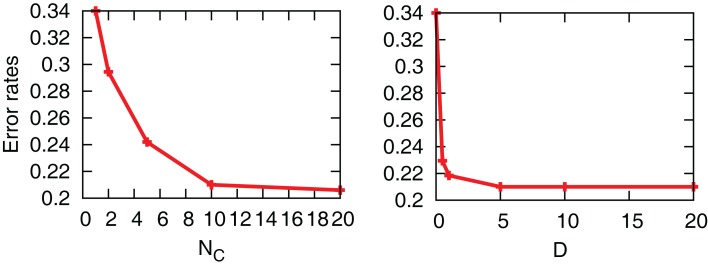
The interaction term equation (7) has effects of averaging zi and zj because it is positive when zj > zi, and negative when zj < zi. This averaging effect results in less variances among cells. Figure 5 shows typical trajectories of N0y(t), and zi. Even though we show the trajectories of two cells in each panel for zi, they are indistinguishable when the interaction is sufficiently strong (second and third panels). In addition, the trajectories with interactions run rather in the vicinity of zi = 0.5 than zi = 0 and 1, in comparison with no interaction case (bottom panel). Actually, as shown in Figure 6, the distribution of zi become consolidated to the vicinity of zi = 0.5 and bimodal as D increases. The bimodality in zi suggests the improvement of estimating the binary x(t). In order to investigate if the interaction improves the estimation of x(t), we calculate error rates, ER. Figure 7 shows the error rates as a function of D and NC. For the parameter ranges examined, the error rates decrease as D and NC increase, meaning that detection of environmental state becomes efficient when more cells are involved with stronger interaction.
Figure 5.
Sample trajectories of N0y(t) (top) and zi for (NC, D) = (10, 5), (2, 5), and (10, 0). (NC, D) = (10, 0) corresponds to no interaction. For zi, the values of two cells in the system are shown with different colors. The green-shaded region is x(t) = 1, otherwise x(t) = 0. Parameters are λ1 = 0.11, λ0 = 0.1, and r0 = r1 = 0.03.
Figure 6.
Distribution of zi for different values of coupling strength D. The number of cells and parameters are NC = 10, λ1 = 0.11, and λ0 = 0.1.
Figure 7.
Error rates as a function of D and NC. For left and right figures, we fix D = 5 and NC = 10, respectively. The other parameters are fixed as r0 = r1 = 0.03, λ1 = 0.11, and λ0 = 0.1.
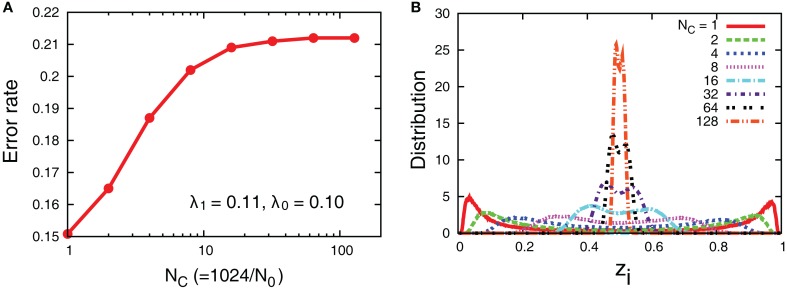
Even though the interaction decreases error rates of each cell, it does not outperform the case in which all the receptors’ input is introduced into one aPadP cycle. In Figure 8, we simultaneously change NC and N0 with the total number of receptors fixed. The case of NC = 1 gives a minimum error rate and also has most distinct distribution of zi. This result indicates that when the total information input is constant as it is better to process in one cell rather than dividing them into parallel cells.
Figure 8.
(A) Error rates as a function of NC and (B) distribution of zi with fixed total number of receptors, The other parameters are λ1 = 0.11, λ0 = 0.1, and D = 5.
In addition to the original aPadP cycle, we also examine in Figure 9 the behavior of the non-linear model with cell-to-cell interactions. As shown in Figure 9A, the error rates decrease with NC for n = 0.8 and 1 while it remains constant at 0.5 for n = 1.2. In Figure 9B for n = 1.2, the time trajectory of zi stays near zi = 0, irrespective of the state of x(t). For different samples, it stays near zi = 1, although it is not shown in the figure. These stationary states, respectively, correspond to those of the bifurcation diagram in Figure 3. Once the system bifurcates to have two stable stationary states as n increases, the stationary states show less dependency on y. Thereby, the cell cannot efficiently detect the change of the environment via y(t).
Figure 9.
Error rates and sample trajectories of zi for the non-linear model with n = 0.8, 1, 1.2 when there is cell-cell interaction. For (A,B), we fix D = 5 and NC = 10, respectively. In (B), the green-shaded region indicates the period when x(t) = 1, otherwise x(t) = 0. The line zi = 0.5 is also shown for clarity. The other parameters are fixed as v(n) = 1, r0 = r1 = 0.03, λ1 = 0.11, and λ0 = 0.1.
On the other hand, the cell-to-cell interactions improve the behavior of the non-linear model for n = 0.8, and the error rates become smaller than those in the case of n = 1 as NC increases. This result suggests that the optimality at the population level can be different, depending on the interaction, from that at the individual level.
4.2. Local interaction and cellular movements
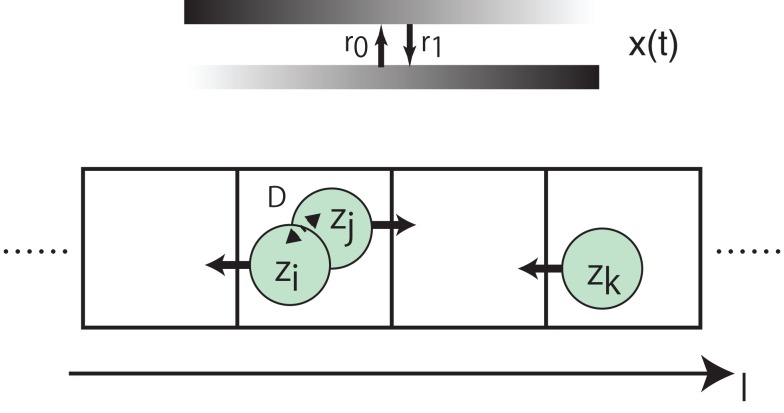
In addition to the global interaction, local one is relevant to a variety of cellular activities, particularly in spatially distributed systems. In fact, the aPadP cycle can be identified as a model of chemotaxis in one-dimensional space (Kobayashi, 2011). In chemotaxis, cells detect gradient of chemoattractants and make actions by their movements. In the model, the binary environment x corresponds to the direction of the gradient where x(t) = 0 and 1 correspond to left and right, respectively. The input y(t) corresponds to the difference of external signals between the two sides of the one-dimensional cell. zi corresponds to a ratio of polarized protein between the two sides, which plays the role of detecting the gradient.
As an example of actions that each cell makes based on zi, we consider a simple model of cell movements to investigate the effect of local interaction on behavior of spatial organizations. As shown in Figure 10, cells are in a one-dimensional discrete space, and make actions by hopping to one of the two nearest grids. Periodic boundary conditions are imposed, and the initial condition is that cells are randomly distributed over the grids. Each grid can be occupied by any number of cells, and each cell interacts with the other cells in the same grid as in equation (8). We assume that the preferred direction for cells such as a gradient of chemoattractants changes over time with rates r0 and r1, respectively. For every τm, all cells hop simultaneously to one of the nearest grids based on zi: the i-th cell (i ∈ {1, …, NC}), at l, hops to l − 1 if zi < 0.5, otherwise hops to l + 1.
Figure 10.
Schematic diagram of the cellular movement model we investigate.
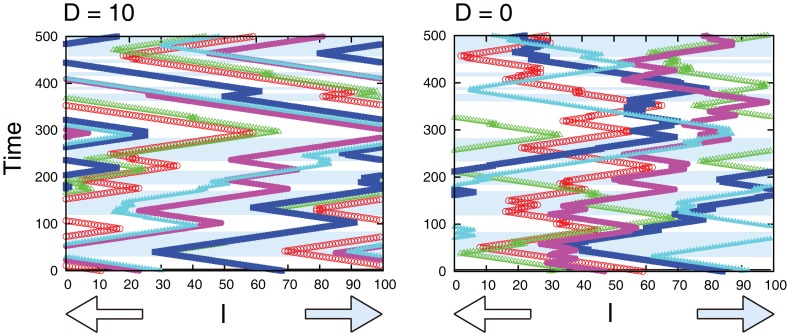
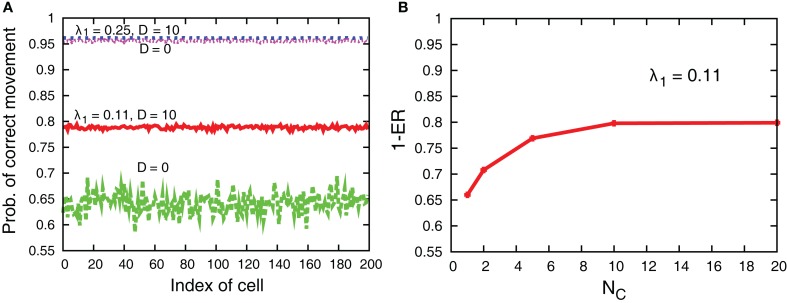
Figure 11 compares sample trajectories of the movements of several cells when the interaction is either present or absent. We can clearly see that the moving direction is almost the same among cells when the interaction is present, while the direction can be different among cells when absent. In fact, as shown in Figure 12A, the interaction improves the probability of correct movement of all cells to the preferred directions and reduces variances among cells. The improvement itself is rather expected because, as shown in Figure 7, the interaction reduces error rates, ER where the probability of correct movement corresponds to 1 − ER. However, the improvement is better than expected if we consider the average number of cells in each grid. In case of λ1 = 0.11 of Figure 12A, the probability increases from around 0.65 to 0.79 so that the improvement of the probability is around 0.14. In order to investigate the number of cells with which a cell needs to interact for achieving this improvement, we plot 1 − ER of global interaction case as a function of NC in Figure 12B. This can be achieved when a cell interacts globally with more than 10 cells, while the average number of cells in each grid is for local interaction.
Figure 11.
Sample trajectories of the movements of several cells for D = 10 (left) and D = 0 (right). In the blue-shaded area, the correct movement is hopping right, otherwise hopping left. Parameters are τm = 1, Lx = 100, N0 = 100, λ1 = 0.11, and λ0 = 0.1.
Figure 12.
(A) Probability of correct movement for each cell for D = 10 and 0 in cases of λ1 = 0.11 and 0.25. The other parameters are τm = 1, Lx = 100, N0 = 100, and λ0 = 0.1. (B) 1 − ER as a function of NC in the global interaction case of D = 10.
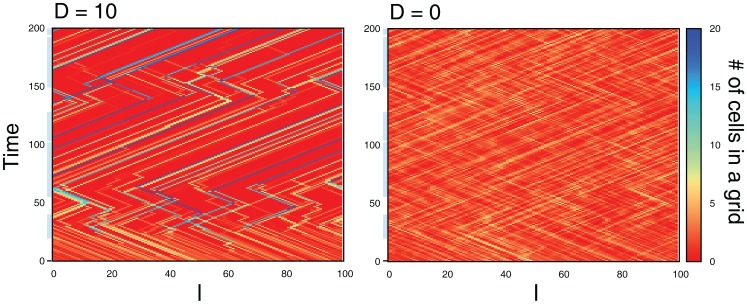
This result indicates spontaneous emergences of spatial aggregation of cells, in which the cells tend to occupy the same grids. In fact, Figure 13 shows time evolution of the number of cells in grids from randomly distributed initial condition for the cases D = 10 and 0. From the initial condition, the interaction results in the emergence of grids occupied by a large number of cells, while no such spatial structure appears without interaction (D = 0). In addition, the grids move in either of the directions, maintaining the number of cells. These results indicate the interaction causes not only the aggregation of cells into the same grids, but also collective movements of cells, even though the interaction does not explicitly implement it.
Figure 13.
Time evolution of the number of cells in grids from the randomly distributed initial condition in cases of D = 10 (left) and D = 0 (right). The periods that the preferred direction is hopping right is designated with light blue bar along the time axis. During the period without blue bar, the preferred direction is hopping left. Parameters are λ1 = 0.11, λ0 = 0.1, NC = 200, and Lx = 100.
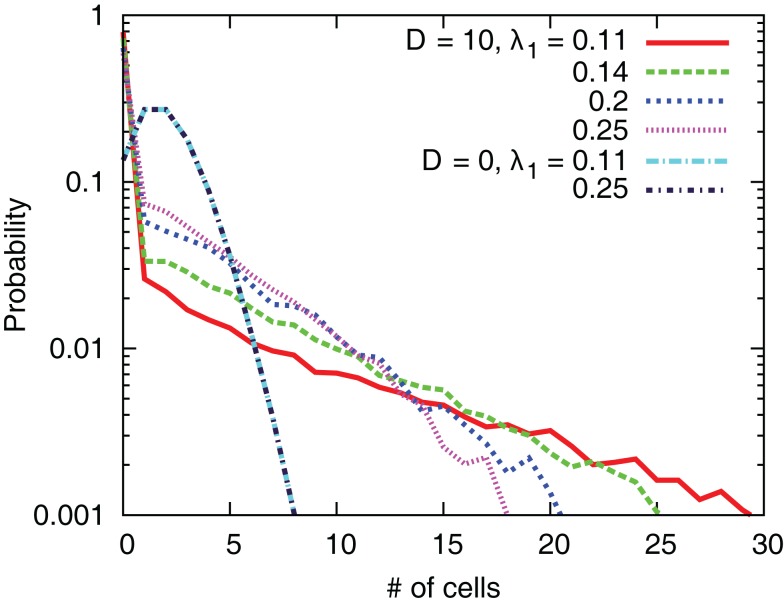
Figure 14 shows the probability distribution of the number of cells in one grid. We clearly see that the interaction leads to the emergence of grids occupied by a large number of cells. In addition, the systems with small values of λ1 tend to produce grids with large number of cells.
Figure 14.
Distribution of the number of cells in one grid for several values of D and λ1.
The emergence of the spatial organization can be explained as a by-product of the effect that values of zi in a group of interacting cells are almost synchronized and have little variances as the number of cells increases. Once a cell hops to a grid with several cells, the little variances in zi cause the same movements for cells in the grid. This leads to the collective movements of the cells in which cells in the same grid tend to move in the same direction. Unless the preferred direction changes, most cells improve their precision of the movement by sharing the grid with other cells, so that the spatial structure gradually approach to the steady state (see the behavior around time 100 in Figure 13).
The change of the preferred direction causes redistribution of the cells. During a transient period for cells to change the directions, the output zi of cells in each grid can be different so that combinations and separations of cells in grids can occur. In case of small values of λ1, i.e., λ1 = 0.11, movements of cells which share the grids with no or a few cells are rather random. On the other hand, cells with large values of λ1 can estimate the direction with relatively high precision even without interactions so that the movements are less random. Therefore, cells with small values of λ1 would have more probabilities to encounter cells in other grids, which explains the result that systems with small values of λ1 produce large groups.
Our result demonstrates that the local interactions can spontaneously organize a spatial structure for effectively utilizing information in multicellular systems. In particular, the effect appears more robustly when an individual cell cannot obtain sufficient information of environment.
5. Discussion and Conclusion
In this paper, we have investigated cellular information processing by focusing on two points: intracellular dynamics and cell-to-cell interactions.
The optimal dynamics implemented by aPadP cycle obtained in (Kobayashi, 2010) is clarified to operate near a bifurcation point by introducing non-linearity of autoregulatory feedback loops. By the coordinate transformation from z(t) to ξ(t), we demonstrate that the external noisy signal, y(t), is integrated with almost neutral dynamics as equation (3). The bias from the completely neutral dynamics is attributed to the second term in equation (3) that reflects the transition of environmental state x(t). From the information-theoretical viewpoint, the second term enables the aPadP cycle to forget the estimated state of the environment that changes randomly. The second term disappears and the optimal dynamics becomes completely neutral with respect to ξ if the environment is not changing, i.e., r0 = r1 = 0. Therefore, the neutrality of dynamics is a natural consequence of statistically optimal information processing. As we clarified, the almost neutral dynamics is dynamically implemented in equation (3) by the saddle-node or pitchfork bifurcation. While the aPadP cycle is optimal only for binary environmental changes, we expect that optimal dynamics for other types of external signals can be dynamically implemented by different bifurcation phenomena. We also expect that the connection of optimal information processing and bifurcation of underlying dynamical systems may have more mathematically fundamental structure than mere coincidence (Wu and Amari, 2005). Even though the bifurcation point can be different from the second order phase transition with which one usually associates critical phenomena, our results share a general concept that the optimal point is located near a boundary of regimes of qualitatively distinct behavior in the parameter space. In the present paper, we focused on the optimality in information processing and its realization in reaction kinetics with optimized parameters. It remains to understand how the optimal kinetics is evolutionarily achieved, including optimizing values of parameters, based on physical organizing principles.
By scaling up from a single-cell level to a multicellular level, we show that the cell-to-cell interactions can improve outputs of individual cells, and the extent of the benefits depends on the intracellular dynamics. Specifically, we find that less neutral dynamics of individual cell is more efficient for collective information processing. This result reflects the fact that individually optimal dynamics is not always efficient when they operate cooperatively. However, it is biologically common that the same cells behave both individually and collectively depending on their biological context (Mehta and Gregor, 2010). More investigation is required for the connection between individual and collective information processing and their underlying dynamics. Finally, we consider cellular movements as an action based on the integrated information and demonstrate a spontaneous spatial aggregation and its benefits in information integration. Even though aggregation is observed in many physical systems as collective behavior of components, our result is rather a consequence of information integration than direct physical interactions to trend to aggregation in the aligned motions.
Our results suggest that the viewpoint of efficient information processing, in addition to physical point of view, can connect the performances at the individual and population levels, and explain synchronous behavior at different levels consistently.
Conflict of Interest Statement
The authors declare that the research was conducted in the absence of any commercial or financial relationships that could be construed as a potential conflict of interest.
Acknowledgments
We thank Ryo Yokota and Khayrul Md. Bashar for the fruitful discussions and their support. This work is partially supported by proposal-oriented research promotion program (PRESTO), Japan Science and Technology Agency (JST), and by the Aihara Innovative Mathematical Modeling Project, the Japan Society for the Promotion of Science (JSPS) through the “Funding Program for World-Leading Innovative R&D on Science and Technology (FIRST Program),” initiated by the Council for Science and Technology Policy (CSTP). Atsushi Kamimura is supported by the Japan Society for the Promotion of Science.
References
- Arai Y., Shibata T., Matsuoka S., Sato M. J., Yanagida T., Ueda M. (2010). Self-organization of the phosphatidylinositol lipids signaling system for random cell migration. Proc. Natl. Acad. Sci. U.S.A. 107, 12399. 10.1073/pnas.0908278107 [DOI] [PMC free article] [PubMed] [Google Scholar]
- Blake W. J., Balázsi G., Kohanski M. A., Isaacs F. J., Murphy K. F., Kuang Y., Cantor C. R., Walt D. R., Collins J. J. (2006). Phenotypic consequences of promotor-mediated transcriptional noise. Mol. Cell 24, 853. 10.1016/j.molcel.2006.11.003 [DOI] [PubMed] [Google Scholar]
- Blake W. J., Kaern M., Cantor C. R., Collins J. J. (2003). Noise in eukaryotic gene expression. Nature 422, 633. 10.1038/nature01546 [DOI] [PubMed] [Google Scholar]
- Cheong R., Rhee A., Wang C. J., Nemenman I., Levchenko A. (2011). Information transduction capacity of noisy biochemical signaling networks. Science 334, 354. 10.1126/science.1204553 [DOI] [PMC free article] [PubMed] [Google Scholar]
- Eldar A., Elowitz M. B. (2010). Functional roles for noises in genetic circuits. Nature 467, 167. 10.1038/nature09326 [DOI] [PMC free article] [PubMed] [Google Scholar]
- Fraser D., Kaern M. (2009). A chance at survival: gene expression noise and phenotypic diversication strategies. Mol. Microbiol. 71, 1333. 10.1111/j.1365-2958.2009.06605.x [DOI] [PubMed] [Google Scholar]
- Kobayashi T. J. (2010). Implementation of dynamic bayesian decision making by intracellular kinetics. Phys. Rev. Lett. 104, 228104. 10.1103/PhysRevLett.104.228104 [DOI] [PubMed] [Google Scholar]
- Kobayashi T. J. (2011). Connection between noise-induced symmetry breaking and an information-decoding function for intracellular networks. Phys. Rev. Lett. 106, 228101. 10.1103/PhysRevLett.106.057207 [DOI] [PubMed] [Google Scholar]
- Kobayashi T. J., Kamimura A. (2011). Dynamics of intracellular information decoding. Physic. Biol. 8, 055007. 10.1088/1478-3975/8/5/055007 [DOI] [PubMed] [Google Scholar]
- Macarthur B. D., Ma’ayan A., Lemischka I. R. (2009). Systems biology of stem cell fate and cellular reprogramming. Nat. Rev. Mol. Cell. Biol. 10, 672. [DOI] [PMC free article] [PubMed] [Google Scholar]
- Mehta P., Gregor T. (2010). Approaching the molecular origins of collective dynamics in oscillating cell populations. Curr. Opin. Genet. Dev. 20, 574. 10.1016/j.gde.2010.09.004 [DOI] [PMC free article] [PubMed] [Google Scholar]
- Pai A., You L. (2009). Optimal tuning of bacterial sensing potential. Mol. Syst. Biol. 5, 286. 10.1038/msb.2009.43 [DOI] [PMC free article] [PubMed] [Google Scholar]
- Shahrezaei V., Swain P. S. (2008). The stochastic nature of biochemical networks. Curr. Opin. Biotech. 19, 369. 10.1016/j.copbio.2008.06.011 [DOI] [PubMed] [Google Scholar]
- Tkacik G., Walczak A. M. (2011). Information transmission in genetic regulatory networks: a review. J. Phys. Condens. Matter 23, 153102. 10.1088/0953-8984/23/15/153102 [DOI] [PubMed] [Google Scholar]
- Toyoizumi T., Abbott L. F. (2011). Beyond the edge of chaos: amplication and temporal integration by recurrent networks in the chaotic regime. Phys. Rev. E 84, 051908. 10.1103/PhysRevE.84.051908 [DOI] [PMC free article] [PubMed] [Google Scholar]
- Ueda M., Shibata T. (2007). Stochastic signal processing and transduction in chemotactic response of eukaryotic cells. Biophys. J. 93, 11. 10.1529/biophysj.106.100263 [DOI] [PMC free article] [PubMed] [Google Scholar]
- Wu S., Amari S. (2005). Computing with continuous attractors: stability and online aspects. Neural Comp. 17, 2215. 10.1162/0899766053491896 [DOI] [PubMed] [Google Scholar]
- Zhang X.-P., Liu F., Cheng Z., Wang W. (2009). Cell fate decision mediated by p53 pulses. Proc. Natl. Acad. Sci. U.S.A. 106, 12245. 10.1073/pnas.0904189106 [DOI] [PMC free article] [PubMed] [Google Scholar]


