Abstract
Accurate anatomic co-registration is a prerequisite for identifying structural and functional changes in longitudinal studies of brain plasticity. Current MRI methods permit collection of brain images across multiple scales, ranging from whole brain at relatively low resolution (≥1 mm), to local brain areas at the level of cortical layers and columns (~100 µm) in the same session, allowing detection of subtle structural changes on a similar spatial scale. To measure these changes reliably, high resolution structural and functional images of local brain regions must be registered accurately across imaging sessions. The present study describes a robust fully automated strategy for the registration of high resolution structural images of brain sub-volumes to lower resolution whole brain images collected within a session, and the registration of partially overlapping high resolution MRI sub-volumes (“slabs”) across imaging sessions. In high field (9.4 T) reduced field-of-view high resolution structural imaging studies using a surface coil in an anesthetized non-human primate model, this fully automated coregistration pipeline was robust in the face of significant inhomogeneities in image intensity and tissue contrast arising from the spatially inhomogeneous transmit and receive properties of the surface coil, achieving a registration accuracy of 30 ± 15 µm between sessions.
Keywords: Rigid registration, Longitudinal studies, MRI, Attenuation artefacts in MR, Primates
1. Introduction
There is compelling evidence that plastic changes of the brain are a key etiologic factor in the emergence of a broad range of neurological, psychiatric and behavioral disorders. The development of successful therapies to remediate these pathological plastic changes requires, among other things, the availability of robust quantitative measures of plasticity that can link the spatiotemporal trajectories of cellular and molecular events in vitro to central nervous system (CNS) remodeling in vivo in animals, and ultimately in humans. The enhancement of existing and the development of new MRI methods for measuring CNS plasticity, together with tools that allow the MRI observations in animal models to be linked back to molecular and cellular events on the one hand, and to plastic changes in the human CNS on the other, will provide a methodological bridge across scales and species. Central to the success of such an enterprise is the ability to achieve stable, unbiased and, ideally, fully automated coregistration of structural images collected from the same subject longitudinally over time. The fidelity of this coregistration ultimately constrains the sensitivity with which MRI can detect changes in local structure and/or function associated with normal and pathological brain remodeling in vivo. Currently, high resolution (≤100 µm) imaging of the whole brain in vivo requires an impractically long time. Rather, a sub-volume is imaged, whose position is prescribed using a lower resolution larger field of view images for guidance. The challenge in longitudinal studies is to achieve accurate coregistration of the sub-volumes across imaging sessions that may be separated by days to years.
A large body of work dealing with the longitudinal registration of both human and animal head scans has been published over the years and a complete review of these methods (see for instance, Pluim et al., 2003) is beyond the scope of this article. However, these methods are generally applied to whole brain images or to slabs covering an entire cross-section of the head (Baker et al., 2006; Schweizer et al., 2008; Sydekum et al., 2009). In the present work we address a more general problem, that of coregistering very high resolution images of local brain areas collected from the same subject at different times in order to quantify functional and structural changes over time. These high resolution image sets generally comprise sub-volumes (or “slabs”) within a larger volume of brain imaged at lower spatial resolution.
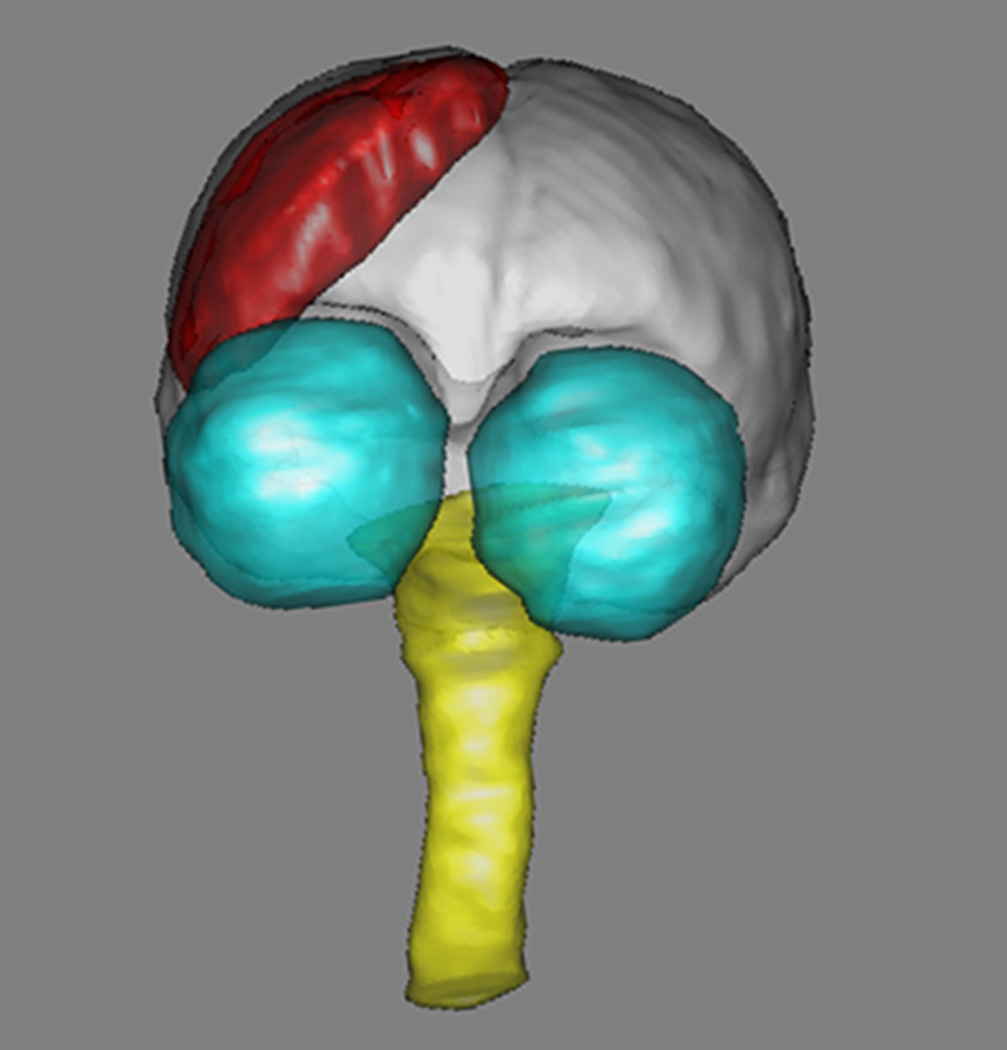
In current practice, the position of a slab is prescribed manually with the help of a user interface provided by the scanner manufacturer, using the lower resolution larger field of view images for guidance. This is a somewhat unreliable process and its accuracy largely depends on the skills of the operator. In general, however, the slabs acquired during different sessions, possibly separated by long periods of time, will not cover exactly the same brain volume nor are they acquired with exactly the same orientation. It is therefore necessary for high resolution sub-volumes to be registered retrospectively. Currently, there is no automatic method for the coregistration of overlapping but non-identical slabs acquired in different sessions. Manual coregistration introduces another source of inaccuracy and is subject to examiner’s experience. Thus, the goal of the present study was to develop and assess the performance of an accurate, reliable, and automated process for coregistering MRI scans acquired longitudinally from the same subject across multiple imaging sessions. In particular, we sought to achieve high fidelity coregistration of very high resolution structural image sets providing partial brain coverage (referred to here as “slabs”) acquired using surface transceiver coils whose image intensities are spatially inhomogeneous. In the present study these slabs are centered on the somato-sensory cortex, a region of the cortex corresponding to areas 1, 2 and 3 of Brodmann’s nomenclature (Brodmann, 1909) and responsible for the sense of fine touch and proprioception of hand and face (Penfield and Rasmussen, 1950). Fig. 1 illustrates the typical position, orientation, and coverage of a slab. The unique nature of our data set and the accuracy requirements for our long term goals necessitated the development of a new registration procedure, which is described and evaluated in this article.
Fig. 1.
3D rendering of brain (white), eyes (cyan), brain stem and spine (yellow) and slab (red). (For interpretation of the references to color in this figure legend, the reader is referred to the web version of this article.)
2. Images and acquisition protocol
MR images were acquired across multiple sessions separated by weeks to months from five male squirrel monkeys aged 4–5 years, and weighing 800–1100 g under an IACUC approved protocol on a 9.4 T Varian scanner. The animals were scanned under anesthesia to reduce artefacts caused by intra-session motion. Anesthesia was induced with ketamine (10–30 mg/kg) and atropine (0.03–0.08 mg/kg), and maintained by isoflurane (0.75–2%) with a NO2/O2 ratio of 7/3. Two data sets were acquired during each session: (1) a lower resolution 3D head scan covering the whole head, referred to as a low-resolution whole-head scan, that was used to guide positioning of the high-resolution sub-volume; (2) an oblique high resolution scan, covering a smaller sub-volume of the cortex, referred to going forward, as a “slab”.
2.1. Low-resolution whole-head scan
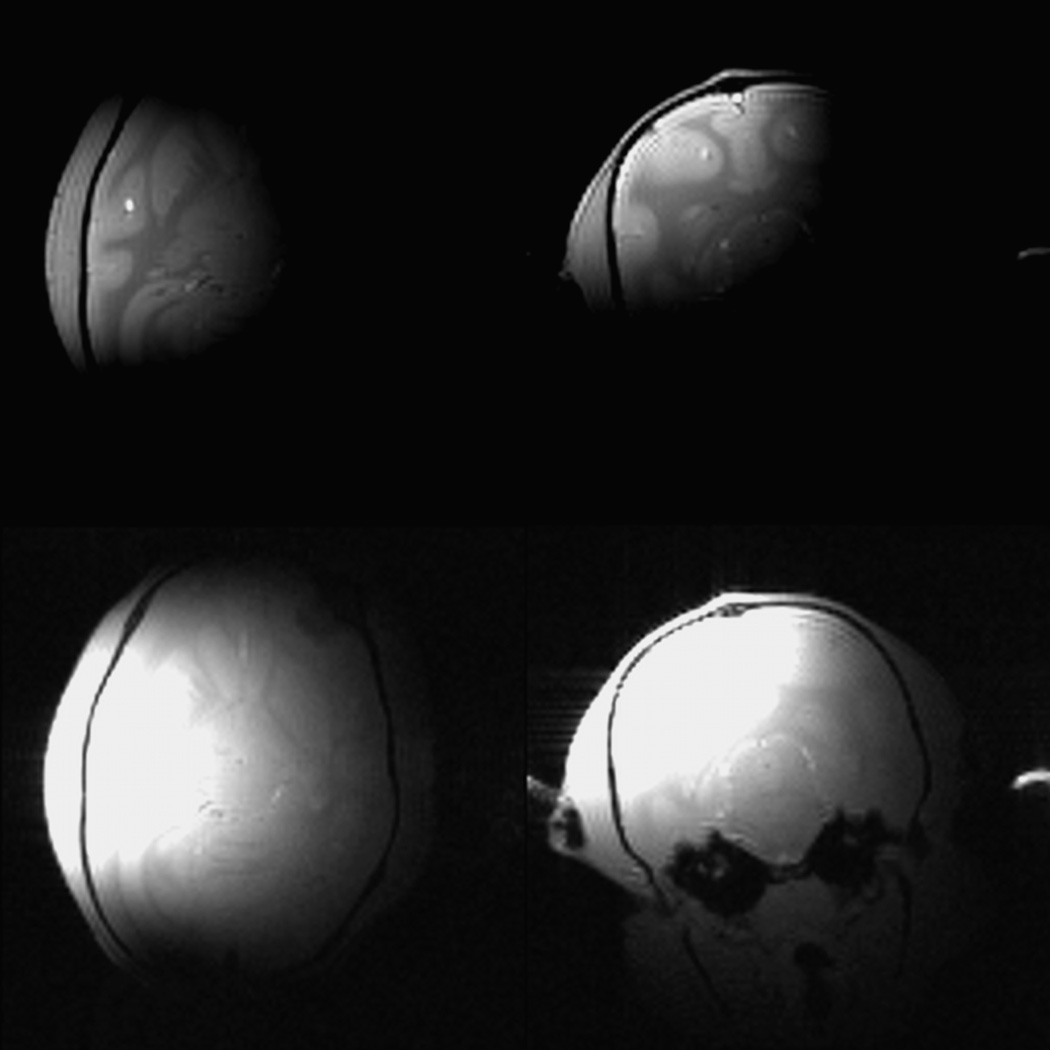
Low-resolution whole-head images were acquired with the same 3 cm surface coil used to acquire the slabs. A surface coil was used so that the robustness of the registration in the face of large variations in tissue contrast and signal-to-noise ratio arising from the spatial inhomogeneity of transmit B1 and receiver sensitivity could be determined. The slab and the low-resolution whole-head images were acquired within the same session, and neither the animal nor the coil was repositioned during the session. The low-resolution whole-head scans were collected using a 3D FLASH sequence (nominal flip angle = 15°; TR/TE = 5/2.39 ms; FoV = 64 mm × 64 mm × 64 mm; 128 × 128 × 128 isotropic voxels; voxel dimension 0.5 mm ×0.5 mm × 0.5 mm). As shown in Fig. 2, these images provide whole brain coverage, but show significant signal attenuation as one moves away from the surface coil. The large intensity modulation makes it difficult to adjust the contrast to permit the visualization of anatomical details in both high intensity and low intensity regions.
Fig. 2.
Low-resolution whole-head MRI scans. Because the signal drops rapidly from the coil, the contrast needs to be adjusted to permit visualization. Bottom row: two views with contrast adjusted to show details in regions of low intensity. Top row: Same images with contrast adjusted to show details in regions of high intensity. When the contrast is adjusted for high intensity regions, the rest of the head is not visible. When it is adjusted for low intensity regions, the area close to the coil is saturated.
2.2. High resolution slabs
Each slab, comprising a stack of contiguous thin 2D images oriented obliquely with respect to the scanner frame of reference, was positioned using anatomic landmarks present in the low-resolution whole-head image. High resolution slabs were collected using a multislice 2D FLASH sequence (nominal flip angle 25°; TR/TE = 400/16 ms; FoV = 35 mm × 35 mm; 512 × 512 in plane voxels; in-plane pixel resolution 68.35 µm × 68.35 µm; 16 contiguous slices, thickness 0.5 mm; slab thickness 8 mm). Fig. 3 shows a typical high resolution slab in three orthogonal directions.
Fig. 3.
Three orthogonal views of a slab.
3. Methodology
In this work, we assume that geometric distortion is minimal. With the high bandwidth acquisition sequences we use, this assumption is reasonable. Based on this assumption, all the transformations needed to register the various scans are rigid-body transformations, i.e., they only involve a translation vector [tx,ty,tz] and a rotation matrix R(φ,θ,ψ).
3.1. Direct slab to slab registration
The easiest approach to compute the rigid-body parameters would be to register slabs acquired during different sessions to each other directly with a standard intensity-based algorithm. Our in-house implementation of such an algorithm, which we call AMIR, computes the transformation that maximizes the normalized mutual information (NMI) (Studholme et al., 1999) between the image volumes. Mutual information (MI) (Collignon et al., 1995; Viola and Wells, 1995) and NMI have been used extensively as similarity measures for the registration of single and multi-modality images since the validation study conducted by Fitzpatrick and West (1998). NMI has been documented as being more robust than MI for partially overlapping volumes (Studholme et al., 1999). NMI is defined as:
| (1) |
where H(A) is the marginal entropy of image A, H(B) is the marginal entropy of image B and H(A,B) is the joint entropy of images A and B (Shannon, 1948). The marginal entropy of an image is computed from its intensity probability density function as:
| (2) |
where i is an intensity and p(i) is the probability of observing intensity i in the image. The intensity probability density function is estimated from the normalized intensity histogram. Similarly, the joint entropy of two images is computed as
| (3) |
where p(i,j) is the joint probability density function estimated from the normalized joint intensity histogram. Intensity histograms were built with 128 intensity bins. This direct approach did not produce reliable results. Experiments performed to determine the cause of the failure, and discussed in the Results section, revealed that it is related to the approach’s small capture range and imperfect overlap of the data (between 67 and 86%). The following sections describe the solution that has been developed to address this problem.
3.2. Slab to low-resolution whole-head scan registration
Since the animals are anesthetized and their heads are immobilized during imaging, motion between the slab and the low-resolution whole-head scan can be assumed to be minimal. The transformation that registers these scans can thus be computed analytically using image coordinates and scanning information retrieved from the image headers (Euler angles used to acquire the scan and center of the volume). In principle, this approach should lead to an accurate registration but we have observed a small residual error, which we attribute to the hardware. To correct for this residual error, we used our in-house implementation of an intensity-based registration algorithm, AMIR, where intensity histograms were again built with 128 intensity bins.
3.3. Low-resolution whole-head scan co-registration
The easiest approach to register the inter-session low-resolution whole-head scans is to apply an intensity based registration algorithm to these image volumes. However, as discussed previously, these images are affected by signal drop-off with increasing distance from the transceiver coil. This signal attenuation presents a challenge for intensity-based registration methods and, as shown in the results section, registration of the unprocessed volumes led to poor results. Methods have been proposed in the literature to correct for intensity variation (see for instance Dawant et al., 1993; Ashburner and Friston, 1998; Sled et al., 1998; Van Leemput et al., 1999; Shattuck et al., 2001). However, these methods were developed and are typically used for whole human head images acquired using volume coils at 1.5 or 3 T.
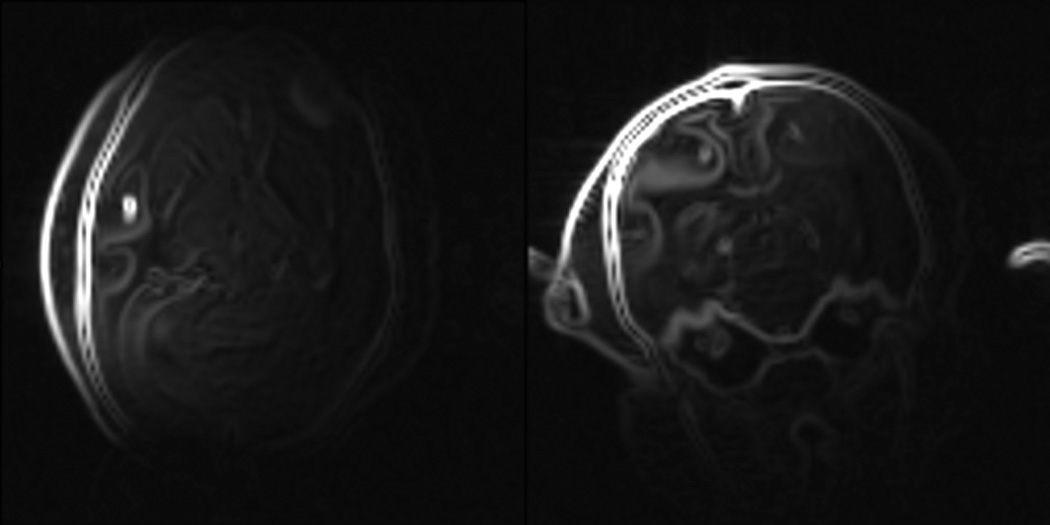
Rather than attempting to develop an intensity correction algorithm for the type of images used in the study, we opted to work with the gradient images. This approach helps to mitigate the spatial variations in signal amplitude and tissue contrast that result from the inhomogeneous transmit/receive characteristics of the surface coil, and to the extent that it is successful in the setting of spatial inhomogeneities in signal amplitude and tissue contrast weighting associated with surface coils, will perform well in applications using volume transceiver coils. Others (Pluim et al., 2000; Liu et al., 2006; Shams et al., 2007) have proposed combining gradient and intensity images for intensity-based registration. In the present study, however, working with the gradient images alone led to accurate results for two reasons. First, sulci are clearly visible in the images and their edges provide strong registration features. Second, the rapid intensity drop-off visible in the images is reduced in the gradient image. Fig. 4 shows illustrative examples of gradient magnitude images; the gradient images were computed with a standard 3D Sobel operator (Sobel, 1995) as implemented in ITK (Ibanez et al., 2003).
Fig. 4.
Representative low-resolution whole-head gradient magnitude images obtained with a 3D Sobel operator.
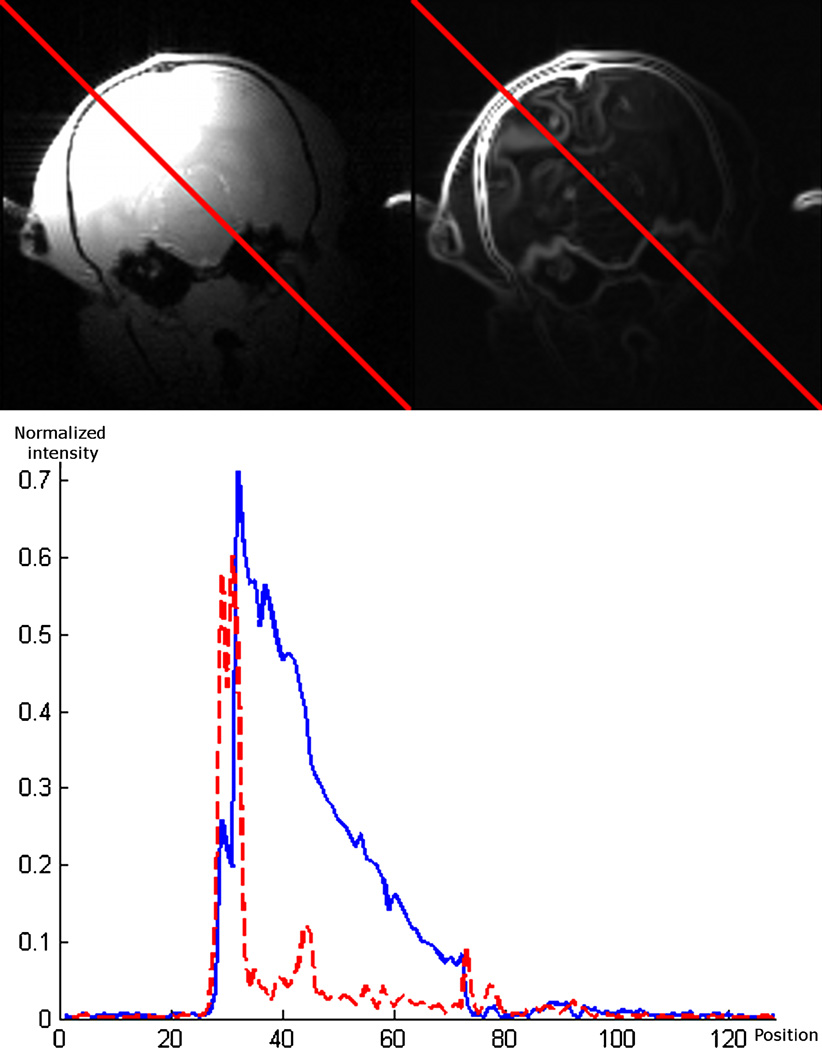
The bottom panel of Fig. 5 shows the normalized intensity profiles in the original and in the gradient magnitude images along the red line shown on the top panel. The procedure that was followed was thus to first compute the gradient magnitude of both images and then to register these with the same intensity-based registration algorithm used to register the slabs to their corresponding partial head volume. NMI was again used as the similarity measure. The intensity histograms were built with 128 bins.
Fig. 5.
Top panel, original and gradient magnitude for one low-resolution whole-head image. Bottom panel, normalized intensity profiles along the red line shown on the top panel images. Solid blue: normalized intensity profile for the original low-resolution whole-head scan. Dotted red: normalized intensity profile for the gradient magnitude image. (For interpretation of the references to color in this figure legend, the reader is referred to the web version of this article.)
3.4. Final refinement
Even though both the slab to low-resolution whole-head scan and the low-resolution whole-head scan to low-resolution whole-head scan registration steps produced results that are visually correct, the overall slab to slab registration obtained using the low-resolution whole-head images was poor. This is due to the difference in spatial resolution between the volumes. Indeed, the in-plane resolution of the partial head volumes is almost ten times lower than the resolution of the slabs. Slab to low-resolution whole-head or low-resolution whole-head to low-resolution whole-head registrations may appear accurate when evaluated with the low-resolution whole-head data, but not when slabs are compared. Nonetheless, the transformation obtained with the process described so far was sufficient to permit a final intensity-based registration of the slabs. Again, NMI was used as the similarity measure and the intensity histograms were built with 128 intensity bins.
3.5. Overall registration procedure
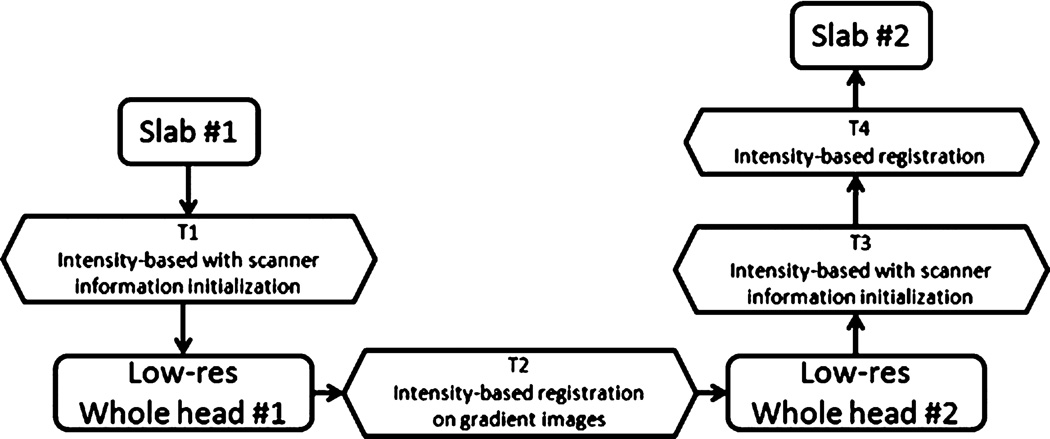
Fig. 6 summarizes the various steps involved in the procedure we have developed. The first transformation is the concatenation of the transformations computed with the scanner information and with the intensity-based registration of a slab with its corresponding partial head volume. The second transformation is estimated by the intensity-based registration of the gradient magnitude images. T3 is obtained with scanner information and with the intensity-based registration. The last transformation (T4) is estimated by the intensity-based registration of the slabs.
Fig. 6.
Overall process used to register slabs acquired during two imaging sessions. All four transformations are computed with an intensity based registration algorithm with NMI as the similarity measure. Transformations 1 and 3 (T1 and T3) use header information retrieved from the scanner for initialization. T2 is computed on the gradient magnitude image of the low-resolution whole head scan. T4 is a simple rigid body transformation as the combination of T1, T2 and T3 is sufficient to bring the images within the capture range of the intensity-based registration.
3.6. Evaluation of accuracy
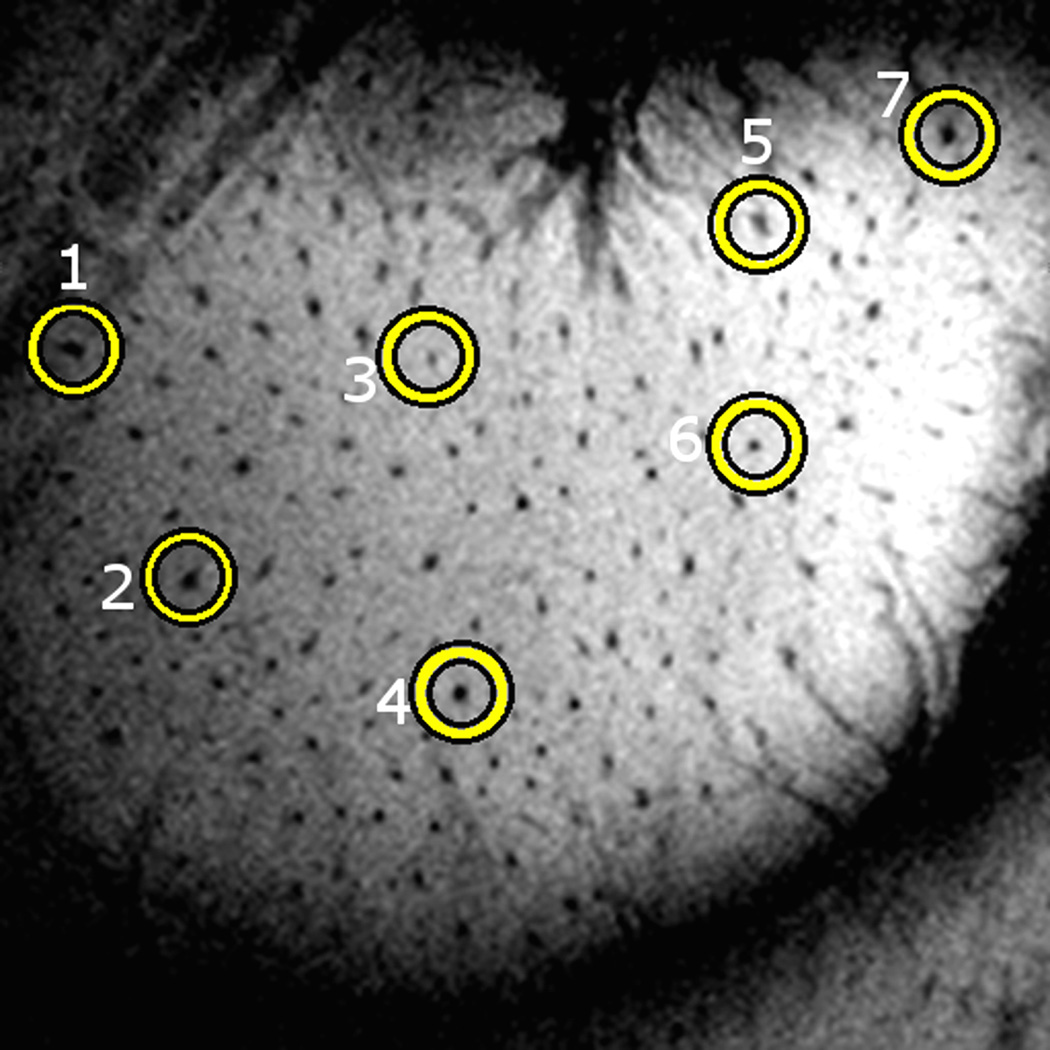
Assessing the accuracy of automatic registration algorithms is a difficult task. When a ground truth transformation is known, the estimated transformation can be compared to it. In this study, a validation procedure based on visible landmarks was used because there is no known ground truth. The small dark points visible in the image shown on Fig. 7 are trans-cortical vessels. Because these vessels have high conspicuity, are focal and are typically seen throughout the entire image, they form a good set of landmark points to evaluate our approach. The procedure that was used to create the set of landmarks for each monkey is as follows. First, vessel cross-sections were manually defined by the first author on all the slices of the second slab. Next, 50 of these cross-sections were randomly selected and circles were placed around these selected cross sections. Fig. 7 shows one slice on which selected cross-sections have been encircled.
Fig. 7.
Example of a printout used for the selection of vessels’ center.
Finally, the same cross sections were localized by the first author in the volume obtained after registering slab 1 to slab 2 and circles were placed around the selected cross sections, using anatomical landmarks such as sulcal boundaries, large veins, etc. to confirm the correspondence of individual vessel cross-sections. For each monkey, this resulted in pairs of images in which 50 homologous cross-sections were labeled. Two raters were then asked to localize the center of the selected cross-sections. These raters were provided with a printout of each slice of each volume on which cross-sections were selected and they picked the center of these cross-sections using a visualization tool, developed in house, that allow them to see the same slice as the annotated printout. To evaluate intra-rater variability, these two raters were asked to repeat the experiment at a 4-week interval. We used the distance between the centers of two homologous cross-sections as our error measure. The intra-rater variability is defined as the distance between the centers of the same cross-section selected by a rater the first and the second time. The inter-rater variability is defined as the distance between the center of the same cross-section selected by rater 1 and rater 2.
4. Results
4.1. Direct slab-to-slab registration
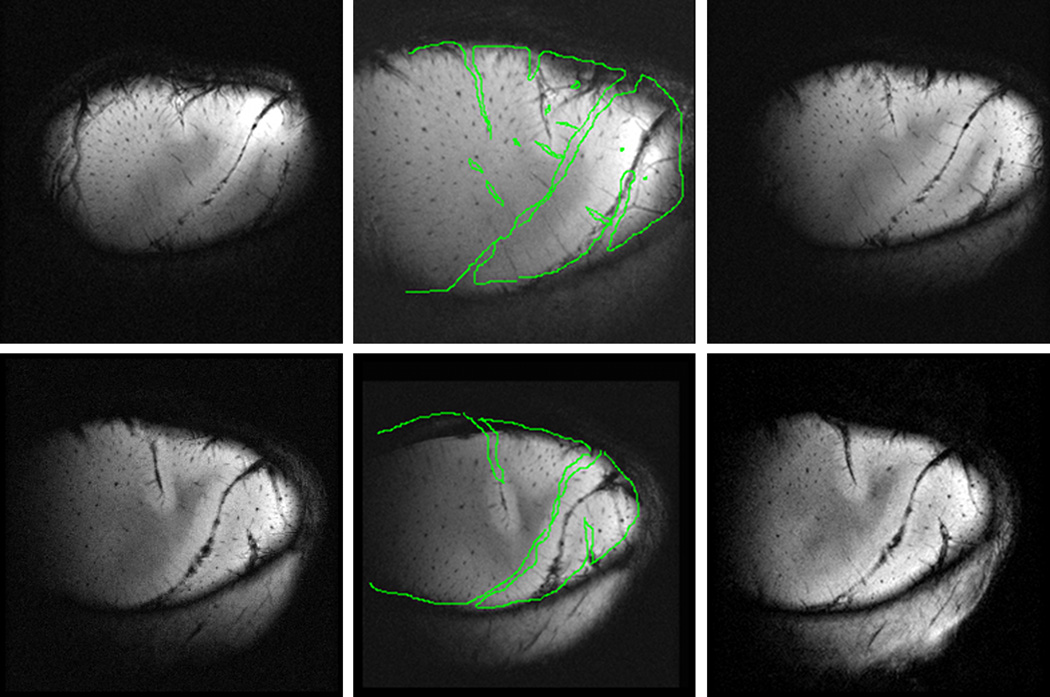
Fig. 8 shows, for two different monkeys, results obtained when attempting to register directly slabs acquired during two different sessions. Each row in this figure shows one slice in the first slab on the left panel and the corresponding slice in the second slab on the right panel. The middle panel shows the same slice in the volume obtained after registering the first slab to the second one. As can be seen, differences in the position of the slab during acquisition led to substantial differences between the images. In particular, some sulci can be seen in one image and different sulci in the other image. Because sulci are strong features in these images, the lack of correspondence between these makes the registration difficult. As shown in Fig. 8, on the middle image of the top row, the registration is misled by the incorrect correspondence of two different sulci. This incorrect correspondence is driving the whole registration process to the wrong solution.
Fig. 8.
Direct slab-to-slab registration is not accurate. Rows show examples of poor slab registration for two different monkeys. Left panels: slice from first slab. Right panels: corresponding slice of second slab. Middle panels: first slab registered to second slab. Lines in the middle panel are the contours of the second slab projected onto the registered first slab. Top row: registration error is ~75 voxels. Bottom: registration error is ~35 voxels.
Using two images registered with the method described in this article, we investigated the capture range of the AMIR algorithm for high-resolution brain sub-volumes, to better understand the reason for its failure. Starting from these two registered images, we applied a transformation (rotation and/or translation) to one of them (image A) and used AMIR to try to register it to the other image (image B), hence producing a third image (image A′) which should be similar to image B. To evaluate the accuracy of this direct registration, we used a regularly spaced point grid on each image. This grid was the same for image A and B and was transformed with the matrix used to generate image A′ from image A. We then computed the distance between each of these points in A′ and their homologous point in A and used the mean distance as a decision criterion. If this mean distance was smaller than 50 µm, the registration was considered a success and a failure otherwise. This experiment was repeated 10,000 times on the five sets of monkey images for different rotation angles, rotation axes, translation distances and translation directions. We chose a range of ±5° for rotation and ±2 mm for translation as they are the ranges of rotation and translation offsets typically observed between imaging sessions. In this experiment, X is the phase encoding direction, Y is the read out direction and Z is the stacking direction of slices.
Table 1 shows the results of this experiment for rotation angles randomly chosen in the ±5° range: rotations about the X or Y axis leads to a mis-registration while rotations about Z-axis are not a problem.
Table 1.
Success rate of direct slab to slab registration for different rotations in the ±5° range.
| Rotation axes | x | y | z | xy | xz | yz | xyz |
|---|---|---|---|---|---|---|---|
| Success rate | 0.44 | 0.42 | 0.95 | 0.38 | 0.36 | 0.35 | 0.28 |
Table 2 shows the results of this experiment for translation distances randomly chosen in the ±2 mm range: translation along the Z axis leads to mis-registration whereas translations along X or Y axes are handled quite easily.
Table 2.
Success rate of direct slab to slab registration for different translations in the ±2 mm range.
| Translation axes | x | y | z | xy | xz | yz | xyz |
|---|---|---|---|---|---|---|---|
| Success rate | 0.97 | 0.96 | 0.54 | 0.95 | 0.48 | 0.47 | 0.46 |
Although testing for rotations and translations provide a good idea of the capture range, in usual conditions of acquisitions, rotations and translations occur together. In order to test the capture range in a realistic manner, we also combined 3 rotations (in the ±5° range) and 3 translations (in the ±2 mm range) to image A, again 10,000 times and using the same success criterion. In these usual conditions of acquisitions, the direct slab to slab registration is unlikely to succeed, as the success rate is only 0.17. The capture range of AMIR for such images is not sufficient to permit a direct slab to slab registration. This very small capture range is due to the highly non-isotropic nature of the image voxels combined with an imperfect overlap of the data.
4.2. Slab-to-low-resolution whole-head registration
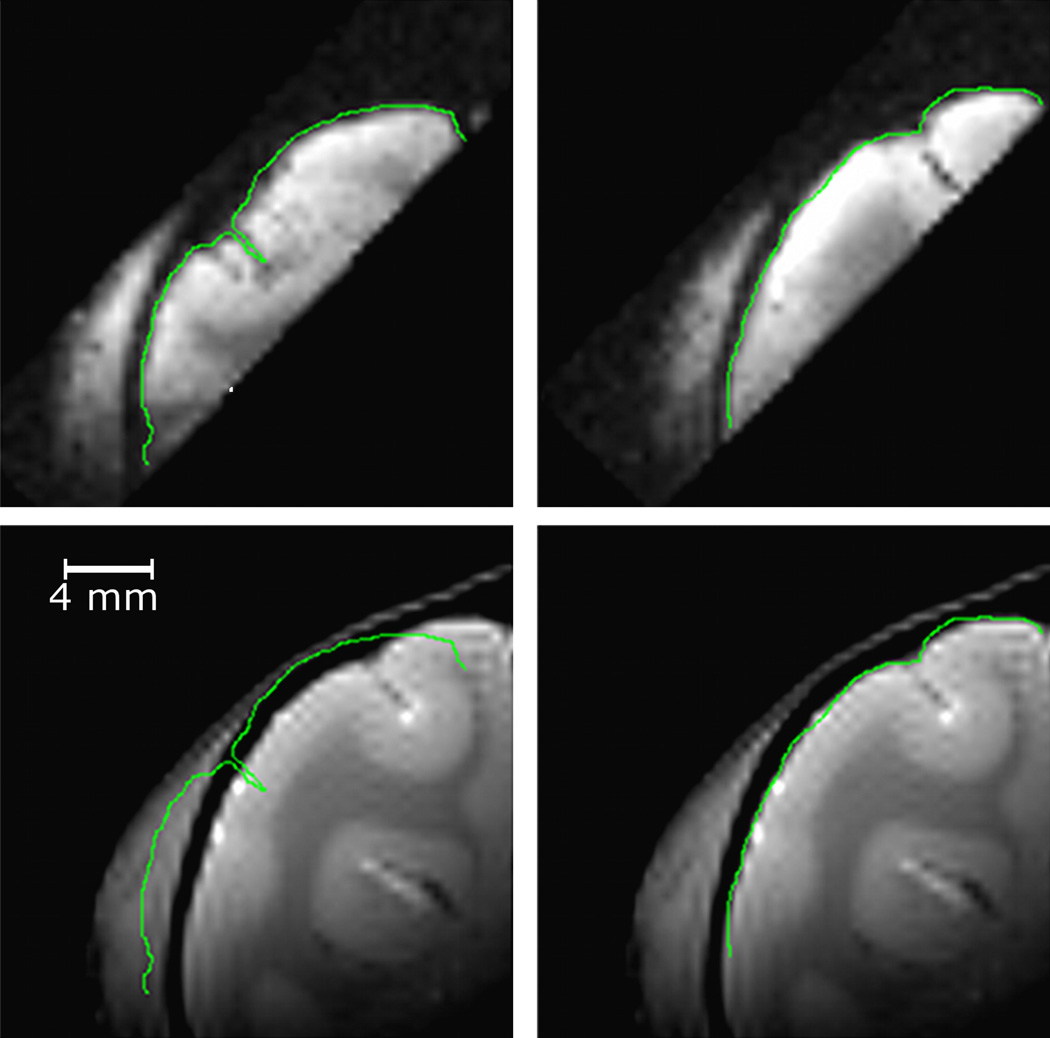
A representative example of slab-to-low-resolution whole-head registration using only information derived from the image headers is shown in the left panels of Fig. 9. Although the global orientation and position of the slab is correct, the sulci and the surface of the cortex are misplaced. However, because the transformation computed with the header information is close to the correct transformation, an additional intensity-based registration permits the accurate registration of the slab with its corresponding partial head volume. Results obtained after this step are shown on the right panels of Fig. 9.
Fig. 9.
Registration of a slab with its corresponding partial head image. Left column with scanner-derived information only and right column after an additional intensity-based step. The top row shows the slab image, the bottom row the partial head image. Contours have been drawn on the top images and copied on the bottom ones.
4.3. Low-resolution whole-head scans coregistration
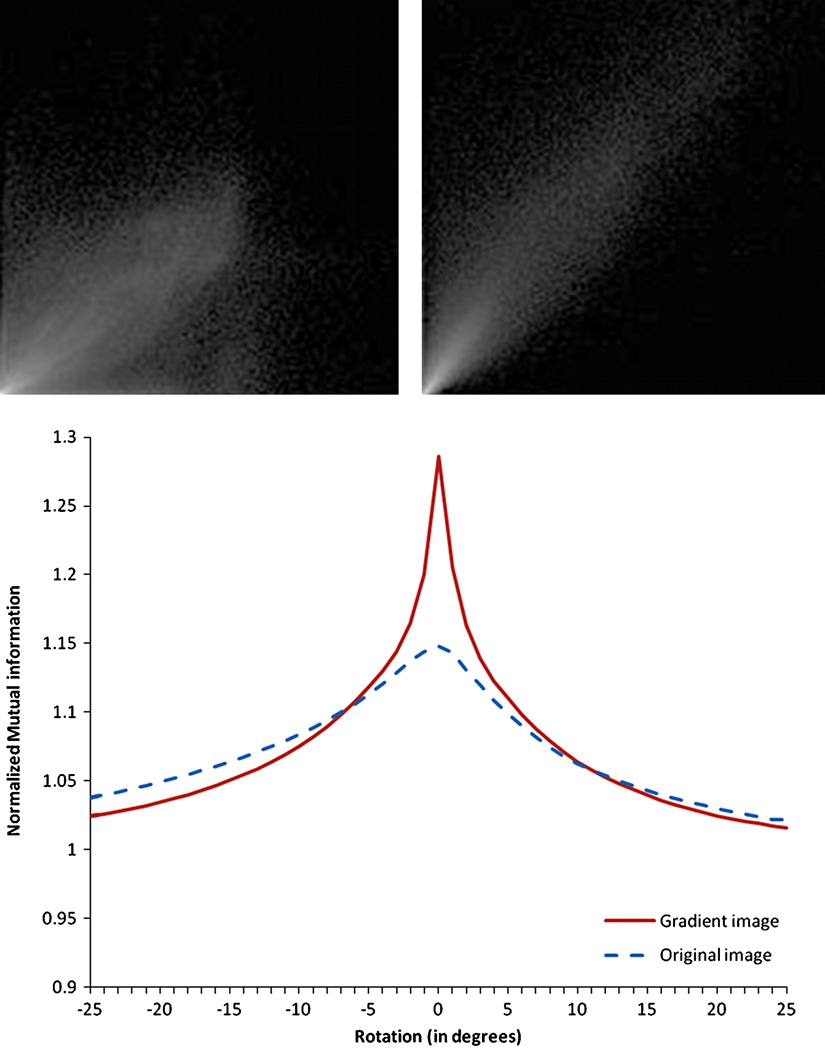
The NMI can be viewed as a measure of the spread of the joint intensity histograms. The top panels of Fig. 10 show the joint intensity histogram of the original images (left panel) and of the gradient magnitude images (right panel) when the images are registered. These figures show that the joint histogram of the original image is more diffuse than that of the gradient magnitude image. This, in turn, suggests that the NMI will be less sensitive to misalignment in the parent images than the Sobel-filtered gradient magnitude images. The bottom panel confirms this. It shows the value of the NMI as a function of misalignment for the original images (dotted lines) and the gradient magnitude images (solid lines). For illustration purposes, a simple rotation around one axis is used to produce the misalignment. It is clear from this figure that the NMI has a peak that is much more pronounced at registration for the gradient magnitude images than for the original images. This facilitates the convergence to a local maximum, and explains why we have obtained better results with the gradient images than with the original images.
Fig. 10.
Left: Normalized joint histogram of low-resolution whole-head images after registration computed with gradient images. Right: Normalized joint histogram of the gradient images. Bottom: NMI of gradient images and original images versus rotation. The joint histogram of the gradient image spreads less than the other one, showing a better correspondence of the voxels intensities. The NMI function of the gradient image is sharper and allows a better registration.
4.4. Final refinement
Fig. 11 shows the effect of the last slab-to-slab intensity-based registration algorithm. The panel on the left (Fig. 11A) is one slice in the reference slab (slab 2). The middle panel (Fig. 11B) is the corresponding slice in the volume obtained by registering slab 1 to slab 2 after step 3 (see Fig. 6). The right panel (Fig. 11C) is the corresponding slice in the volume obtained after the final registration step. After step 3, a registration error on the order of 3 voxels (~200 µm) can be observed but, after step 4, visual inspection suggests that registration accuracy is substantially better.
Fig. 11.
Effect of the final AMIR step. (A) Reference slab (slab 2) with vessels (typical diameter ~100 µm) highlighted. (B) Slab 1 registered to slab 2 with contours of slab 2’s vessels projected onto it before step 4. (C) Slab 1 registered to slab 2 after step 4.
4.5. Quantitative evaluation of the complete process
Table 3 summarizes the registration errors as well as the inter-and intra-rater variability for the 5 data sets included in this study. The average registration error was 30.3 ± 16.3 µm (0.443 voxels). Mean intra- and inter-rater variabilities were both ~28 ± 15 µm.
Table 3.
Registration error and inter- and intra-rater variability. All measures are expressed in µm.
| Registration error | Localization error of rater 1 | Localization error of rater 2 | Inter-rater localization error | |||||||||||||
|---|---|---|---|---|---|---|---|---|---|---|---|---|---|---|---|---|
| Mean | SD | Max | Med | Mean | SD | Max | Med | Mean | SD | Max | Med | Mean | SD | Max | Med | |
| Monkey 1 | 29.94 | 14.49 | 59.06 | 27.89 | 27.41 | 14.49 | 62.48 | 25.84 | 28.98 | 15.04 | 60.16 | 25.70 | 27.69 | 14.77 | 72.32 | 25.16 |
| Monkey 2 | 30.90 | 18.25 | 67.88 | 28.23 | 28.92 | 15.38 | 69.45 | 25.22 | 27.55 | 12.17 | 53.84 | 24.75 | 29.46 | 15.04 | 66.92 | 29.26 |
| Monkey 3 | 30.28 | 17.29 | 57.08 | 27.07 | 28.57 | 11.55 | 50.31 | 27.14 | 29.19 | 14.63 | 54.76 | 26.25 | 29.05 | 15.38 | 73.42 | 27.68 |
| Monkey 4 | 30.49 | 16.20 | 55.51 | 26.25 | 27.48 | 12.71 | 62.96 | 27.48 | 27.69 | 14.01 | 60.50 | 25.50 | 28.16 | 14.83 | 60.63 | 26.25 |
| Monkey 5 | 29.74 | 15.11 | 57.76 | 27.28 | 28.23 | 14.15 | 57.83 | 26.04 | 28.44 | 14.49 | 54.28 | 26.45 | 28.92 | 14.97 | 63.30 | 28.57 |
| Overall | 30.28 | 16.27 | 67.88 | 27.41 | 28.10 | 13.67 | 69.45 | 26.11 | 28.37 | 14.08 | 60.50 | 25.57 | 28.64 | 14.97 | 73.42 | 26.93 |
For each case, mean, standard deviation (SD), maximum and median (Med) are given.
For each case, mean, standard deviation (SD), maximum and median (Med) are given.
5. Discussion
To the best of our knowledge, this is the first automatic registration method proposed for the longitudinal registration of small brain sub-volumes, especially at a spatial resolution of ≤100 µm. A preliminary analysis of the problem indicated that a simple slab-to-slab approach does not work because of the limited capture range which does not accommodate the range of rotations and translation offsets between slabs acquired in different sessions. We therefore developed and implemented the modified acquisition and coregistration pipeline that provides highly accurate session to session coregistration of brain sub-volumes.
A low-resolution whole-head volume could be acquired with the same surface coil used for the acquisition of the slab. Using a volume head coil to acquire the whole head volumes would greatly reduce the intensity and tissue contrast variations, reducing the challenges of coregistration. However spatial inhomogeneities in the transmit and receive modes increase with increasing B0 field strength, and a goal of the present study was an automated coregistration approach that would remain robust in the face of even severe inhomogeneities. For this reason, we have used a surface coil transceiver for all imaging, to specifically challenge this aspect of the pipeline’s performance. As expected, severe intensity attenuation artefacts in these images proved to be a challenging confound for their direct registration. Furthermore, incorporation of intensity correction algorithms developed for human images acquired at lower field strength did not produce convincing results. In contrast, we found that registering gradient magnitude images, which exhibit less fall-off in intensity with distance from the transceiver coil, was an effective strategy. We note that a number of edge operators that may be better than the simple Sobel operator under noisy conditions have been proposed, including, for example, Deriche (1987) or Shen-Castan filter (Shen and Castan, 1986), and Difference of Gaussians (Marr and Hildreth, 1980). However, the results we have obtained show that the choice of operator is not critical. Finally, scanner imperfection and differences in spatial resolution between the slabs and the low-resolution whole-head images required several final small adjustments following which we achieved an overall registration accuracy of 30.3 ± 16.3 µm (~0.4 voxels).
The slab to low resolution whole head scan registration step is similar to the slice-to-volume or stack-to-volume registration problems found in cardiac MRI (Chandler et al., 2006) or MR fetal motion correction (Gholipour et al., 2010; Kim et al., 2010). In our case, there is an additional challenge: the resolution of the slab and the whole head images is very different. Furthermore, in the cardiac and fetal imaging studies, several slices are commonly used to reconstruct a volume, while in the present study we use the volume as an intermediate step to register two slabs. Ultrasound stitching faces a similar partial overlap problem as the one being addressed here (Gooding et al., 2010). However the method used by Gooding and colleagues is not fully automated and relies on a first manual approximation of the correct alignment. In designing our coregistration tool, we sought a completely automated approach to avoid the problem of reproducibility associated with human intervention.
Registration of the somatosensory cortex has been performed previously in humans and rats, but these have generally relied on full head 3D MRI scans. No studies so far have developed an automatic method with a focus on coregistration of high resolution partial brain volumes. For example, Schweizer et al. (2008) used the FSL registration tool (Jenkinson and Smith, 2001) with rigid body transformation and sinc interpolation with good results in humans, but on our slabs, this led to unsatisfactory results. Others, e.g. Sydekum et al. (2009) sought to coregister functional maps using the native functional Echo Planar Images (EPI) to compute the registration. We suspect that the registration of functional EPI should be performed using the transformation computed for anatomical images acquired during the same session as the EPI. Indeed, the anatomical images have a higher resolution; hence, structures and textures are sharper and allow a better registration. Moreover, the anatomical images are not subject to distortions which can arise as a result of static magnetic field inhomogeneities and the low pixel bandwidth of EPI images.
Assessing the accuracy of registration methods requires a ground truth or surrogate thereof. For rigid body transformations used in this work, this typically means being able to localize homologous points in the images and computing the distance between these points after registration. The distance between these points after registration is our error measure. Even if the transformation computed to register the images was perfect, this distance would typically not be zero because homologous points cannot be localized with infinite precision. The error made while localizing the homologous points is referred to as the target localization error (TLE) (Maurer et al., 1977). Ideal points used to assess registration errors are thus points that can be localized easily and accurately. Our results have shown that the trans-cortical vessels visible in the images are good target candidates that can be localized with subvoxel accuracy. However, these are not perfect. Indeed, vessels are tubular structures and not points. Using the center of their cross-sections is thus ambiguous. It is possible to conceive a scenario in which our approach would not be able to detect a registration error. Indeed, if all vessels were perfectly perpendicular to the imaging plane, we could not detect a translation error perpendicular to this plane. However, this scenario is highly unlikely because the vessels are not all oriented in the same direction. Even if one vessel was perpendicular to the imaging plane, a translational error would result in a target registration error for the other vessel cross-sections. Our results indicate that the registration accuracy we have achieved is as good as we can measure it, i.e., the registration error is on the order of the target localization error.
6. Conclusions
This study describes and characterizes the performance of an acquisition and processing pipeline for fully automatic registration of longitudinal high resolution MRI brain sub-volumes. The method has been applied successfully for retrospective coregistration across sessions.
In principle, this approach can be extended to allow coregistration of high resolution fMRI images. However, functional images are generally more prone to geometric distortion and additional non-rigid registration approaches will need to be incorporated.
The ultimate objective of the work is to assess brain plasticity. To that end, fMRI images acquired in the same orientation as the slabs and covering the same space will need to be registered to each other. Geometric distortions present in EPI will need to be taken into account in the process.
Finally, we note that the approach described generalizes across scales and should be applicable for highly accurate inter-session coregistration in high resolution imaging studies of human brain anatomy. The method makes no assumptions about monkey-specific features and should transfer easily to other species. In high field MR imaging, such as 7 T for humans, the acquisition time becomes prohibitive for a whole head MRI scan. Multi-slice sub-volumes acquisition of the region of interest is a good way to acquire very high resolution data in a convenient time, and with the help of the method described in this article, accurate registration of such slabs is achievable.
Acknowledgements
This work was supported by NIH Grant R01DA028303 from the National Institute on Drug Abuse. The content is solely the responsibility of the authors and does not necessarily represent the official views of these institutions.
References
- Ashburner J, Friston K. MRI sensitivity correction and tissue classification. Neuroimage. 1998;7(4):S107. [Google Scholar]
- Baker J, Patel G, Corbetta M, Snyder L. Distribution of activity across the monkey cerebral cortical surface, thalamus and midbrain during rapid, visually guided saccades. Cereb Cortex. 2006;16(4):447–459. doi: 10.1093/cercor/bhi124. [DOI] [PubMed] [Google Scholar]
- Brodmann K. Vergleichende Lokalisationslehre der Grosshirnrinde in ihren Prinzipien dargestellt auf Grund des Zellenbaues. Johann Ambrosius Barth. 1909 [Google Scholar]
- Chandler A, Pinder R, Netsch T, Schnabel J, Hawkes D, Hill D, et al. Correction of misaligned slices in multi-slice MR cardiac examinations by using slice-to-volume registration; International symposium of biomedical imaging: nano to macro; 2006. pp. 474–477. [Google Scholar]
- Collignon A, Maes F, Delaere D, Vandermeulen D, Suetens P, Marchal G. Automated multimodality image registration based on information theory. Inf Process Med Imaging. 1995;26:273–274. [Google Scholar]
- Dawant B, Zijdenbos A, Margolin R. Correction of intensity variations in MR images for computer-aided tissues classification. IEEE Trans Med Imaging. 1993;12(4):770–781. doi: 10.1109/42.251128. [DOI] [PubMed] [Google Scholar]
- Deriche R. Using Canny’s criteria to derive a recursively implemented optimal edge detector. Int J Comput Vis. 1987;1:167–187. [Google Scholar]
- Fitzpatrick JM, West J. A blinded evaluation and comparison of image registration methods. Empirical Evaluation Techniques in Computer Vision. 1998:12–27. [Google Scholar]
- Gholipour A, Estroff J, Warfield S. Robust super-resolution volume reconstruction from slice acquisitions: application to fetal brain MRI. IEEE Trans Med Imaging. 2010;29:1739–1758. doi: 10.1109/TMI.2010.2051680. [DOI] [PMC free article] [PubMed] [Google Scholar]
- Gooding MJ, Rajpoot K, Mitchell S, Chamberlain P, Kennedy SH, Noble JA. Investigation into the fusion of multiple 4-D fetal echocardiography images to improve image quality. Ultrasound Med Biol. 2010;36:957–966. doi: 10.1016/j.ultrasmedbio.2010.03.017. [DOI] [PubMed] [Google Scholar]
- Ibanez L, Schroeder W, Ng L, Cates J. The ITK software guide. 2003 http://www.itk.org/ItkSoftwareGuide.pdf. [Google Scholar]
- Jenkinson M, Smith S. A global optimization method for robust for robust affine registration of brain images. Med Image Anal. 2001;5(2):143–156. doi: 10.1016/s1361-8415(01)00036-6. [DOI] [PubMed] [Google Scholar]
- Kim K, Habas P, Rousseau F, Glenn O, Barkovich A, Studholme C. Intersection based motion correction of multislice MRI for 3-D in utero fetal brain image formation. IEEE Trans Med Imaging. 2010;29:146–158. doi: 10.1109/TMI.2009.2030679. [DOI] [PMC free article] [PubMed] [Google Scholar]
- Liu J, Tian J, Dai Y. Multi-modal medical image registration based on adaptive combination of intensity and gradient field mutual information; EMBS annual international conference; 2006. pp. 1429–1432. [DOI] [PubMed] [Google Scholar]
- Marr D, Hildreth E. Theory of edge detection. Proc Biol Sci. 1980;207:187–217. doi: 10.1098/rspb.1980.0020. [DOI] [PubMed] [Google Scholar]
- Maurer C, Fitzpatrick JM, Wang M, Galloway R, Maciunas R, Allen G. Registration of head volume images using implantable fiducial markers. IEEE Trans Med Imaging. 1977;16(4):447–462. doi: 10.1109/42.611354. [DOI] [PubMed] [Google Scholar]
- Penfield W, Rasmussen T. The cerebral cortex of man: a clinical study of localization of function. New York: Macmillan; 1950. Secondary sensory and motor representation. [Google Scholar]
- Pluim JP, Maintz JBA, Viergever MA. Image registration by maximization of combined mutual information and gradient information. IEEE Trans Med Imaging. 2000;19:809–814. doi: 10.1109/42.876307. [DOI] [PubMed] [Google Scholar]
- Pluim JP, Maintz JBA, Viergever MA. Mutual-information-based registration of medical images: a survey. IEEE Trans Med Imaging. 2003;22:986–1004. doi: 10.1109/TMI.2003.815867. [DOI] [PubMed] [Google Scholar]
- Schweizer R, Voit D, Frahm J. Finger representations in human primary somatosensory cortex as revealed by high-resolution functional MRI of tactile stimulation. Neuroimage. 2008;42(1):28–35. doi: 10.1016/j.neuroimage.2008.04.184. [DOI] [PubMed] [Google Scholar]
- Shams R, Kennedy RA, Sadeghi P, Hartley R. Gradient intensity-based registration of multi-modal images of the brain; International conference of computer vision; 2007. pp. 1–8. [Google Scholar]
- Shannon CE. A mathematical theory of communication. Bell System Technical Journal. 1948;27:379–423. 623–656. [Google Scholar]
- Shattuck D, Sandor-Leahy S, Schaper K, Rottenberg D, Leahy R. Magnetic resonance image tissue classification using a partial volume model. Neuroimage. 2001;13(5):856–876. doi: 10.1006/nimg.2000.0730. [DOI] [PubMed] [Google Scholar]
- Shen J, Castan S. An optimal linear operator for edge detection; International conference of vision and pattern recognition; 1986. pp. 109–114. [Google Scholar]
- Sled J, Zijdenbos A, Evans A. A nonparametric method for automatic correction of intensity nonuniformity in MRI data. IEEE Trans Med Imaging. 1998;17(1):87–97. doi: 10.1109/42.668698. [DOI] [PubMed] [Google Scholar]
- Sobel I. An isotropic 3 × 3 × 3 volume gradient operator. Hewlett-Packard Laboratory, Tech. Rep. 1995 [Google Scholar]
- Studholme C, Hill D, Hawkes D. An overlap invariant entropy measure of 3D medical image alignment. Pattern Recognit. 1999;32:71–86. [Google Scholar]
- Sydekum E, Baltes C, Ghosh A, Mueggler T, Schwab M, Rudin M. Functional reorganization in rat somatosensory cortex assessed by fMRI: Elastic image registration based on structural landmarks in fMRI images and application to spinal cord injured rats. Neuroimage. 2009;44(4):1345–1354. doi: 10.1016/j.neuroimage.2008.10.015. [DOI] [PubMed] [Google Scholar]
- Van Leemput K, Maes F, Vandermeulen D, Suetens P. Automated model-based tissue classification of MR images of the brain. IEEE Trans Med Imaging. 1999;18(10):897–908. doi: 10.1109/42.811270. [DOI] [PubMed] [Google Scholar]
- Viola P, Wells W., III Alignment by maximization of mutual information; International conference of computer vision; 1995. pp. 16–23. [Google Scholar]


