

Abstract
BACKGROUND
Failure of remission-induction therapy is a rare but highly adverse event in children and adolescents with acute lymphoblastic leukemia (ALL).
METHODS
We identified induction failure, defined by the persistence of leukemic blasts in blood, bone marrow, or any extramedullary site after 4 to 6 weeks of remission-induction therapy, in 1041 of 44,017 patients (2.4%) 0 to 18 years of age with newly diagnosed ALL who were treated by a total of 14 cooperative study groups between 1985 and 2000. We analyzed the relationships among disease characteristics, treatments administered, and outcomes in these patients.
RESULTS
Patients with induction failure frequently presented with high-risk features, including older age, high leukocyte count, leukemia with a T-cell phenotype, the Philadelphia chromosome, and 11q23 rearrangement. With a median follow-up period of 8.3 years (range, 1.5 to 22.1), the 10-year survival rate (±SE) was estimated at only 32±1%. An age of 10 years or older, T-cell leukemia, the presence of an 11q23 rearrangement, and 25% or more blasts in the bone marrow at the end of induction therapy were associated with a particularly poor outcome. High hyperdiploidy (a modal chromosome number >50) and an age of 1 to 5 years were associated with a favorable outcome in patients with precursor B-cell leukemia. Allogeneic stem-cell transplantation from matched, related donors was associated with improved outcomes in T-cell leukemia. Children younger than 6 years of age with precursor B-cell leukemia and no adverse genetic features had a 10-year survival rate of 72±5% when treated with chemotherapy only.
CONCLUSIONS
Pediatric ALL with induction failure is highly heterogeneous. Patients who have T-cell leukemia appear to have a better outcome with allogeneic stem-cell transplantation than with chemotherapy, whereas patients who have precursor B-cell leukemia without other adverse features appear to have a better outcome with chemotherapy. (Funded by Deutsche Krebshilfe and others.)
Current treatment for acute lymphoblastic leukemia (ALL) can effect a cure in approximately 80% of children with the disease.1-9 The leading cause of treatment failure is relapse, for which a number of risk factors have been identified, with inadequate therapy being one of the most important.10-19 A small but significant percentage of patients do not have a complete remission after 4 to 6 weeks of induction chemotherapy.20-23 Among patients with initial induction failure, some never have a complete remission and most others have early relapse. Because of the rarity of induction failure, affected patients have been collectively considered to be a very-high-risk patient subgroup and are offered allogeneic hematopoietic stem-cell transplantation as the treatment of choice.24
Our intergroup collaboration has identified marked clinical heterogeneity in a number of high-risk pediatric ALL subtypes, including those characterized by the Philadelphia chromosome,25 an 11q23 chromosomal rearrangement,26 and hypodiploidy.27 We examined the outcomes in patients 0 to 18 years of age with ALL who had induction failure to identify distinct patient subgroups with different outcomes, related to disease characteristics and treatments administered.
METHODS
STUDY CONDUCT AND STUDY PATIENTS
We performed a retrospective analysis of data from 14 cooperative study groups (Table 1 in the Supplementary Appendix, available with the full text of this article at NEJM.org) in Europe, North America, and Asia. From January 1985 through December 2000, the study groups had enrolled in clinical trials a total of 44,017 children and adolescents with newly diagnosed ALL. The enrollment period was chosen to allow for sufficient follow-up. Each study group was asked to identify all patients who fulfilled the individual study group’s definition of induction failure during that period. Individual patient data were then collected to form a common database that included information on predefined clinical, biologic, and genetic characteristics, as well as data on treatments, early treatment responses, and survival outcomes. All data were reviewed for completeness and consistency. The median follow-up time for surviving patients was 8.3 years (range, 1.5 to 22.1); 80% of the patients without an event were followed for more than 5 years, and only 3% of the deaths occurred beyond 5 years. By general agreement, none of the participating groups are identified with their data sets in this report. All the clinical trials from which data were used in this analysis had previously received approval from the relevant institutional review boards or ethics committees, and written informed consent had been obtained from patients who were 18 years of age or from parents or guardians of patients who were younger than 18 years of age.
STUDY GROUP DEFINITIONS OF INDUCTION FAILURE
The response to induction therapy was evaluated between 28 and 43 days after treatment initiation. Induction failure occurred in 1041 patients (2.4%). The rate varied slightly among the study groups, ranging from 1.4% to 4.9%, since the duration and the intensity of induction therapy, as well as the definition of induction failure, differed among the study groups (Table 1 in the Supplementary Appendix).
The most commonly used definition of induction failure was the persistence of leukemic blasts in the bone marrow (M2 marrow, defined as marrow with 5 to 24% blasts, or M3 marrow, defined as marrow with ≥25% blasts, as compared with M1 marrow, defined as marrow with <5% blasts [generally considered to reflect remission]) or leukemic blasts found at an extramedullary site at the end of induction therapy (Table 2 in the Supplementary Appendix).
The Children’s Cancer Group (CCG), the Children’s Cancer and Leukaemia Group (CCLG), and the Pediatric Oncology Group (POG) used a more stringent definition of induction failure: M3 marrow at 28 or 29 days after treatment initiation or M2 or M3 marrow after extended induction therapy, at 43 days. For a better comparison with data from the other study groups, data from patients with M2 marrow at 28 or 29 days were obtained from the CCG and CCLG; however, these data were not available from the POG.
Finally, for a diagnosis of complete remission to be made, some study groups required not only an M1 marrow (i.e., marrow with <5% blasts) but also unequivocal signs of regeneration in the bone marrow. Other study groups even required normal cellular bone marrow with trilineage hematopoiesis.
TREATMENT AFTER INDUCTION FAILURE
Treatment strategies for patients with induction failure differed among the study groups (Table 3 in the Supplementary Appendix). Seven study groups assigned these patients to the highest-risk treatment group, whereas other study groups enrolled such patients in an alternative trial of leukemia therapy or treated them with individualized therapy. Although the indications for allogeneic transplantation during the first period of complete remission varied among the study groups, induction failure was a consensus indication for allogeneic transplantation. HLA-matched, related-donor transplantation was generally the preferred method among various alternatives to chemotherapy alone. The lack of information on the availability of donors precluded us from determining whether all patients with a suitable donor underwent allogeneic transplantation. In a few cases, an autologous transplantation was performed according to institutional guidelines.
STATISTICAL ANALYSIS
Differences in the distribution of individual features among subgroups of patients were analyzed by means of the chi-square test for categorical variables and the Mann–Whitney U test for continuous variables. Because the definition of complete remission, the time of evaluation, and the therapeutic strategies used after induction failure differed among the study groups and were changed over time by some study groups, data on the final status with respect to complete remission were not uniformly available. Thus, the statistical analysis of treatment results was based on survival instead of event-free survival. Survival was defined as the time from diagnosis to death from any cause or to the last follow-up assessment. Data for patients who were lost to follow-up were censored at the time of the last contact. The Kaplan–Meier method28 was used to estimate survival rates, with standard errors calculated according to Greenwood’s method. Differences were compared with the use of a two-sided log-rank test.29 The Mantel–Byar test was used to compare survival between patients who underwent transplantation and those who were treated with chemotherapy. Only data from patients who survived at least 6 months (the median time to transplantation) are included in the figures. The Cox proportional-hazards model was used for multivariate analyses of prognostic factors.30 Estimated hazard ratios were reported as relative risks with 95% confidence intervals.
Stepwise regression was used to select the features with the highest prognostic value within the following three subgroups: patients with T-cell lineage leukemia, those with precursor B-cell leukemia without the mixed-lineage leukemia gene (MLL) rearrangement, and all patients with cytogenetic data. Factors that were significant at a level of 5% or less were then included in a final model together with the bone marrow status at the end of induction (M3 vs. other) and occurrence of allogeneic stem-cell transplantation (yes or no). All tests were descriptive and explorative. For ease of interpretation, no alpha correction was performed.
Although 13% of the patients with induction failure were positive for a BCR-ABL1 rearrangement (Table 1), this subgroup was excluded from the outcome analysis to avoid misleading conclusions for current patients, because this study did not include any patients who had received a tyrosine kinase inhibitor, a therapy that has significantly improved the early outcome of patients with this genotype.31-34
Table 1.
Survival Rate of Patients with Remission-Induction Failure, According to Presenting Features.*
| Baseline Characteristic | Patients (N = 1041) no./total no. (%) |
10-Year Survival Rate % |
P Value |
|---|---|---|---|
| All patients | |||
| t(9;22)(BCR-ABL1) status | <0.001 | ||
| Positive | 110/815 (13) | 11±3 | |
| Negative | 705/815 (87) | 35±2 | |
| No data | 226/1041 | 32±3 | |
| t(9;22)(BCR-ABL1)–negative patients | |||
| Sex | 0.08 | ||
| Male | 427/705 (61) | 32±2 | |
| Female | 278/705 (39) | 39±3 | |
| Age at diagnosis | <0.001 | ||
| <1 yr | 44/705 (6) | 29±7 | |
| 1–5 yr | 236/705 (33) | 52±3 | |
| 6–9 yr | 150/705 (21) | 33±4 | |
| 10–13 yr | 169/705 (24) | 25±3 | |
| 14–18 yr | 106/705 (15) | 16±5 | |
| Leukocyte count at diagnosis | <0.001 | ||
| <20 (×109/liter) | 215/704 (31) | 42±4 | |
| 20 to 49 (×109/liter) | 77/704 (11) | 38±6 | |
| 50 to 99 (×109/liter) | 113/704 (16) | 43±5 | |
| 100 to 199 (×109/liter) | 99/704 (14) | 33±5 | |
| ≥200 (×109/liter) | 200/704 (28) | 23±3 | |
| Cell lineage | <0.001 | ||
| B-cell | 387/628 (62) | 41±3 | |
| T-cell | 241/628 (38) | 28±3 | |
| NCI criteria† | <0.001 | ||
| B-cell lineage | |||
| Standard risk | 166/593 (28) | 60±4 | |
| High risk | 189/593 (32) | 26±3 | |
| T-cell lineage | |||
| Standard risk | 50/593 (8) | 30±7 | |
| High risk | 188/593 (32) | 27±3 | |
| CNS leukemia | 0.23 | ||
| Yes | 44/684 (6) | 32±7 | |
| No | 640/684 (94) | 35±2 | |
| Karyotype‡ | <0.001 | ||
| Normal | 159/514 (31) | 36±4 | |
| 11q23/MLL | 50/514 (10) | 16±5 | |
| High hyperdiploidy | 55/514 (11) | 71±6 | |
| Other | 250/514 (49) | 30±3 | |
| Bone marrow status at end of induction§ | <0.001 | ||
| M1 | 22/620 (4) | 45±11 | |
| M2 | 282/620 (45) | 41±3 | |
| M3 | 316/620 (51) | 26±3 | |
| Complete remission according to protocol criteria¶ | <0.001 | ||
| Yes | 389/520 (75) | 48±3 | |
| No | 131/520 (25) | 14±3 | |
| Period of diagnosis | 0.04 | ||
| 1985–1988 | 44/705 (6) | 27±7 | |
| 1989–1992 | 172/705 (24) | 28±3 | |
| 1993–1996 | 237/705 (34) | 38±3 | |
| 1997–2000 | 252/705 (36) | 39±3 |
Plus–minus values are 10-year survival estimates ±SE. For all 1041 patients, the 10-year survival rate was 32±1%, the median age at diagnosis was 8.1 years, and the median leukocyte count at the time of diagnosis was 42×109 per liter. P values were calculated with the use of the log-rank test. CNS denotes central nervous system.
According to National Cancer Institute (NCI) criteria, standard-risk patients were 1 to 9 years of age with a leukocyte count of less than 50×109 per liter; all other patients were high-risk.
Cytogenetic or molecular genetic information was available for 624 patients — initially in 608 patients and after additional analysis in the other 16 patients; BCR-ABL1 was found in 14 of these 16 patients and rearrangement of the mixed-lineage leukemia gene (MLL) was found in 2. T-cell ALL was diagnosed in 7 of the patients with BCR-ABL1 and in 12 of the patients with MLL rearrangement. The 110 patients with positive t(9;22)(BCR-ABL1) status were excluded from the analysis. High hyperdiploidy was defined by a modal chromosomal number (the most frequent count of chromosomes in a given patient) above 50.
Bone marrow status at the end of induction was defined by the study groups (Table 2 in the Supplementary Appendix) as follows: M1, less than 5% blasts; M2, 5 to 24% blasts; and M3, 25% or more blasts. The Pediatric Oncology Group (POG) had data on patients with M3 bone marrow status only. Exclusion of the POG data resulted in a total of only 546 patients with data: 22 patients (4%) had M1 status, 282 patients (52%) had M2 status, and 242 patients (44%) had M3 status. Survival estimates remained unchanged. The small percentage of patients with M1 marrow (4%) were considered to have had induction failure despite this “remission” status because persisting leukemic blasts were found at the other sites: mediastinal mass in 7 patients; CNS, lymph nodes, liver, kidney, spleen, or parotid glands in 12 patients; and peripheral blood in 3 patients.
Most study groups checked the remission status of patients again at predefined times after the end of induction. Exceptions were the Children’s Cancer Group (CCG), the POG, and the St. Jude Children’s Research Hospital study group, which evaluated remission only at the end of induction. Patients in these three studies, as well as patients in other studies with missing data, are excluded here.
RESULTS
CHARACTERISTICS OF THE STUDY PATIENTS
The 10-year survival rate (±SE) was 32±1% for all patients with induction failure and 35±2% for patients who did not have the BCR-ABL1 rearrangement. As compared with an unselected pediatric population with ALL,35 our cohort of 1041 patients had a greater number of unfavorable presenting features, including male sex, age older than 6 years at the time of diagnosis (median, 8.1 years), high leukocyte counts (median, 42×109 per liter), T-cell leukemia, central nervous system (CNS) involvement, 11q23 chromosomal rearrangement, and t(9;22)(BCR-ABL1). In univariate analysis, these high-risk presenting features (except male sex and CNS involvement) were associated with a reduced rate of survival (Table 1).
Reflecting the wide heterogeneity of this cohort, some patients who were negative for t(9;22)(BCR-ABL1) actually had low-risk presenting features: a leukocyte count of less than 20×109 per liter in 31% of the patients, age of 1 to 5 years at diagnosis in 33%, and high hyperdiploidy (>50 chromosomes) in 11%. Patients with high-hyperdiploid ALL had the best outcome, with a 10-year survival rate of 71±6% (Fig. 1). Most patients with high-hyperdiploid ALL had an M1 or M2 marrow at the end of induction (31 patients) and an excellent survival rate (70±8%), and even those with M3 marrow (12 patients) had a survival rate of 50±14%; 12 patients without data for bone marrow status had a survival rate of 92±8%. The 10-year survival rate was also excellent (73±13%) for 11 of the 300 patients tested (4%) who carried the genetic aberration ETV6-RUNX1 (the fusion of the ETS variant 6 [ETV6] and Runt-related transcription factor 1 [RUNX1] genes); this prevalence is lower than the prevalence (21%) of an average population with ALL.35
Figure 1. Kaplan–Meier Analysis of Survival in the 624 Study Patients with Induction Failure Who Had Genetic Data, According to Genetic Abnormality.
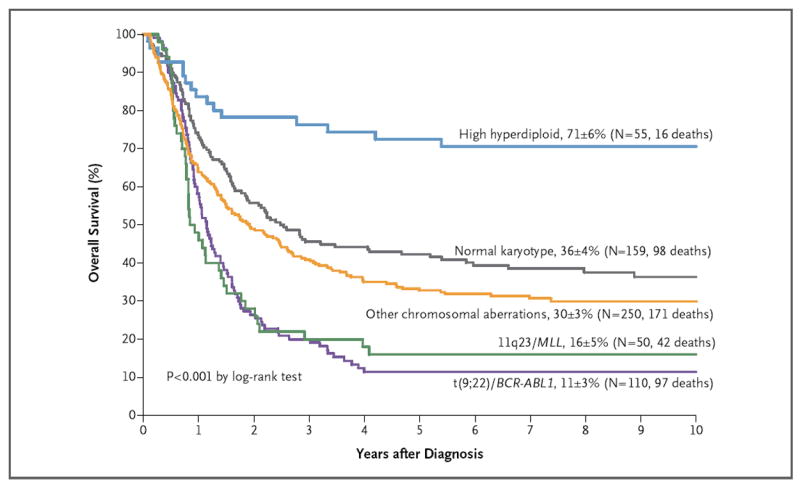
Ten-year survival estimates (±SE) are shown, along with the total numbers of patients with data and the total numbers of deaths. MLL denotes the mixed-lineage leukemia gene.
EARLY TREATMENT RESPONSE
Early response to initial chemotherapy was determined in peripheral blood or bone marrow at various time points according to the study guidelines (Table 4 in the Supplementary Appendix). Among 285 patients with data on the peripheral-blood blast count at 8 days (after 1 week of treatment with prednisone and one dose of intrathecal methotrexate), 57% had a blast count higher than 1×10⁹ per liter (indicating a poor response to prednisone), a percentage approximately five times that in an average population with ALL.35 M3 marrow was noted in 80% of the patients after 1 week of induction therapy and in 69% after 2 weeks. Remarkably, 12% of patients had M1 marrow 2 weeks after diagnosis, but they had not undergone complete remission by the end of the induction. Treatment response after 1 or 2 weeks of induction chemotherapy lacks prognostic value in patients with induction failure (Table 4 in the Supplementary Appendix).
DISEASE BURDEN AT THE END OF INDUCTION THERAPY
The rate of survival was lower among patients with M3 marrow at the end of induction therapy than among those with M1 marrow and extramedullary disease or M2 marrow (Table 1, and Fig. 1 in the Supplementary Appendix). Patient subgroups with the worst outcomes included patients 6 years of age or older with M3 marrow (10-year survival rate, 22±5%) (Fig. 1B in the Supplementary Appendix) and patients of any age with T-cell ALL and M3 marrow (10-year survival rate, 19±4%) (Fig. 2C and Table 5 in the Supplementary Appendix).
Figure 2. Estimates of Overall Survival in Patients with Induction Failure, According to Treatment.
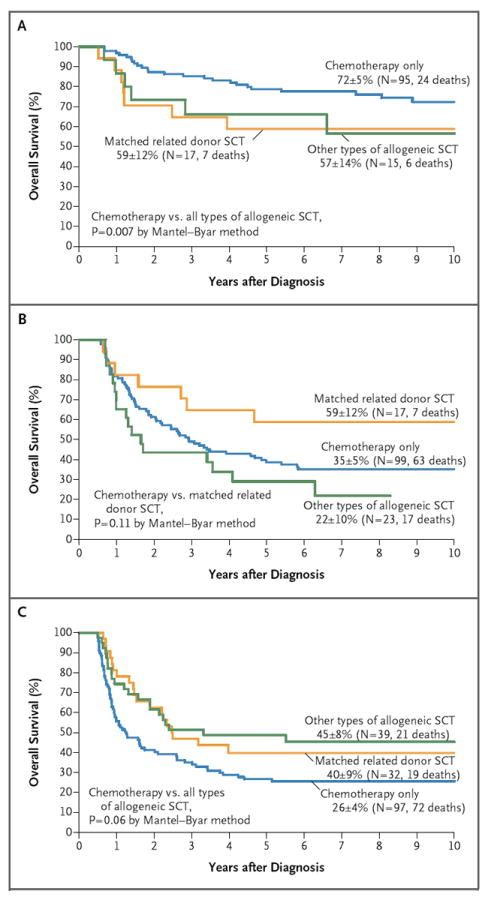
Ten-year survival estimates (±SE) are shown, along with the total numbers of patients with data and the total numbers of deaths. Only data from patients who survived at least 6 months are included. Overall survival is shown for patients with precursor B-cell leukemia (without a rearranged mixed-lineage leukemia gene [MLL]) who were younger than 6 years of age (Panel A) and who were 6 years of age or older (Panel B). Also shown is the overall survival among patients with T-cell leukemia (Panel C). SCT denotes stem-cell transplantation.
TREATMENT AFTER INDUCTION FAILURE
Data on whether a complete remission was achieved were available for 520 patients (Table 1). The 10-year survival rate was significantly higher among the 389 patients in whom a late remission was achieved than among the 131 patients who never had a remission according to protocol criteria (48±3% vs. 14±3%, P<0.001).
EFFECT OF TRANSPLANTATION ON SURVIVAL
A total of 198 patients underwent hematopoietic stem-cell transplantation, whereas 427 received chemotherapy only. The 10-year survival rate was 43±4% among patients who underwent transplantation, as compared with 41±3% among patients who did not undergo transplantation. Patients who received a transplant were further categorized according to whether the donor was an HLA-matched, related donor or any other type of donor (because all other donor types yielded results similar to one another) (Table 6 in the Supplementary Appendix). The effect of transplantation on the outcome differed across major prognostic subgroups of patients: in children younger than 6 years of age with precursor B-cell ALL (without MLL rearrangement), chemotherapy alone yielded significantly higher rates of survival than did transplantation (P = 0.007) (Fig. 2A). In patients 6 years of age or older with precursor B-cell ALL (without MLL rearrangement), receipt of a transplant from a matched, related donor appeared to improve the outcome, whereas other types of allogeneic transplantations resulted in worse outcomes (Fig. 2B), partly owing to transplantation-related death, which accounted for 6 of the 17 deaths in that group. Among patients with T-cell ALL, any type of transplantation, as compared with chemotherapy, yielded better, albeit not significantly better, rates of survival (Fig. 2C).
PROGNOSTIC FACTORS FOR SURVIVAL
In patients with precursor B-cell ALL without MLL rearrangement, the factors that were independently associated with a poor prognosis included a leukocyte count of 100×109 per liter or more, an age of 6 years or older or 10 years or older, and stem-cell transplantation from other than matched, related donors (Table 2). In T-cell ALL, male sex and M3 marrow at the end of induction therapy were adverse prognostic factors, and the use of any allogeneic stem-cell transplantation was associated with a favorable trend (hazard ratio for death, 0.7; 95% confidence interval, 0.5 to 1.0; P = 0.07).
Table 2.
Prognostic Factors for Survival, According to Hazard Ratio for Death.*
| Prognostic Factor† | No. of Patients | Hazard Ratio for Death (95% CI) | P Value |
|---|---|---|---|
| B-cell lineage, t(9;22)(BCR-ABL1)–negative patients‡ | |||
| M3 bone marrow at the end of induction | 97 | 0.9 (0.6–1.3) | 0.62 |
| Leukocyte count ≥100×109 per liter | 49 | 1.7 (1.1–2.5) | 0.01 |
| Age 6–9 yr | 56 | 2.4 (1.5–3.8) | 0.001 |
| Age ≥10 yr | 103 | 2.6 (1.8–4.0) | <0.001 |
| SCT with matched, related donor | 35 | 1.0 (0.6–1.8) | 0.97 |
| Other allogeneic SCT | 38 | 2.1 (1.3–3.5) | 0.003 |
| T-cell lineage, t(9;22)(BCR-ABL1)–negative patients§ | |||
| M3 bone marrow at the end of induction | 99 | 1.6 (1.1–2.2) | 0.01 |
| Male sex | 143 | 1.4 (1.0–2.0) | 0.05 |
| Any allogeneic SCT | 86 | 0.7 (0.5–1.0) | 0.07 |
| All patients with cytogenetic data¶ | |||
| M3 bone marrow at the end of induction | 163 | 1.5 (1.2–2.0) | 0.002 |
| MLL | 43 | 1.9 (1.2–2.8) | 0.004 |
| T-ALL | 165 | 1.6 (1.2–2.2) | 0.001 |
| Age ≥10 yr | 150 | 1.4 (1.0–1.8) | 0.03 |
| High hyperdiploidy | 51 | 0.7 (0.4–1.2) | 0.23 |
| SCT with matched, related donor | 61 | 0.8 (0.5–1.2) | 0.28 |
| Other allogeneic SCT | 43 | 1.3 (0.8–1.9) | 0.27 |
Only patients with information on whether they had undergone stem-cell transplantation (SCT) are included. MLL-positive patients are excluded because the MLL status was available for less than 46% of the patients. In the Cox regression, the following features were explored as possible prognostic factors in the model: age (<1 year, 6 to 9 years, and ≥10 years), leukocyte count (<20×109 per liter, >50×109 per liter, and ≥100×109 per liter), sex, involvement of the central nervous system or lymph nodes, enlargement of liver and spleen, presence of mediastinal mass, presence of cytogenetic aberrations (MLL rearrangement, high hyperdiploidy with modal chromosomal number of 50 or more), treatment period (years during which patients were treated), study groups (in three strata according to treatment results), and time to transplantation as a time-dependent variable. CI denotes confidence interval.
In each case, the comparator group is the obverse of the noted criterion. For age 6 to 9 years and age 10 years or older, the comparison is with age 1 to 5 years. For SCT with matched, related donor, other allogeneic SCT, and any allogeneic SCT, the comparison is with chemotherapy.
A total of 297 patients had B-cell lineage, t(9;22)(BCR-ABL1)–negative status and known SCT status, with a 10-year-survival rate of 47±3%.
A total of 225 patients had T-cell lineage, t(9;22)(BCR-ABL1)–negative status and known SCT status, with a 10-year-survival rate of 28±3%.
A total of 448 patients had cytogenetic data and known SCT status, with a 10-year survival estimate (±SE) of 36±2%.
In a separate Cox-regression analysis that included the 448 patients with data on transplantation and leukemic-cell genetic abnormalities, independent adverse prognostic factors were an age of at least 10 years, M3 marrow at the end of the induction phase, T-cell disease, and the presence of MLL rearrangement.
The outcome in infants (<1 year of age) with precursor B-cell ALL and induction failure who did not have an MLL rearrangement or BCR-ABL1 fusion was similar to the outcome in children 1 to 5 years of age (10-year survival rates, 65±13% and 63±4%, respectively) (Table 5 in the Supplementary Appendix). In contrast, the 10-year survival rate among infant patients with an MLL rearrangement, as compared with older patients, was very poor (4±4% vs. 26±8%, P = 0.06; data not shown).
TIME TRENDS IN SURVIVAL
The 10-year survival rate among patients with induction failure increased over time by approximately 10% (Table 1) but varied among patient subgroups. Among patients with precursor B-cell ALL, the 10-year survival rate improved from 34±5% before 1993 to 47±4% between 1993 and 2000 (P = 0.02). This improvement was due mainly to better results with chemotherapy. Among patients with T-cell ALL, the 10-year survival rate did not improve significantly over time with chemotherapy, but in the most recent period, the rate did increase, from 20% before 1993 to 31% between 1993 and 2000 (P = 0.02), probably owing to the increased use of allogeneic transplantation.
DISCUSSION
Induction failure is rare, occurring in only 2 to 3% of all patients, but it constitutes one of the most unfavorable outcomes in pediatric ALL. In our large retrospective series of patients with induction failure, we observed great clinical and biologic heterogeneity. Among these patients, as compared with an unselected population of children and adolescents with ALL, the conventional adverse prognostic factors such as high leukocyte count, older age, positivity for t(9;22)(BCR-ABL1), and T-cell phenotype were more prevalent and conferred an even worse prognosis.6,12,18,35-39 Indeed, the clinical and biologic characteristics of the patients in our study and the course of the disease were similar to those in patients with relapse during receipt of therapy, another group of patients with a highly unfavorable prognosis.40-44
The patient subgroup with the best outcomes comprised patients with precursor B-cell ALL and either an age of less than 6 years or high hyperdiploidy. Together, these factors accounted for approximately 25% of all patients with induction failure and were associated with a 10-year survival rate above 50%. Although the favorable prognosis of high hyperdiploidy is well recognized in unselected patients with precursor B-cell ALL,18,45-47 this association has not been reported in patients with induction failure. Why did patients with high hyperdiploidy have a relatively favorable prognosis despite the failure of remission-induction therapy? It is unlikely that many of these patients were misdiagnosed as having induction failure, because hematogones (benign immature B-cell precursors that may be mistaken for leukemic cells) should not preferentially occur in patients with high hyperdiploidy. The relatively favorable outcome in patients with high hyperdiploidy may be due to the increased sensitivity of the blast cells to methotrexate and mercaptopurine,45,48 drugs that are generally not used during remission induction but are used at high doses after remission.
The time at which the response was evaluated in these patients also did not have a prognostic effect, most likely because the number of patients in each study group was too small to show a statistical difference (Tables 1 and 2 in the Supplementary Appendix). The Dana–Farber Cancer Institute Consortium has reported that outcomes are not adversely affected by a hypocellular bone marrow at the end of induction therapy or by a delay in reaching complete remission (defined as normal cellular M1 marrow, a neutrophil count of >1×10⁹ per liter, a platelet count of >100×109 per liter, and no extramedullary disease).21 Our current analysis showed that among patients with induction failure, the patients with an M3 marrow, as compared with those with an M1 or M2 marrow, had a poor outcome. The degree of leukemic involvement in bone marrow at the end of the induction phase was inversely correlated with the rate of subsequent complete remission (81% in patients with M1 or M2 marrow but only 61% in those with M3 marrow) and with 10-year survival rates (41±3% with M1 or M2 marrow vs. 26±3% with M3 marrow). Patients who did not have a complete remission after a brief course of additional therapy, as specified in the treatment protocol, (i.e., 25% of all patients with initial induction failure) had an extremely poor prognosis (Table 1).
The extremely poor prognosis of patients with t(9;22)(BCR-ABL1) and induction failure in the era before imatinib therapy was available has been described.21,23,25,49 A recent study34 showed improved early outcomes with intensive chemotherapy and imatinib treatment in patients with ALL who were positive for t(9;22)(BCR-ABL1); the nine patients who were positive for t(9;22)(BCR-ABL1) and had induction failure had a rather favorable outcome. However, the long-term efficacy of this treatment approach as compared with allogeneic transplantation still needs to be determined. It is conceivable that further improvement can be made if the most effective chemotherapy is combined with a new generation of tyrosine kinase inhibitors and if transplantation in special subgroups is guided by minimal residual disease level.50-52
Modifications of chemotherapy have reduced the rate of recurrence among patients with high-risk ALL but have not yet been shown to improve the outcomes in patients with induction failure.53 Several studies have shown that matched-donor transplantation improved the outcomes in patients with induction failure,23,24,35,54 but the number of patients in each of these studies was too small to determine which patient subgroups had the greatest benefit from transplantation.
Our retrospective analysis has the advantage of including large numbers of patients but is limited by the heterogeneity of the protocols guiding the patients’ treatment. Thus, unmeasured variables could influence the findings. However, our data suggest that allogeneic transplantation may be associated with improved outcomes in patients with T-cell ALL who have not had a complete remission with induction chemotherapy. This observation is consistent with prior reports of improved outcomes in patients with high-risk T-cell ALL receiving transplantation after the first remission.55,56 The number of patients with MLL rearrangement in whom induction therapy failed is too small in our study to allow us to determine the role of allogeneic transplantation in this subgroup. Allogeneic transplantation failed to improve the outcome in patients with 11q23–MLL rearrangement in a previous large study from our intergroup collaboration26 but showed some benefits in high-risk subgroups of infants younger than 1 year of age with MLL rearrangement in the Interfant-99 study (ClinicalTrials.gov number, NCT00015873).57 Finally, our analysis showed no benefit of allogeneic transplantation in patients younger than 6 years of age who had precursor B-cell ALL and induction failure and no high-risk cytogenetic features — an observation with considerable clinical implications, since transplantation is generally considered to be the standard of care for such patients.
Supplementary Material
Acknowledgments
This work is dedicated to James B. Nachman, M.D. (1948–2011), who contributed, with a truly global view and outstanding personal dedication, to this and many other important scientific papers in the field of pediatric leukemia.
Supported by St. Anna Children’s Cancer Research Institute, Austria; Deutsche Krebshilfe, Germany; Madeleine–Schickedanz–Kinderkrebsstiftung, Germany; grants (CA13539, CA98543, and CA98413) to the Children’s Cancer Group; Fördergemeinschaft Kinderkrebszentrum Hamburg, Germany; a grant (NCI 5PO1CA068484) from the National Cancer Institute to the Dana–Farber Cancer Institute; Assistance Publique–Hôpitaux de Paris, INSERM, Institut Universitaire d’Hématologie and Centre de Recherche en Hématologie, Oncologie, et Pédiatrie, France; grants (CA30969, CA29139, CA98543, and CA98413) to the Pediatric Oncology Group; a grant (CA21765) and funding from American Lebanese Syrian Associated Charities to St. Jude Children’s Research Hospital; the Medical Research Council, United Kingdom; the Swedish Childhood Cancer Foundation; the Danish Childhood Cancer Foundation; the Norwegian Cancer Society; Fonds Cancer, Belgium; a Clinical Cancer Research grant from the Ministry of Health, Labour, and Welfare, Japan; and the Children’s Cancer Association of Japan.
We thank our many collaborators, the patients and parents, the personnel at all participating institutions and reference laboratories, and the data managers of all participating clinical trial groups.
APPENDIX
The authors’ affiliations are as follows: the Department of Pediatrics, University Medical Center Schleswig-Holstein, Christian-Albrechts-University, Kiel (M.S.), the Department of Pediatric Hematology and Oncology, University Medical Center Eppendorf, Hamburg (G.E.), the Oncogenetic Laboratory, Department of Pediatric Hematology and Oncology, Justus-Liebig-University, Giessen (J.H.), and the Department of Pediatric Hematology and Oncology, Medical School Hannover, Hannover (H.R., M.Z.) — all in Germany; the University of Colorado School of Medicine and the University of Colorado Cancer Center and Children’s Hospital Colorado, Aurora (S.P.H.); the Department of Oncology, St. Jude Children’s Research Hospital and the University of Tennessee Health Science Center, Memphis (C.-H.P.); the Children’s Cancer Group, School of Cancer, Manchester Academic Health Sciences Centre, University of Manchester, Manchester (V.S.), and the Clinical Trial Service Unit, University of Oxford, Oxford (S.R.) — both in the United Kingdom; Children’s Hospital Los Angeles, Los Angeles (P.S.G.); the Department of Pediatric Hemato-Immunology, Hôpital Robert Debré and University of Paris Diderot, Paris (A.B.); Clinica Pediatrica dell’Università degli Studi di Milano–Bicocca, Ospedale San Gerardo, Monza, and the Department of Pediatrics, Ospedali Riuniti, Bergamo — both in Italy (V.C.); the Hemato/oncology unit, Department of Pediatrics, Universitair Ziekenhuis Brussel, Brussels (J.O.); the First Department of Pediatrics, Toho University, Tokyo (A.O.); University Medical Center Utrecht, Utrecht, and Dutch Childhood Oncology Group, The Hague — both in the Netherlands (A.B.V.); the Childhood Cancer Research Unit, Astrid Lindgren Children’s Hospital, Karolinska Institutet, Stockholm (M.H.); the Department of Pediatric Oncology and Division of Hematology-Oncology, Dana–Farber Cancer Institute and Children’s Hospital Boston, Boston (L.B.S.); Nagoya Medical Center, Clinical Research Center, Nagoya, Japan (K.H.); St. Anna Children’s Hospital, Department of Pediatrics, University Medical School, Vienna (G.M.); Midwest Center for Cancer and Blood Disorders and the Department of Pediatrics, Medical College of Wisconsin and Children’s Hospital of Wisconsin — both in Milwaukee (B.M.C.); and the Children’s Oncology Group Statistics and Data Center and the University of Florida, Department of Biostatistics, Gainesville (M.D.)
Footnotes
Disclosure forms provided by the authors are available with the full text of this article at NEJM.org.
References
- 1.Möricke A, Zimmermann M, Reiter A, et al. Long-term results of five consecutive trials in childhood acute lymphoblastic leukemia performed by the ALL-BFM study group from 1981 to 2000. Leukemia. 2010;24:265–84. doi: 10.1038/leu.2009.257. [DOI] [PubMed] [Google Scholar]
- 2.Pui CH, Campana D, Pei D, et al. Treating childhood acute lymphoblastic leukemia without cranial irradiation. N Engl J Med. 2009;360:2730–41. doi: 10.1056/NEJMoa0900386. [DOI] [PMC free article] [PubMed] [Google Scholar]
- 3.Schmiegelow K, Forestier E, Hellebostad M, et al. Long-term results of NOPHO ALL-92 and ALL-2000 studies of childhood acute lymphoblastic leukemia. Leukemia. 2010;24:345–54. doi: 10.1038/leu.2009.251. Erratum, Leukemia 2010; 24:670. [DOI] [PubMed] [Google Scholar]
- 4.Silverman LB, Stevenson KE, O’Brien JE, et al. Long-term results of Dana-Farber Cancer Institute ALL Consortium protocols for children with newly diagnosed acute lymphoblastic leukemia (1985-2000) Leukemia. 2010;24:320–34. doi: 10.1038/leu.2009.253. [DOI] [PMC free article] [PubMed] [Google Scholar]
- 5.Mitchell C, Richards S, Harrison CJ, Eden T. Long-term follow-up of the United Kingdom Medical Research Council protocols for childhood acute lymphoblastic leukaemia, 1980-2001. Leukemia. 2010;24:406–18. doi: 10.1038/leu.2009.256. [DOI] [PMC free article] [PubMed] [Google Scholar]
- 6.Conter V, Aricò M, Basso G, et al. Long-term results of the Italian Association of Pediatric Hematology and Oncology (AIEOP) Studies 82, 87, 88, 91 and 95 for childhood acute lymphoblastic leukemia. Leukemia. 2010;24:255–64. doi: 10.1038/leu.2009.250. [DOI] [PubMed] [Google Scholar]
- 7.Gaynon PS, Angiolillo AL, Carroll WL, et al. Long-term results of the Children’s Cancer Group studies for childhood acute lymphoblastic leukemia 1983-2002: a Children’s Oncology Group report. Leukemia. 2010;24:285–97. doi: 10.1038/leu.2009.262. [DOI] [PMC free article] [PubMed] [Google Scholar]
- 8.Salzer WL, Devidas M, Carroll WL, et al. Long-term results of the Pediatric Oncology Group studies for childhood acute lymphoblastic leukemia 1984-2001: a report from the Children’s Oncology Group. Leukemia. 2010;24:355–70. doi: 10.1038/leu.2009.261. [DOI] [PMC free article] [PubMed] [Google Scholar]
- 9.Tsuchida M, Ohara A, Manabe A, et al. Long-term results of Tokyo Children’s Cancer Study Group trials for childhood acute lymphoblastic leukemia, 1984-1999. Leukemia. 2010;24:383–96. doi: 10.1038/leu.2009.260. [DOI] [PubMed] [Google Scholar]
- 10.Riehm H, Gadner H, Henze G, Langermann H-J, Odenwald E. The Berlin Childhood Acute Lymphoblastic Leukemia Therapy Study, 1970-1976. Am J Pediatr Hematol Oncol. 1980;2:299–306. [Google Scholar]
- 11.Smith M, Bleyer A, Crist W, Murphy S, Sallan SE. Uniform criteria for childhood acute lymphoblastic leukemia risk classification. J Clin Oncol. 1996;14:680–1. doi: 10.1200/JCO.1996.14.2.680. [DOI] [PubMed] [Google Scholar]
- 12.Reiter A, Schrappe M, Ludwig WD, et al. Chemotherapy in 998 unselected childhood acute lymphoblastic leukemia patients: results and conclusions of the multicenter trial ALL-BFM 86. Blood. 1994;84:3122–33. [PubMed] [Google Scholar]
- 13.Pieters R, Huismans DR, Loonen AH, et al. Relation of cellular drug resistance to long-term clinical outcome in childhood acute lymphoblastic leukaemia. Lancet. 1991;338:399–403. doi: 10.1016/0140-6736(91)91029-t. [DOI] [PubMed] [Google Scholar]
- 14.Cavé H, van der Werff ten Bosch J, Suciu S, et al. Clinical significance of minimal residual disease in childhood acute lymphoblastic leukemia. N Engl J Med. 1998;339:591–8. doi: 10.1056/NEJM199808273390904. [DOI] [PubMed] [Google Scholar]
- 15.van Dongen JJM, Seriu T, Panzer-Grümayer ER, et al. Prognostic value of minimal residual disease in childhood acute lymphoblastic leukemia: a prospective study of the International BFM Study Group. Lancet. 1998;352:1731–8. doi: 10.1016/S0140-6736(98)04058-6. [DOI] [PubMed] [Google Scholar]
- 16.Biondi A, Cimino G, Pieters R, Pui CH. Biological and therapeutic aspects of infant leukemia. Blood. 2000;96:24–33. [PubMed] [Google Scholar]
- 17.Duval M, Suciu S, Ferster A, et al. Comparison of Escherichia coli-asparaginase with Erwinia-asparaginase in the treatment of childhood lymphoid malignancies: results of a randomized European Organisation for Research and Treatment of Cancer–Children’s Leukemia Group phase 3 trial. Blood. 2002;99:2734–9. doi: 10.1182/blood.v99.8.2734. [DOI] [PubMed] [Google Scholar]
- 18.Schultz KR, Pullen DJ, Sather HN, et al. Risk- and response-based classification of childhood B-precursor acute lymphoblastic leukemia: a combined analysis of prognostic markers from the Pediatric Oncology Group (POG) and Children’s Cancer Group (CCG) Blood. 2007;109:926–35. doi: 10.1182/blood-2006-01-024729. [DOI] [PMC free article] [PubMed] [Google Scholar]
- 19.Mullighan CG, Su X, Zhang J, et al. Deletion of IKZF1 and prognosis in acute lymphoblastic leukemia. N Engl J Med. 2009;360:470–80. doi: 10.1056/NEJMoa0808253. [DOI] [PMC free article] [PubMed] [Google Scholar]
- 20.Janka-Schaub GE, Stührk H, Kortüm B, et al. Bone marrow blast count at day 28 as the single most important prognostic factor in childhood acute lymphoblastic leukemia. Haematol Blood Transfus. 1992;34:233–7. [Google Scholar]
- 21.Silverman LB, Gelber RD, Young ML, Dalton VK, Barr RD, Sallan SE. Induction failure in acute lymphoblastic leukemia of childhood. Cancer. 1999;85:1395–404. doi: 10.1002/(sici)1097-0142(19990315)85:6<1395::aid-cncr25>3.0.co;2-2. [DOI] [PubMed] [Google Scholar]
- 22.Schrappe M, Reiter A, Ludwig W-D, et al. Improved outcome in childhood acute lymphoblastic leukemia despite reduced use of anthracyclines and cranial radiotherapy: results of trial ALL-BFM 90. Blood. 2000;95:3310–22. [PubMed] [Google Scholar]
- 23.Oudot C, Auclerc MF, Levy V, et al. Prognostic factors for leukemic induction failure in children with acute lymphoblastic leukemia and outcome after salvage therapy: the FRALLE 93 study. J Clin Oncol. 2008;26:1496–503. doi: 10.1200/JCO.2007.12.2820. [DOI] [PubMed] [Google Scholar]
- 24.Balduzzi A, Valsecchi MG, Uderzo C, et al. Chemotherapy versus allogeneic transplantation for very-high-risk childhood acute lymphoblastic leukaemia in first complete remission: comparison by genetic randomisation in an international prospective study. Lancet. 2005;366:635–42. doi: 10.1016/S0140-6736(05)66998-X. [DOI] [PubMed] [Google Scholar]
- 25.Aricò M, Valsecchi MG, Camitta B, et al. Outcome of treatment in children with Philadelphia chromosome–positive acute lymphoblastic leukemia. N Engl J Med. 2000;342:998–1006. doi: 10.1056/NEJM200004063421402. [DOI] [PubMed] [Google Scholar]
- 26.Pui CH, Gaynon PS, Boyett JM, et al. Outcome of treatment in childhood acute lymphoblastic leukaemia with rearrangements of the 11q23 chromosomal region. Lancet. 2002;359:1909–15. doi: 10.1016/S0140-6736(02)08782-2. [DOI] [PubMed] [Google Scholar]
- 27.Nachman JB, Heerema NA, Sather H, et al. Outcome of treatment in children with hypodiploid acute lymphoblastic leukemia. Blood. 2007;110:1112–5. doi: 10.1182/blood-2006-07-038299. [DOI] [PMC free article] [PubMed] [Google Scholar]
- 28.Kaplan EL, Meier P. Nonparametric estimation from incomplete observations. J Am Stat Assoc. 1958;53:457–81. [Google Scholar]
- 29.Mantel N. Evaluation of survival data and two new rank order statistics arising in its consideration. Cancer Chemother Rep. 1966;50:163–70. [PubMed] [Google Scholar]
- 30.Cox DR. Regression models and life-tables. J R Stat Soc [B] 1972;34:187–220. [Google Scholar]
- 31.Ottmann OG, Wassmann B, Pfeifer H, et al. Imatinib compared with chemotherapy as front-line treatment of elderly patients with Philadelphia chromosome-positive acute lymphoblastic leukemia (Ph+ALL) Cancer. 2007;109:2068–76. doi: 10.1002/cncr.22631. [DOI] [PubMed] [Google Scholar]
- 32.Yanada M, Takeuchi J, Sugiura I, et al. High complete remission rate and promising outcome by combination of imatinib and chemotherapy for newly diagnosed BCR-ABL-positive acute lymphoblastic leukemia: a phase II study by the Japan Adult Leukemia Study Group. J Clin Oncol. 2006;24:460–6. doi: 10.1200/JCO.2005.03.2177. [DOI] [PubMed] [Google Scholar]
- 33.Vignetti M, Fazi P, Cimino G, et al. Imatinib plus steroids induces complete remissions and prolonged survival in elderly Philadelphia chromosome-positive patients with acute lymphoblastic leukemia without additional chemotherapy: results of the Gruppo Italiano Malattie Ematologiche dell’Adulto (GIMEMA) LAL0201-B protocol. Blood. 2007;109:3676–8. doi: 10.1182/blood-2006-10-052746. [DOI] [PubMed] [Google Scholar]
- 34.Schultz KR, Bowman WP, Aledo A, et al. Improved early event-free survival with imatinib in Philadelphia chromosome-positive acute lymphoblastic leukemia: a Children’s Oncology Group study. J Clin Oncol. 2009;27:5175–81. doi: 10.1200/JCO.2008.21.2514. [DOI] [PMC free article] [PubMed] [Google Scholar]
- 35.Möricke A, Reiter A, Zimmermann M, et al. Risk-adjusted therapy of acute lymphoblastic leukemia can decrease treatment burden and improve survival: treatment results of 2169 unselected pediatric and adolescent patients enrolled in the trial ALL-BFM 95. Blood. 2008;111:4477–89. doi: 10.1182/blood-2007-09-112920. Erratum, Blood 2009;113:4478. [DOI] [PubMed] [Google Scholar]
- 36.Chessells JM, Bailey C, Richards SM. Intensification of treatment and survival in all children with lymphoblastic leukaemia: results of UK Medical Research Council trial UKALL X. Lancet. 1995;345:143–8. doi: 10.1016/s0140-6736(95)90164-7. [DOI] [PubMed] [Google Scholar]
- 37.Pui CH, Relling MV, Downing JR. Acute lymphoblastic leukemia. N Engl J Med. 2004;350:1535–48. doi: 10.1056/NEJMra023001. [DOI] [PubMed] [Google Scholar]
- 38.Moghrabi A, Levy DE, Asselin B, et al. Results of the Dana-Farber Cancer Institute ALL Consortium Protocol 95-01 for children with acute lymphoblastic leukemia. Blood. 2007;109:896–904. doi: 10.1182/blood-2006-06-027714. [DOI] [PMC free article] [PubMed] [Google Scholar]
- 39.Aricò M, Valsecchi MG, Rizzari C, et al. Long-term results of the AIEOP-ALL-95 Trial for Childhood Acute Lymphoblastic Leukemia: insight on the prognostic value of DNA index in the framework of Berlin-Frankfurt-Muenster based chemotherapy. J Clin Oncol. 2008;26:283–9. doi: 10.1200/JCO.2007.12.3927. [DOI] [PubMed] [Google Scholar]
- 40.Gaynon PS. Childhood acute lymphoblastic leukaemia and relapse. Br J Haematol. 2005;131:579–87. doi: 10.1111/j.1365-2141.2005.05773.x. [DOI] [PubMed] [Google Scholar]
- 41.Einsiedel HG, von Stackelberg A, Hartmann R, et al. Long-term outcome in children with relapsed ALL by risk-stratified salvage therapy: results of trial Acute Lymphoblastic Leukemia-Relapse Study of the Berlin-Frankfurt-Munster Group 87. J Clin Oncol. 2005;23:7942–50. doi: 10.1200/JCO.2005.01.1031. Erratum, J Clin Oncol 2008;26:2238. [DOI] [PubMed] [Google Scholar]
- 42.Nguyen K, Devidas M, Cheng SC, et al. Factors influencing survival after relapse from acute lymphoblastic leukemia: a Children’s Oncology Group study. Leukemia. 2008;22:2142–50. doi: 10.1038/leu.2008.251. [DOI] [PMC free article] [PubMed] [Google Scholar]
- 43.Ko RH, Ji L, Barnette P, et al. Outcome of patients treated for relapsed or refractory acute lymphoblastic leukemia: a Therapeutic Advances in Childhood Leukemia Consortium study. J Clin Oncol. 2010;28:648–54. doi: 10.1200/JCO.2009.22.2950. [DOI] [PMC free article] [PubMed] [Google Scholar]
- 44.Tallen G, Ratei R, Mann G, et al. Long-term outcome in children with relapsed acute lymphoblastic leukemia after time-point and site-of-relapse stratification and intensified short-course multi-drug chemotherapy: results of trial ALL-REZ BFM 90. J Clin Oncol. 2010;28:2339–47. doi: 10.1200/JCO.2009.25.1983. [DOI] [PubMed] [Google Scholar]
- 45.Kaspers GJ, Smets LA, Pieters R, Van Zantwijk CH, Van Wering ER, Veerman AJ. Favorable prognosis of hyperdiploid common acute lymphoblastic leukemia may be explained by sensitivity to antime-tabolites and other drugs: results of an in vitro study. Blood. 1995;85:751–6. [PubMed] [Google Scholar]
- 46.Heerema NA, Sather HN, Sensel MG, et al. Prognostic impact of trisomies of chromosomes 10, 17, and 5 among children with acute lymphoblastic leukemia and high hyperdiploidy (>50 chromosomes) J Clin Oncol. 2000;18:1876–87. doi: 10.1200/JCO.2000.18.9.1876. [DOI] [PubMed] [Google Scholar]
- 47.Moorman AV, Ensor HM, Richards SM, et al. Prognostic effect of chromosomal abnormalities in childhood B-cell precursor acute lymphoblastic leukaemia: results from the UK Medical Research Council ALL97/99 randomised trial. Lancet Oncol. 2010;11:429–38. doi: 10.1016/S1470-2045(10)70066-8. Erratum, Lancet Oncol 2010;11:516. [DOI] [PubMed] [Google Scholar]
- 48.Synold TW, Relling MV, Boyett JM, et al. Blast cell methotrexate-polyglutamate accumulation in vivo differs by lineage, ploidy, and methotrexate dose in acute lymphoblastic leukemia. J Clin Invest. 1994;94:1996–2001. doi: 10.1172/JCI117552. [DOI] [PMC free article] [PubMed] [Google Scholar]
- 49.Schrappe M, Aricò M, Harbott J, et al. Philadelphia chromosome-positive (Ph+) childhood acute lymphoblastic leukemia: good initial steroid response allows early prediction of a favorable treatment outcome. Blood. 1998;92:2730–41. [PubMed] [Google Scholar]
- 50.Eckert C, Biondi A, Seeger K, et al. Prognostic value of minimal residual disease in relapsed childhood acute lymphoblastic leukaemia. Lancet. 2001;358:1239–41. doi: 10.1016/S0140-6736(01)06355-3. [DOI] [PubMed] [Google Scholar]
- 51.Bader P, Kreyenberg H, Henze GH, et al. Prognostic value of minimal residual disease quantification before allogeneic stem-cell transplantation in relapsed childhood acute lymphoblastic leukemia: the ALL-REZ BFM Study Group. J Clin Oncol. 2009;27:377–84. doi: 10.1200/JCO.2008.17.6065. [DOI] [PubMed] [Google Scholar]
- 52.Conter V, Bartram CR, Valsecchi MG, et al. Molecular response to treatment redefines all prognostic factors in children and adolescents with B-cell precursor acute lymphoblastic leukemia: results in 3184 patients of the AIEOP-BFM ALL 2000 study. Blood. 2010;115:3206–14. doi: 10.1182/blood-2009-10-248146. [DOI] [PubMed] [Google Scholar]
- 53.Nachman JB, Sather HN, Sensel MG, et al. Augmented post-induction therapy for children with high-risk acute lymphoblastic leukemia and a slow response to initial therapy. N Engl J Med. 1998;338:1663–71. doi: 10.1056/NEJM199806043382304. [DOI] [PubMed] [Google Scholar]
- 54.Aricò M, Valsecchi MG, Conter V, et al. Improved outcome in high-risk childhood acute lymphoblastic leukemia defined by prednisone-poor response treated with double Berlin-Frankfurt-Muenster protocol II. Blood. 2002;100:420–6. doi: 10.1182/blood.v100.2.420. [DOI] [PubMed] [Google Scholar]
- 55.Schrauder A, Reiter A, Gadner H, et al. Superiority of allogeneic hematopoietic stem-cell transplantation compared with chemotherapy alone in high-risk childhood T-cell acute lymphoblastic leukemia: results from ALL-BFM 90 and 95. J Clin Oncol. 2006;24:5742–9. doi: 10.1200/JCO.2006.06.2679. [DOI] [PubMed] [Google Scholar]
- 56.Schrappe M, Valsecchi MG, Bartram CR, et al. Late MRD response determines relapse risk overall and in subsets of childhood T-cell ALL: results of the AIEOP-BFM-ALL 2000 study. Blood. 2011;118:2077–84. doi: 10.1182/blood-2011-03-338707. [DOI] [PubMed] [Google Scholar]
- 57.Mann G, Attarbaschi A, Schrappe M, et al. Improved outcome with hematopoietic stem cell transplantation in a poor prognostic subgroup of infants with mixed-lineage-leukemia (MLL)-rearranged acute lymphoblastic leukemia: results from the Interfant-99 Study. Blood. 2010;116:2644–50. doi: 10.1182/blood-2010-03-273532. [DOI] [PubMed] [Google Scholar]
Associated Data
This section collects any data citations, data availability statements, or supplementary materials included in this article.