Abstract

In this letter, we, for the first time, report on coherent anti-Stokes Raman scattering (CARS) spectroscopy of an ensemble of silicon nanowires (SiNWs) formed by wet chemical etching of crystalline silicon with a mask of silver nanoparticles. The fabricated SiNWs have diameter ranged from 30 to 200 nm and demonstrate both visible and infrared photolumine cence (PL) and spontaneous Raman signal, with their intensities depending on presence of silver nanoparticles in SiNWs. The efficiency of CARS in SiNW ensembles is found to be significantly higher than that in crystalline silicon. The results of CARS and PL measurements are explained in terms of resonant excitation of the electron states attributed to silicon nanoparticles.
Keywords: silicon nanowires, Raman scattering, CARS, photoluminescence
1. Introduction
Silicon (Si) photonics is a fast-advancing area of the modern optical engineering [1–4], whose success is based on a powerful blend of well-established methods for silicon nanostructuring and advanced optical technologies. Among various prospective Si-based systems for photonics and optoelectronics, a special attention is paid to Si nanostructures, for which their optical properties can be controllably varied with respect to crystalline Si (c-Si). In particular, silicon nanowire (SiNW) ensemble presents an intriguing system, for which optical properties are relatively unexplored. These structures are often formed by molecular-beam or electron-beam evaporation combined with vapor-liquid-solid (VLS) growth with a help of Au droplets deposited on silicon surface [5, 6] or by wet etching [7, 8]. In the latter case, silver nanoparticles deposited on the Si surface play a role of catalyst and initiate the etching of pores at the places of particles' deposition. SiNWs are typically characterized by ordered straight or zigzag columns of c-Si of about 100 nm in diameter, with Si nanocrystals of much smaller size covering the column's sidewalls. These nanocrystals are believed to result in the visible photoluminescence (PL) through the quantum confinement mechanism [8]. The SiNWs grown by VLS methods have Au nanoparticles covering the top surface of nanowires, giving rise to a possibility of a locally enhanced Raman signal due to a well-known effect of surface enhancement [5, 6]. An order of magnitude Raman signal enhancement in comparison with the initial c-Si was also found in SiNW ensembles formed by a wet-etching processing. This observation can be attributed to the multiple scattering effects of light in the sample resulting in the increase of the optical path and, therefore, the rise of the total Raman scattering efficiency in the sample [9].
The same effect of multiple light scattering is responsible for a significant (one or two orders of magnitude) increase of the nonlinear-optical interaction efficiency in nanostructured semiconductors, such as mesoporous Si and macroporous GaP in comparison with bulk ones. In particular, a substantial improvement of the efficiencies of several nonlinear optical processes, i.e. the second- and third harmonics generation, sum-frequency generation and self-action, has been observed [10–15]. However, our previous results on coherent anti-Stokes Raman scattering (CARS) in macroporous GaP indicate that this particular nonlinear-optical process does not follow the general trend, most probably, due to a short coherence length, which is less than the size of nanocrystals [14].
CARS is a nonlinear optical process of parametric interaction of three waves with frequencies ω1, ω2, and ω3 resulting in generating a wave at the frequency ωCARS = ω3 +(ω1 – ω2). For the sake of simplicity of experimental set up, a degenerative optical interaction, in which the same laser is used for ω1 and ω3, is often employed. Given the parametric nature of the CARS signal, it occurs at any combination of frequencies ω1 and ω2, leading to a so-called “non-resonant” background. When the difference frequency, ω1 – ω2, is at or near the resonance with some vibrational or electronic transition, it results in a significant rise of the signal at ωCARS. Being a coherent nonlinear-optical process, the CARS efficiency is sensitive to the phase matching of interacting waves. Among variety of modern nonlinear-optical research techniques [16–18], CARS is recognized to be an invaluable tool for studying microobjects and their molecular environment [19–21], chemical and biological object [22–25], and for frequency conversion in various media, including Si-based ones [26].
In this letter, we report on the CARS spectroscopy of SiNW ensembles and compare those results with the photoluminescence and spontaneous Raman scattering data.
2. Experimental
2.1. Samples
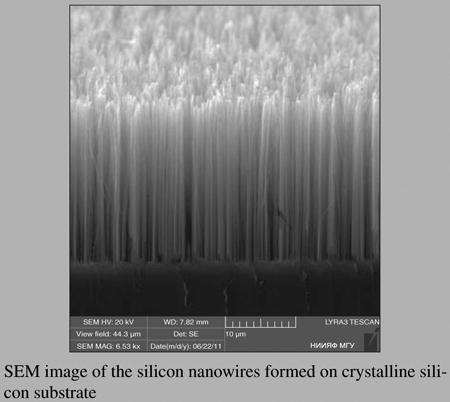
The SiNW samples were prepared by the wet etching process of low boron-doped (100) c-Si (1–10 Ω cm) wafer. We followed the two-step procedure of SiNW formation [7]. In the first step, silver nanoparticles were deposited on the c-Si surface during the immersion of c-Si wafer in the aqueous solution of 0.02 M AgNO3 and 5 M HF in the volume ratio 1:1 for 1 minute. The second step was the etching of c-Si wafer covered by Ag nanoparticles in solution of 5 M HF and 30% H2O2 in the volume ratio 10:1 for 30 minutes. As a result, SiNWs were formed (see Fig. 1). The thickness of the SiNW layer was 24 μm, the diameter of wires ranged from 30 to 200 nm. The SiNWs are well-ordered, as it is clearly seen from the scanning electron microscope (SEM) images (Fig. 1a). The fabricated samples contained residual Ag nanoparticles (Fig. 1b), with fraction being of about 1% according to the X-ray micro-analysis data. To remove those nanoparticles from the surface, some samples were washed in HNO3 for about 15 minutes.
Figure 1.

SEM image of SiNWs illustrating the whole structure (a) and TEM image of a single SiNW with Ag nanoparticles (b). The scale bars are shown on the bottom of each image
2.2. Optical characterization of the samples and CARS measurements
Due to the size of SiNWs, which are comparable with the optical wavelength, all the samples exhibited substantial scattering. To characterize electronic and vibrational properties of the formed SiNW samples we employed techniques of PL and spontaneous Raman scattering. PL was excited by the ultraviolet (UV) line of an Ar-ion laser (364 nm) and detected by a spectrometer (MS750, SOLAR TII) equipped with detectors both for the visible and the infrared (IR) spectral regions. A Fourier-transform IR spectrometer (IFS 66 v/S, Bruker) with a Raman unit (FRA-106 FT, Bruker) allowed us detecting the PL and Raman spectra excited by a CW Nd:YAG laser (1064 nm). In the latter case, even though absorption length for used wavelength is of order of 100 μm, the strong light scattering prevented incident radiation from penetrating deep into the sample, thus, generating the measured signals predominantly in SiNW ensembles [9].
For the CARS experiments, we used the home-build broadband system, described elsewhere [27–30]. In brief, the laser system was based on a diode-pumped, extendedcavity Nd:YVO4 oscillator with “nonlinear mirror” mode-locking (master oscillator) and a multipass Nd:YVO4 amplifier, which provided 8-ps laser pules of 2 μJ at wavelength 1064 nm at the repetition rate of about 1 MHz. Some part of the fundamental radiation was split with a help of the half-wave plate and polarizing beam-splitter and used for broadband, red-shifted continuum generation in a single-mode GeO2-doped optical fiber. The broadband continuum radiation from the output of the fiber was collimated and combined together through a dichroic beam splitter with a time-delayed residual 1064 nm radiation. Both pulses were then focused onto the sample with an aspheric lens (FL= 16 mm). In the employed experimental setting, the broadband CARS signal was generated at the frequency 2ω-ωcont, where ω was the frequency of the Nd:YVO4 laser radiation and ωcont was the frequency of the continuum radiation. The CARS signal in the spectral region from 800 to 1030 nm was collected in the backscattering geometry by the same lens, spectrally separated from the incident radiation with a help of a dichroic filter (1050 nm long pass; Semrock, Inc.) and directed to a spectrometer (TRIAX-550; Horiba Jobin-Yvon), where it was detected by a multichannel CCD detector (iDus; Andor Technology, Inc.). The collected CARS spectra were normalized by the CARS spectrum of a glass plate. Since the latter one is mostly due to the non-resonant parametric interaction, this normalization allowed us to take into account the exact spectral intensity profile of a broadband continuum.
3. Results and discussion
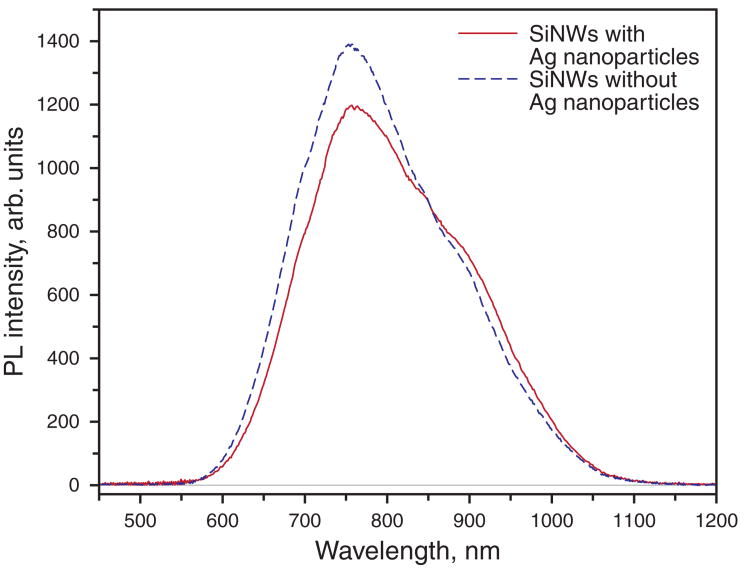
The PL spectra of SiNW samples both with and without Ag nanoparticles on the surface are shown in Fig. 2. The PL spectra exhibit broad band ranging from 600 to 1100 nm. This fact indicates the presence of Si nanopar-ticles, in which the quantum-confinement effect results in the rather efficient visible PL. The presence of Ag nanoparticles on the top surface of SiNWs does not significantly affect the shape of PL spectra.
Figure 2.
(online color at www.lphys.org) PL spectra of SiNW with (solid line) Ag nanoparticles and after their removal (dashed line). Spectra were excited by the Ar-ion laser radiation at 364 nm
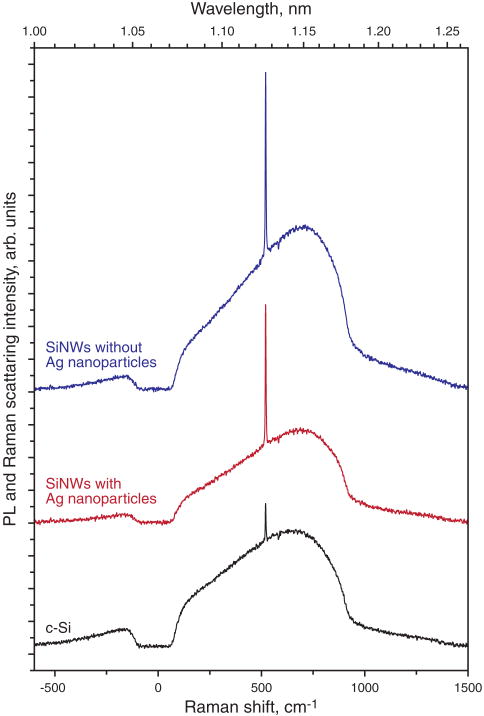
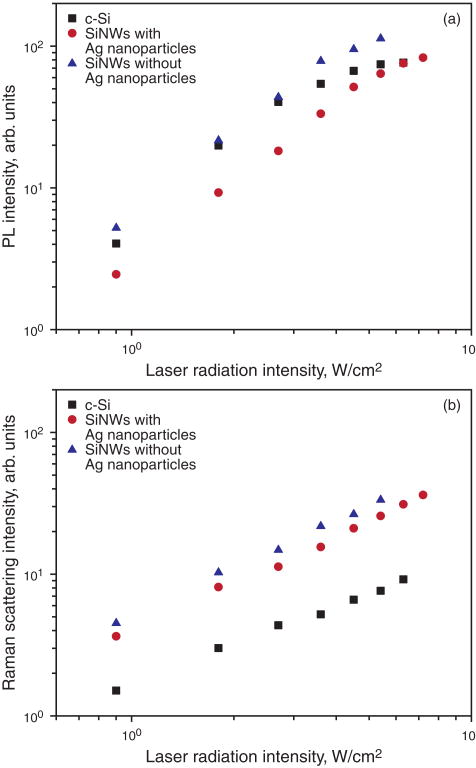
In order to shed more light on the properties of SiNWs and c-Si, we collected PL and Raman spectra excited by the near-IR excitation at 1064 nm (Fig. 3). Those spectra consist of a broad PL band and a relatively narrow Raman peak at 520 cm−1. The Raman signal from SiNW ensembles with Ag nanoparticles on columns' surface exceeds by four times the Raman signal from the c-Si sample collected in the same experimental conditions. The removal of Ag nanoparticles further increased the Raman signal making it 5 times stronger the one from the c-Si sample. The PL signal from the SiNWs ensembles with out Ag nanoparticles on its surface is 1.4 times stronger than the one from the c-Si samples, while the SiNWs with Ag nanoparticles demonstrate a slightly weaker PL signal than the original c-Si wafer. For all the samples, the PL signal possessed square dependence on the incident light intensity Iexc (Fig. 4), which is typical for the interband electronic transition, however, at Iexc > 4 W/cm2 the PL signal showed the tendency to saturation with the increase of Iexc. In the same time, the Raman signal linearly depends on Iexc, which is typical for the spontaneous Raman scattering process, where no structural changes or substantial temperature heating of the sample are present. Note that the PL spectra presented in Fig. 2 and Fig. 3 were obtained using substantially different excitation wavelengths (UV and IR), which results in a drastic difference in the thicknesses of the light-absorbing layer (for the c-Si, for example, those absorption depths are 10 nm in the UV and 100 μm in the near-IR). This fact can explain why the near IR PL was sensitive to the presence of Ag nanoparticles, whereas PL excited by the UV radiation was not.
Figure 3.
(online color at www.lphys.org) PL and spontaneous Raman spectra of c-Si and SiNWs excited by the 1064-nm radiation. A dip at around 0 cm−1 is attributed to the transmission properties of the employed notch filter
Figure 4.
(online color at www.lphys.org) The power dependence of the PL (a) and spontaneous Raman (b) signals on the intensity of the incident light radiation at 1064 nm
The Raman and PL spectra were complemented by the CARS spectra. Fig. 5 shows the CARS spectra for c-Si and SiNWs with and without Ag nanoparticles. The CARS spectrum collected from the c-Si sample consists of the background and a peak at 1008 nm, corresponding to the resonance with the phonon frequency of Si lattice. The amplitude of the CARS signal increases with the increasing CARS wavelength. This result can be explained in terms of the reduced absorption coefficient at the vicinity of the interband absorption in c-Si. The most significant feature of the CARS signal from the SiNW ensembles is that the amplitude of the CARS signal is substantially higher than that from the c-Si. SiNW ensemble with Ag nanoparticles exhibit a band of a relatively high CARS signal for the wavelengths less than 850 nm; for the SiNW ensemble without Ag nanoparticles, the band of the high CARS signal is in the spectral interval from 950 to 1000 nm. However, for both SiNW ensembles, at the wavelengths longer than 1000 nm, the amplitude of the CARS signal goes down with the increase of the CARS wavelength. The resonant signal at 1008 nm for the SiNWs sample containing Ag nanoparticles is as high as for the c-Si, whereas it is 4 times higher for the SiNW sample without Ag nanoparticles (cf. insets in Fig. 5).
Figure 5.
(online color at www.lphys.org) Spectra of CARS signal for c-Si (a), SiNWs with Ag nanoparticles (b), and SiNWs without Ag nanoparticles (c). Insets exhibit resonance peak corresponding to the phonon frequency of Si at 520 cm−1 for the corresponding samples. Schematic energy diagram of the CARS process is shown in the right inset of (a)
To understand the experimentally collected results, we inevitably have to take into account the effects of light scattering in the SiNW samples. On the one hand, the effect of scattering reduces the signal collection efficiency, which, possibly, explains the low amplitude of the CARS signal from the SiNWs samples for the wavelengths longer than 1000 nm. On the other hand, the light scattering increases both the coherence length, since waves with various wave vectors take part in the CARS process in a scattering medium, and the length of the wave interaction due to a longer photon path in an optically inhomogeneous medium. The electron-hole transitions in SiNWs both with and without Ag nanoparticles could significantly contribute to the increased efficiency of the CARS signal. As one can conclude from Fig. 2 and Fig. 3, these states, most probably, exist (the long-wavelength wing of the PL spectra in Fig. 2 and the short-wavelength wing of the PL spectra in Fig. 3), although we do not have direct data to compare the efficiency of those transitions for different samples. Since the IR PL is more efficient for the SiNWs ensembles without Ag nanoparticles, we can suggest that a larger fraction of the electron and hole states are contributing to the radiative recombination or they have higher radiative-recombination rate in this sample than in SiNWs with Ag nanoparticles. Extrapolating this idea into the spectral range of 950 – 1000 nm, we, in turn, can expect a higher efficiency of the nonlinear-optical process. In contrast, a more efficient CARS process in the SiNWs ensembles with Ag nanoparticles for the wavelengths below 850 nm can indicate a higher transition probability for the corresponding electron and hole states. Thus, both these factors (scattering and electronic resonances) could compensate for and even exceed some reduction in the signal collection efficiency and the light absorption increase for the lower wavelength spectral region. A stronger phonon resonance peak at around 1008 nm in the SiNWs ensembles without Ag nanoparticles might correspond to a larger spontaneous Raman cross-section in this material.
4. Conclusion
In conclusion, we fabricated SiNWs by means of the wetelectroless process and investigated their optical properties using a battery of tools, which included photoluminescence, spontaneous Raman and nonlinear Raman spectroscopy. The resonant CARS peak corresponding to the Si lattice vibration was found to be 4 times stronger in the SiNWs ensembles without Ag nanoparticles as compared to the one from the c-Si and the SiNWs ensembles with Ag nanoparticles. The non-resonant CARS signal in the SiNWs ensembles was found to be substantially stronger than that in c-Si for the CARS wavelengths less than 1000 nm. These results could be explained by taking into account both the effects of light scattering in the SiNWs ensembles and the electron and hole states, whose transition frequencies are resonant to the CARS frequencies.
Acknowledgments
This work was supported by the Russian Foundation for Basic Research (grants No. 11-02-01087 and No. 11-02-90506), the Ministry of Education and Science of the Russian Federation (project No. 16.513.12.3010), the National Institutes of Health (USA) (grants No. R15EY020805 and No. R21EB011703), and the National Science Foundation (USA) (grants No. ECS-0925950 and No. DBI-0964225). Authors are indebted to V.A. Sivakov and P.K. Kashkarov for extremely fruitful discussions, S.S. Abramchuk and D.V. Petrov for the electron microscopy measurements, and A.V. Neskoromnaya for the assistance in the sample preparation.
References
- 1.Liang D, Bowers JE. Nat Photonics. 2010;4:511. [Google Scholar]
- 2.Leuthold J, Koos C, Freude W. Nat Photonics. 2010;4:535. [Google Scholar]
- 3.Park W. Laser Phys Lett. 2010;7:93. [Google Scholar]
- 4.Lockwood DJ, Pavesi L, editors. Silicon Photonics II Components and Integration, Topics in Applied Physics. Vol. 119. Springer-Verlag; Berlin – Heidelberg: 2011. [Google Scholar]
- 5.Christiansen SH, Becker M, Fahlbusch S, Michler J, Sivakov V, Andrä G, Geiger R. Nanotechnol. 2007;18:035503. doi: 10.1088/0957-4484/18/3/035503. [DOI] [PubMed] [Google Scholar]
- 6.Becker M, Sivakov V, Andrä G, Geiger R, Schreiber J, Hoffmann S, Michler J, Milenin AP, Werner P, Christiansen SH. Nano Lett. 2007;7:75. doi: 10.1021/nl0621286. [DOI] [PubMed] [Google Scholar]
- 7.Sivakov VA, Brönstrup G, Pecz B, Berger A, Radnoczi GZ, Krause M, Christiansen SH. J Phys Chem C. 2010;114:3798. [Google Scholar]
- 8.Sivakov VA, Voigt F, Berger A, Bauer G, Christiansen SH. Phys Rev B. 2010;82:125446. [Google Scholar]
- 9.Gonchar KA, Golovan' LA, Timoshenko VYu, Sivakov VA, Christiansen S. Bull Russ Acad Sci Phys. 2010;74:1712. [Google Scholar]
- 10.Tiginyanu IM, Kravetsky IV, Monecke J, Cordts W, Marowsky G, Hartnagel HL. Appl Phys Lett. 2000;77:2415. [Google Scholar]
- 11.Golovan' LA, Mel'nikov VA, Konorov SO, Fedotov AB, Gavrilov SA, Zheltikov AM, Kashkarov PK, Timoshenko VYu, Petrov GI, Li L, Yakovlev VV. JETP Lett. 2003;78:193. [Google Scholar]
- 12.Golovan LA, Kuznetsova LP, Fedotov AB, Konorov SO, Sidorov-Biryukov DA, Timoshenko VY, Zheltikov AM, Kashkarov PK. Appl Phys B. 2003;76:429. [Google Scholar]
- 13.Golovan LA, Melnikov VA, Bestem'yanov KP, Zabotnov SV, Gordienko VM, Timoshenko VYu, Zheltikov AM, Kashkarov PK. Appl Phys B. 2005;81:353. [Google Scholar]
- 14.Golovan LA, Petrov GI, Fang GY, Melnikov VA, Gavrilov SA, Zheltikov AM, Timoshenko VY, Kashkarov PK, Yakovlev VV, Li CF. Appl Phys B. 2006;84:303. [Google Scholar]
- 15.Gayvoronsky VYa, Kopylovsky MA, Gromov YuV, Zabotnov SV, Piskunov NA, Golovan LA, Timoshenko VYu, Kashkarov PK, Fang GY, Li CF. Laser Phys Lett. 2008;5:894. [Google Scholar]
- 16.Jiang XS, Chen S, Chen JX, Zhu XQ, Zheng LQ, Zhuo SM, Wang DJ. Laser Phys. 2011;21:1661. [Google Scholar]
- 17.Piskunov NA, Maslennikov ED, Golovan LA, Kashkarov PK, Ostapenko IA, Rodt S, Bimberg D. Laser Phys. 2011;21:614. [Google Scholar]
- 18.Ozeki Y, Itoh K. Laser Phys. 2010;20:1114. [Google Scholar]
- 19.Zheltikov AM. Laser Phys Lett. 2004;1:468. [Google Scholar]
- 20.Arakcheev VG, Valeev AA, Morozov VB, Olenin AN. Laser Phys. 2008;18:1451. [Google Scholar]
- 21.Mitrokhin VP, Fedotov AB, Ivanov AA, Alfimov MV, Zheltikov AM. Opt Lett. 2007;32:3471. doi: 10.1364/ol.32.003471. [DOI] [PubMed] [Google Scholar]
- 22.Namboodiri V, Scaria A, Namboodiri M, Materny A. Laser Phys. 2009;19:154. [Google Scholar]
- 23.Bergner G, Vater E, Akimov D, Schlücker S, Bartelt H, Dietzek B, Popp J. Laser Phys Lett. 2010;7:510. [Google Scholar]
- 24.Bergner G, Akimov D, Schlücker S, Bartelt H, Dietzek B, Popp J. Laser Phys Lett. 2011;8:541. [Google Scholar]
- 25.König K, Breunig HG, Bückle R, Kellner-Höfer M, Weinigel M, Büttner E, Sterry W, Lademann J. Laser Phys Lett. 2011;8:465. [Google Scholar]
- 26.Koonath P, Solli DR, Jalali B. Opt Lett. 2010;35:351. doi: 10.1364/OL.35.000351. [DOI] [PubMed] [Google Scholar]
- 27.Yakovlev VV, Raman J. Spectrosc. 2003;34:957. [Google Scholar]
- 28.Yakovlev V, Petrov GI. Opt Express. 2005;13:1299. doi: 10.1364/opex.13.001299. [DOI] [PubMed] [Google Scholar]
- 29.Arora R, Petrov GI, Liu J, Yakovlev VV. J Biomed Opt. 2011;16:021114. doi: 10.1117/1.3533317. [DOI] [PMC free article] [PubMed] [Google Scholar]
- 30.Arora R, Petrov GI, Yakovlev VV. J Biomed Opt. 2011;16:021116. doi: 10.1117/1.3541796. [DOI] [PMC free article] [PubMed] [Google Scholar]


