Abstract
Previously reported studies indicate that aluminum nanostructured substrates can potentially find widespread use in metal-enhanced fluorescence (MEF) applications particularly in the UV or near-UV spectral region toward label-free detection of biomolecules. MEF largely depends on several factors, such as chemical nature, size, shape of the nanostructure and its distance from the fluorophore. A detailed understanding of the MEF and its distance-dependence are important for its potential application in biomedical sensing. Our goal is to utilize intrinsic protein fluorescence for label-free binding assays. This is made possible by the use of metallic nanostructures which provide localized excitation and enhanced fluorescence of UV fluorophores and will also provide a way to separate the surface-bound proteins from the bulk samples. We evaluated varied probe distances from plasmonic nanostructures by the well-established layer-by-layer (LbL) technique. The investigated proteins were adsorbed on different numbers of alternate layers of poly(styrene sulfonate) (PSS) and poly(allylamine hydrochloride) (PAH). Bovine serum albumin (BSA) was electrostatically attached to the positively charged PAH layer, and goat and rabbit IgG were attached to negatively charged PSS layer. We obtained a maximum of a ~ 9 fold increase in fluorescence intensity from BSA at a distance of ~9 nm from the Al nanostructured surface. Approximately 6- and 7- fold increases were observed from goat and rabbit IgG at a distance of ~8 nm, respectively. The minimum lifetimes were about 3-fold shorter than those on bare control quartz slides for all three proteins. The time-resolved intensity decays were analyzed with a lifetime distribution model to understand the distance effect on the metal–fluorophore interaction in detail. The present study indicates the distance dependence nature of metal-enhanced intrinsic fluorescence of proteins and potential of LbL assembly to control the metal-to-fluorophore distance in the UV wavelength region.
1. INTRODUCTION
Bioaffinity assays are used extensively in all aspects of biomedical research including proteomics, clinical diagnostics, and drug discovery. Most of these assays depend on the use of extrinsic fluorophores which are used to label the molecules and to provide protein-specific signals which are distinct from the emission from other proteins in the sample. While this approach has been successful there is a growing interest in label-free detection (LFD) to avoid the need for labeling reactions, which become increasingly costly and complicated as the number of biomarkers continues to increase. Almost all proteins contain at least one tryptophan (trp) residue, and a typical protein contains about 5 trp residues.1 Hence it would be valuable to detect specific protein using their intrinsic tryptophan fluorescence. However, the main problem is that other proteins in the sample will also emit and interfere with specific detection of the protein of interest.
Because of these mentioned problems LFD methods are becoming more widely used.2 Several approaches to label-free detection are being used and are under development including surface plasmon resonance (SPR),3,4 surface enhanced Raman scattering,5 electrochemical approaches,6 nanowires,7 optical microcavities,8 interferometry,9 and photonic crystals.10 Among these techniques, the most widely developed and known is surface plasmon resonance (SPR), which is being extended to high-throughput capabilities by the use of imaging modality. Most methods for label-free detection share a similar property with SPR, which is a dependence on the change in biomolecular mass at the interface between sample and surface affinity. In the case of SPR these are the resulting changes in measurements of the refractive index at the interface.11,12
Over the past several years we have performed many experiments of the interactions of fluorophores with metallic surfaces and particles. Metal-enhanced fluorescence (MEF) phenomenon is a complex phenomenon that is comprised of the simultaneous interplay of both enhancements in the emission intensity of the probes due to enhanced radiative pathways induced by the metal as well as quenching of the probe emission that can occur due to nonradiative energy transfer to the metal. Our previous studies were performed mostly with silver nanoparticles or silver nanostructured surfaces. On the basis of these studies we observed significant increase in the brightness and photostability of fluorophores. The improvements in brightness and/or photostability are the result of interactions of the incident light with the metal and interactions of the excited fluorophores with the metal. A subwavelength metallic particle can enhance the local field near its surface. The local fields are increased because the optical cross sections of metal colloids are many-fold larger than their physical cross sections.13,14 These local fields result in increased rates of excitation of nearby fluorophores. As a result the cross sections for fluorophore excitation can become larger than is possible with far-field illumination. A second and perhaps more important effect occurs for excited state fluorophores which are close to metal surfaces. Interaction of these fluorophores with plasmons on the particle surfaces result in increased rates of emission. This is a remarkable effect because the radiative rates of fluorophores is determined by the extinction coefficients15 which is essentially unchanged in classical fluorescence experiments. In these experiments the changes in intensity, lifetime, or quantum yield are due to changes in the rates of nonradiative decay, quenching or energy transfer. The radiative decay rates for fluorophores near metals can be increased by coupling with plasmons.16,17 Increases in radiative decay rate result in higher quantum yields, shorter lifetimes, and increased photostability.18 The photostability can be increased because a shorter lifetime allows less time for adverse reactions to occur in the excited state and thus more excitation–emission cycles prior to photobleaching.
We believe it is possible to develop a simple method using metallic nanostructures which will allow specific label-free detection of proteins binding to surfaces, potentially without the need for washing steps. Our approach is based on our recent results which showed that UV fluorescence can be enhanced near aluminum (Al) surfaces and particles. Although the mechanism of the metal-enhanced fluorescence is still not completely understood, the use of metallic nanostructures for enhancement in intrinsic fluorescence signal from proteins has considerable potential in biochemical research. This is a first study to investigate the distance-dependence nature of MEF using intrinsic protein fluorescence in the UV wavelength region on aluminum nanostructures. The use of metal-enhanced fluorescence (MEF) requires an understanding of the optimal distance between the fluorophore and the metallic surface for enhanced fluorescence. The MEF phenomenon is based on short-range interactions of fluorophores with metallic nanostructures that, depending on the metal geometry, occur at distances from 5 to 100 nm.19–23 To understand the effect of metal nanostructures on nearby fluorophores, it is desirable to study systems with well-defined metal–fluorophore distances.24 Positioning a probe at a particular distance can be accomplished using the Langmuir–Blodgett (LB) film deposition technique or layer-by-layer (LbL) assembly. LbL assembly is an alternative to the complex LB method; also LbL assembly can be accomplished with water-soluble proteins. LbL assembly is based on physisorption from solution and exploits electrostatic attraction between oppositely charged polymers. The LbL assembly of oppositely charged polyions allows films to be built up on linear polyions, proteins, charged small fluorophores, and nanoparticles with precise location of the components in the multilayer.25
In previous studies, we used finite-difference time domain (FDTD) calculations to show the effect of aluminum nanoparticles on fluorophore emission in the UV. A variety of nanoparticle sizes, fluorophore-particle distances, and fluorophore orientations relative to the aluminum surface were investigated by modeling the excited fluorophore as a radiating dipole source. Our studies indicated (1) the spherical aluminum nanoparticles enhance the radiated power of a fluorophore for a wide range of wavelengths, 100–450 nm; (2) the maximum enhancements occurred when the fluorophores are oriented perpendicular to the aluminum surface; (3) when the fluorophore is oriented parallel to the metal surface, we observe quenching of the radiation in most cases. The fluorophore–metal distance and orientation of fluorophore to the metal surface plays an important role in obtaining the overall enhancement. We observed that the extent of enhancement is a function of the fluorophore-metal distance, with larger separation distances showing lower enhancements. The FDTD calculations indicated that the near-field induced by the dipole is not enhanced between the particle and the dipole but shows the largest enhancement for the far or distal side of the particle relative to the dipole. The regions of near-field enhancements extend tens of nanometers away from the aluminum nanoparticle.21,22 These results revealed the potential of Al nanostructure for label-free protein binding assay.
In this paper, we report the distance dependence of MEF from several proteins assembled on our Al nanostructured surfaces. We explored the potential of LbL assembly to place proteins at varied distances from nanostructured surfaces. In this LbL assembling process, multilayerd structures of poly-(styrene sulfonate) (PSS) and poly(allylamine hyrochloride) (PAH) are fabricated in a well-defined and controllable manner. Subsequently, goat and rabbit immunoglobulins (IgG) are integrated into the topmost negatively charged PSS layer. BSA is incorporated into the positively charged PAH layer. A detailed exploration using steady-state and time-resolved fluorescence spectroscopy has been carried out to reveal the effect of distance on the MEF by aluminum nanostructures. Our experimental results showed that aluminum nanostructures are promising for high sensitivity MEF detection of target proteins bound to metallic nanostructures, potentially in the presence of other unbound tryptophan-containing proteins at the UV wavelength range. Our approach is based on the short-range interactions of fluorophores with metallic particles and surfaces. Hence a distant-dependent study is clearly warranted to develop MEF based bioassay in the UV wavelength range utilizing the intrinsic fluorescence of proteins.
2. EXPERIMENTAL METHODS
Materials
Aluminum slugs and silicon monoxide, sodium salts of PSS (MW 70000), PAH (MW 50000–65000), (aminopropyl) triethoxysilane (APS), and phosphate buffer solution at pH 7.2 were obtained from Sigma-Aldrich-Fluka and used as received. Bovine serum albumin (BSA), goat and rabbit immunoglobulins (IgG) were all obtained from Sigma. Ultrapure water (>18.0 MΩ) purified using a Millipore Milli-Q gradient system was used in preparation of buffers and aqueous solutions.
Metallic Substrate Preparation
Quartz slides were cleaned with “piranha solution” (35% H2O2/H2SO4, 1:3) overnight, rinsed with distilled deionized water, and dried with air before thermal vacuum deposition steps. Aluminum was deposited on quartz slides using an Edwards Auto 306 vacuum evaporation chamber under high vacuum (<5 × 10⁻⁷ Torr). In each case, the metal deposition step was followed by the deposition of 5 nm silica via evaporation of silicon monoxide without breaking the vacuum. The silica layer allowed for comparable surface chemistry for both the Al-coated and bare glass region of the quartz substrates. The deposition rate was adjusted by the filament current and the thickness of film was measured with a quartz crystal microbalance. After coating steps, slides were silanized by immersion in an ethyl alcohol solution of 1% of APS.
Prepared Al substrates were observed in Hitachi SU-70 scanning electron microscope directly. Because of the nonconductive substrate (SiO2), ultralow voltage was employed for high-resolution shallow surface observation and imaging using beam deceleration technology. Sample was surveyed at low magnifications to see the general features and the homogeneity. Representative area was selected for higher magnification investigation.
Immobilization of Polyelectrolyte Layers and Proteins
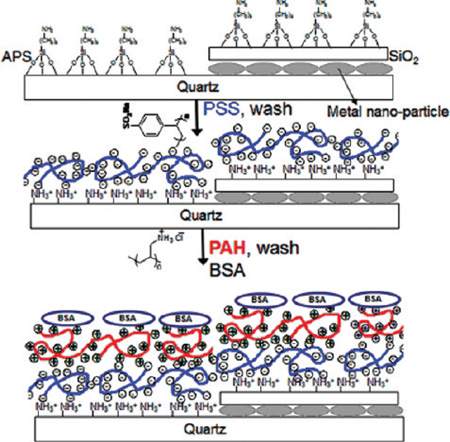
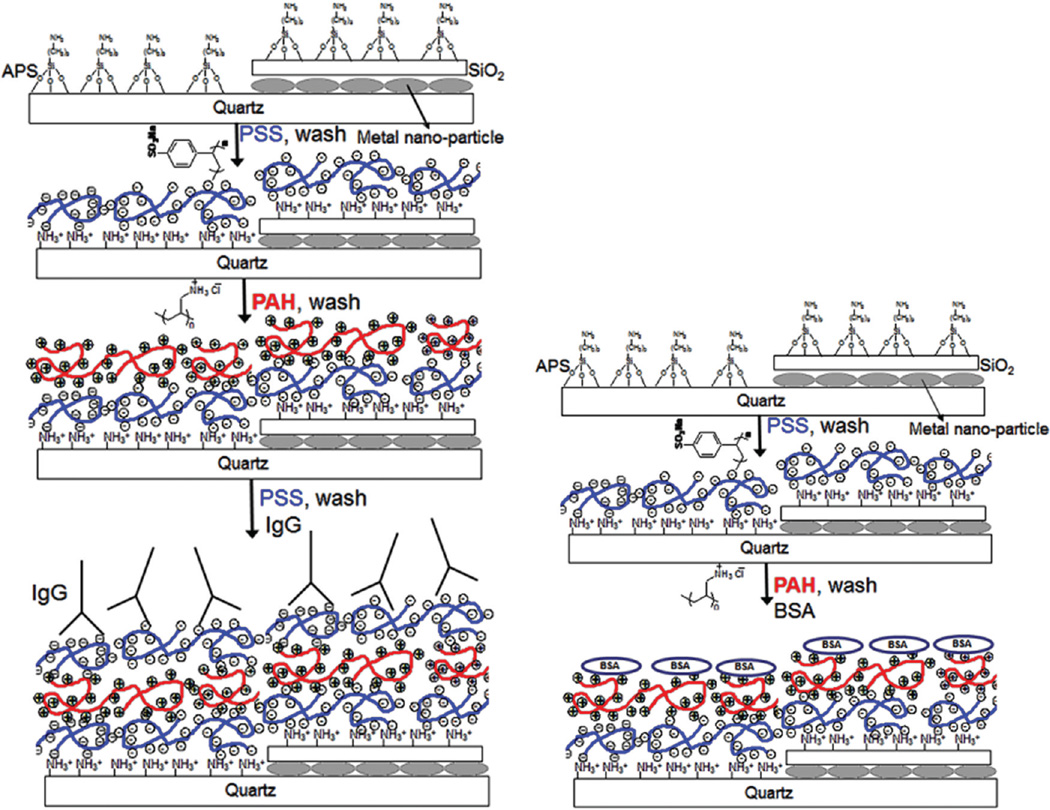
PSS and PAH were used to polyelectrolyte LbL assembly at concentrations of 3 and 2 mg/mL, respectively. Immobilization of PSS/PAH on functionalized quartz or aluminum substrates was carried out manually according to our previous report.25 Each PSS/PAH layer assembly provides 2.1 nm distance from the surface.25 Figure 1 shows the schematic representation of multilayers. One to seven layers of PSS and PAH were prepared by adsorption of both polyelectrolytes consecutively. BSA, rabbit-IgG, and goat-IgG solutions (100 µg/mL) in phosphate buffer (pH 7.2) were added onto the completely dried surfaces. PSS terminated slides were used for immobilization of rabbit and goat IgG’s, and PAH terminated slides were used for BSA immobilizations. The same procedure was used for preparation of control samples using bare quartz slides. After incubation with protein solutions, slides were washed with phosphate buffer solution to remove unbound protein solutions.
Figure 1.
Schematic representation of metallic nanostructured surfaces and LbL assembly.
Spectroscopic Measurements
Fluorescence spectra of proteins on mono- and multipolyelectrolyte layers were recorded using a Varian Cary Eclipse fluorescence spectrophotometer and compared with the signal of the respective samples on bare quartz. Both the steady-state and time-domain lifetime measurements were carried out using front face illumination. Special sample slide holders were made for these measurements. Fluorescence measurements of the samples on quartz and Al slides were performed by placing the slides vertically with 30° angle. Time-domain lifetime measurements were performed using a Pico-Quant lifetime fluorescence spectrophotometer (Fluotime 100). The excitation source was a light emitting diode (LED) with a 20 MHz repetition rate at 280 nm. Intensity decays were measured through a bandpass 335–380 nm filter.
Fluorescence intensity decays are usually described as the sum of individual exponentials. The intensity decay following δ-function excitation is described by26
| (1) |
where τi are the individual decay times and αi are the associated pre-exponential factors. The fractional contribution of the i-th component to the total emission is written as
| (2) |
We have normalized the values of αi and fi so that Σiαi= 1.0 and Σi fi = 1. The average lifetime is given by
| (3) |
and the amplitude-weighed lifetime is described as
| (4) |
The values of αi and τi were obtained using PicoQuant Fluofit 4.1 software (Professional Version) with the deconvolution of the instrumental response function (IRF) and nonlinear least-squares fitting. The goodness-of-fit was judged by the value of reduced χ2.
We also used an alternative model to analyze the intensity decay in which the αi values are not discrete amplitudes at τI but rather are described by a continuous distribution of α(τ). The intensity decay analysis reveal components of each lifetime τ with an amplitude α(τ). The component with each individual τ value is given by26
| (5) |
The total decay law is the sum of the individual decays weighed by the amplitudes
| (6) |
Considering a Gaussian distribution, the α(τ) is given by
| (7) |
where τ̅ is the central value of the distribution and σ is the standard deviation of the Gaussian. For a Gaussian distribution, the full width at half-maximum is given by 2.354σ.27
RESULTS AND DISCUSSION
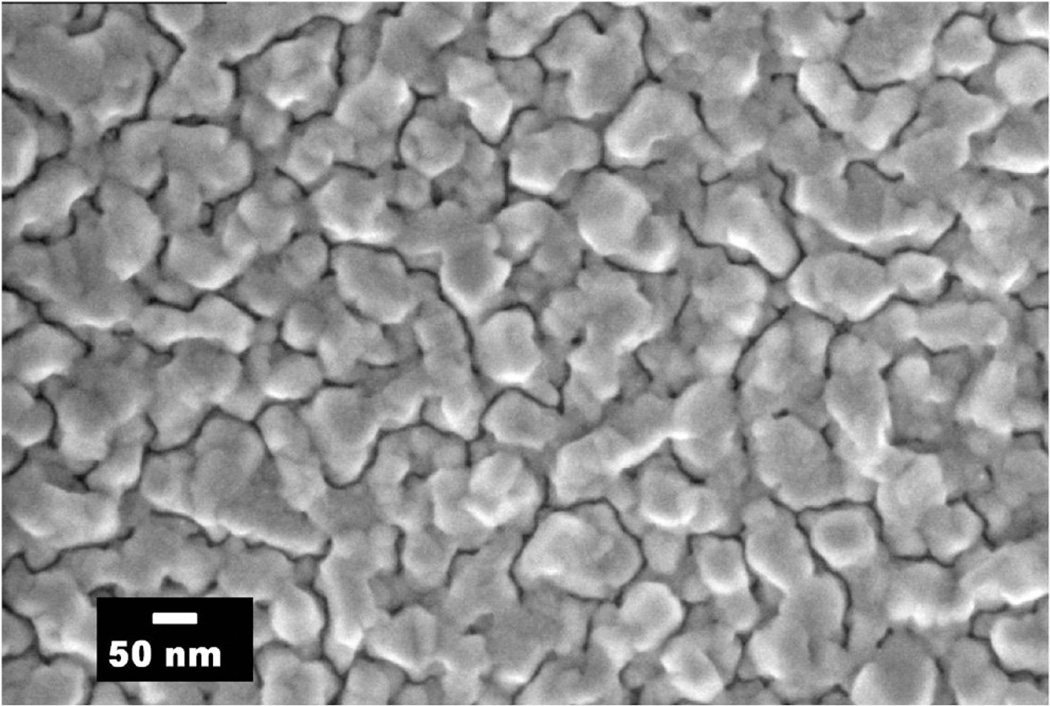
The field emission scanning electron microscopy (FE-SEM) image of a 10 nm thick aluminum film is shown in Figure 2. The SEM image reveals that the film is not continuous and aluminum forms nanoparticles of various shapes and sizes when evaporated on the quartz substrate, with an average particle size of approximately 50 nm (a rough estimate).21
Figure 2.
SEM micrographs of 10 nm thick aluminum evaporated on quartz substrate.
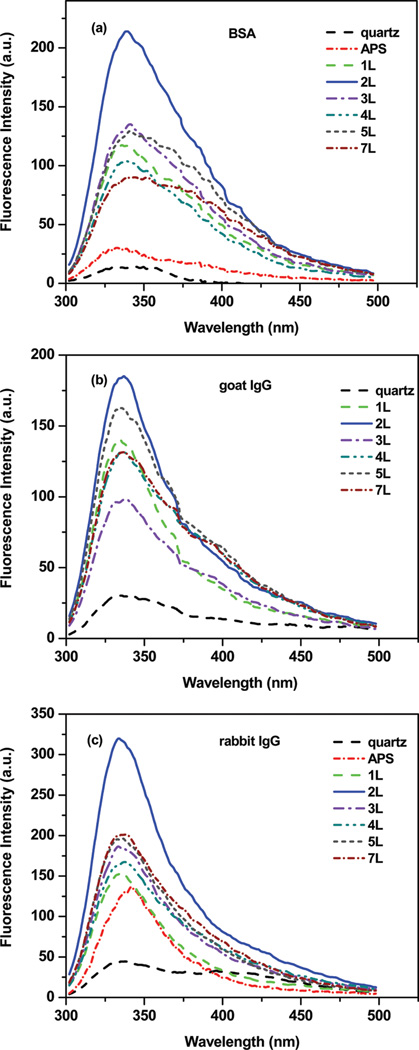
To explore the distance-dependence MEF of proteins, we performed systematic sets of experiments on protein-adsorbed PSS/PAH nanocomposites assembled on both Al and quartz surfaces, where the protein distance is varied from 5 to 20 nm. Figure 3 shows the fluorescence emission spectra from protein-adsorbed PSS/PAH layers with maximum intensities at varied probe distances from the Al surface. The fluorescence emission intensities of proteins show a strong dependence of distance from the Al surfaces. The fluorescence spectra and emission intensities from the protein-adsorbed PSS/PAH nanocomposites at different distances from the quartz surfaces are similar.
Figure 3.
Effect of BSA (a), goat IgG (b), and rabbit IgG (c) to Al surface distances on the fluorescence intensity.
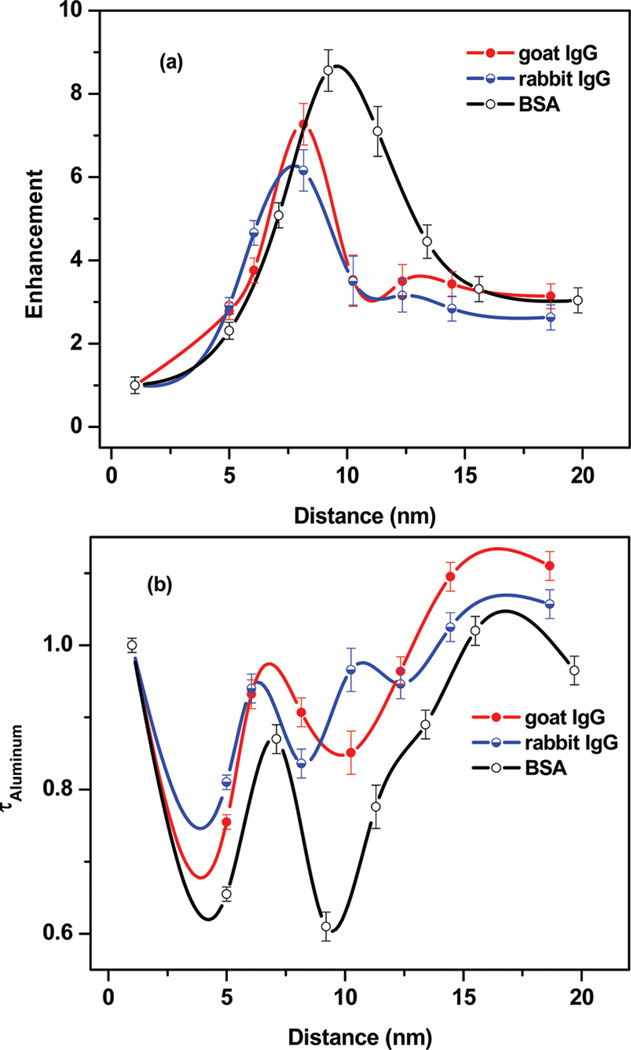
The enhancement factors (the ratios between the integrated areas under the spectral region) of proteins on Al substrates over quartz surfaces are plotted as a function of the metal fluorophore distance (Figure 4a). The largest enhancement of ~9-fold is observed for the BSA-adsorbed PSS/PAH nanocomposite with the probe distance of 9.2 nm from the Al surface. Approximately 6-fold and 7-fold increases in fluorescence intensities of goat and rabbit IgG on metallic nanocomposites were observed with the probe distance 8.2 nm, respectively. Above 9 nm the intensity relative to the quartz surfaces decreases progressively with an increase in the number of PSS/PAH layers to an enhancement near 3-fold for all of the proteins for 7 layers of the PSS/PAH assembly. Interestingly, we have also observed a monotonic reduction in the fluorescence intensity (from 9-fold to 2.3-fold) with a decrease in the probe distance from 9.2 to 5 nm. The present study shows that the MEF of proteins are distance-dependent and the distance needed for maximal fluorescence enhancement. The decrease in the fluorescence enhancement below 9.2 and 8.2 nm distances from the metalized surfaces could be related to the usual quenching of emission when the fluorophores are in close proximity to the metals.
Figure 4.
The effect of the probe distance on the fluorescence enhancement (a) and the amplitude-weighted average lifetimes of proteins (b).
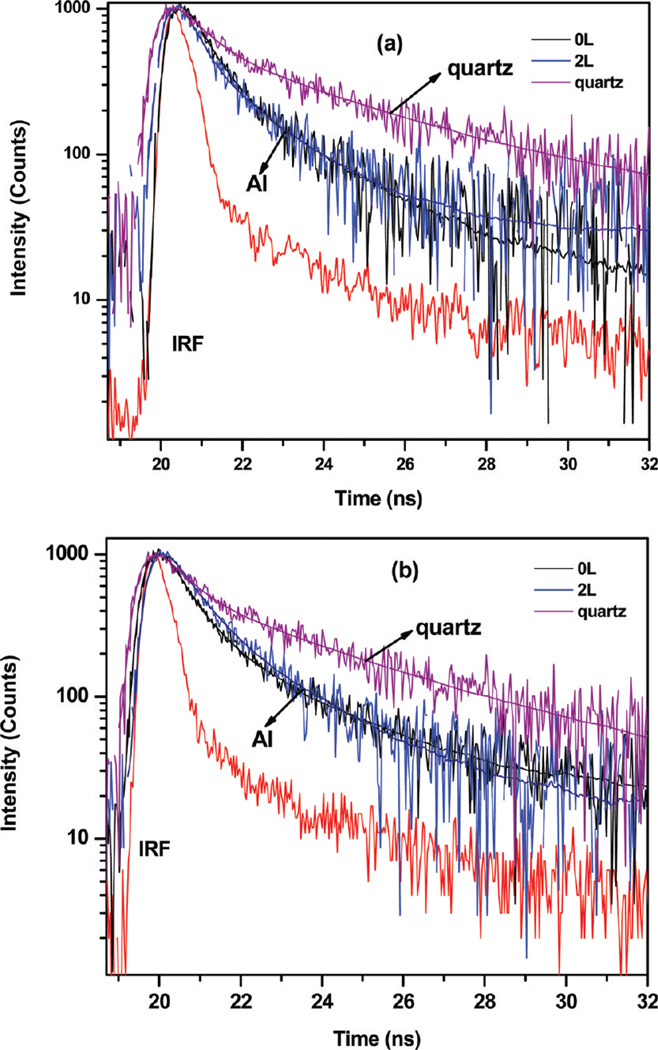
Time-resolved fluorescence can reveal valuable information about how each protein is affected by the interactions with its substrate or other macromolecules. The lifetimes of proteins on PSS/PAH nanocomposites on quartz and aluminum surfaces provide more understanding on distance-dependent metal-fluorophore interactions. We investigated the fluorescence intensity decays for all protein-adsorbed PSS/PAH nanocomposites assembled on both Al and quartz surfaces. Proteins could show multiexponential decays on heterogeneous surfaces. In this case the time-dependent data could not fit to a single decay time. Table 1 shows fitted parameters for intensity decays of studied proteins. α1, α2, τ1, and τ2 values were obtained by data analysis of double-exponential decay. α values are called the pre-exponential factors in a multiexponential intensity decays. For the same fluorophore in different environments, the values of α represent the fractional amount of fluorophore in each environment.26 Fluorescence intensity decays of BSA and goat IgG on aluminum and quartz are showed in Figure 5. Rabbit IgG exhibits similar behavior with goat IgG (not shown). The intensity decays of tryptophan residues in IgGs and BSA are faster on the aluminum substrate compared to that on bare quartz. The average lifetimes for three proteins adsorbed at different distances on aluminum nanocomposite surfaces are shown in Figure 3b. The amplitude-weighted average lifetimes of BSA, rabbit IgG, and goat IgG on aluminum substrates are 0.61, 0.84, and 0.85 ns, respectively, which represent a 2–3-fold decrease on aluminum. The short lifetime on the aluminum nanoparticles/nanostructures supports the notion that at least part of the increased in observed fluorescence intensity is due to the enhanced radiative rate by the plasmon-fluorophore complex.
Table 1.
Fitted Parameters for Intensity Decays of Studied Proteins
| protein | no. PSS/ PAH layer |
intensity enhancement factor |
α1 (%) |
τ1 (ns) |
α2 (%) |
τ2 (ns) |
τ̅ (ns) | χ2 |
|---|---|---|---|---|---|---|---|---|
| BSA | 0 | 2.3 | 25 | 1.53 | 75 | 0.36 | 0.65 | 1.02 |
| 1 | 5.1 | 10 | 2.75 | 90 | 0.66 | 0.87 | 1.06 | |
| 2 | 8.6 | 23 | 1.53 | 77 | 0.34 | 0.61 | 1.02 | |
| 3 | 7.1 | 12 | 2.42 | 88 | 0.54 | 0.77 | 1.12 | |
| 4 | 4.5 | 13 | 2.80 | 87 | 0.60 | 0.89 | 1.09 | |
| 5 | 3.3 | 12 | 3.49 | 88 | 0.68 | 1.02 | 1.18 | |
| 7 | 3.0 | 85 | 0.62 | 15 | 2.78 | 0.96 | 0.87 | |
| goat IgG | 0 | 2.8 | 16 | 2.03 | 84 | 0.52 | 0.77 | 1.19 |
| 1 | 3.8 | 18 | 2.29 | 82 | 0.62 | 0.93 | 1.01 | |
| 2 | 7.3 | 24 | 1.92 | 76 | 0.58 | 0.90 | 0.94 | |
| 3 | 3.5 | 18 | 2.09 | 82 | 0.57 | 0.85 | 1.03 | |
| 4 | 3.5 | 16 | 2.54 | 84 | 0.66 | 0.96 | 0.96 | |
| 5 | 3.4 | 18 | 2.74 | 82 | 0.73 | 1.09 | 1.02 | |
| 7 | 3.1 | 12 | 3.49 | 88 | 0.78 | 1.11 | 0.98 | |
| rabbit IgG | 0 | 2.9 | 15 | 1.98 | 85 | 0.59 | 0.81 | 1.09 |
| 1 | 4.7 | 16 | 2.57 | 84 | 0.63 | 0.94 | 1.00 | |
| 2 | 6.2 | 28 | 1.71 | 72 | 0.49 | 0.84 | 0.96 | |
| 3 | 3.5 | 27 | 1.88 | 73 | 0.63 | 0.97 | 1.04 | |
| 4 | 3.2 | 15 | 2.30 | 85 | 0.69 | 0.94 | 0.90 | |
| 5 | 2.9 | 23 | 2.17 | 77 | 0.70 | 1.03 | 0.96 | |
| 7 | 2.6 | 15 | 2.52 | 85 | 0.79 | 1.05 | 0.99 |
Figure 5.
Intensity decays of (a) BSA and (b) goat IgG on quartz, Al, and PSS/PAH nanocomposites.
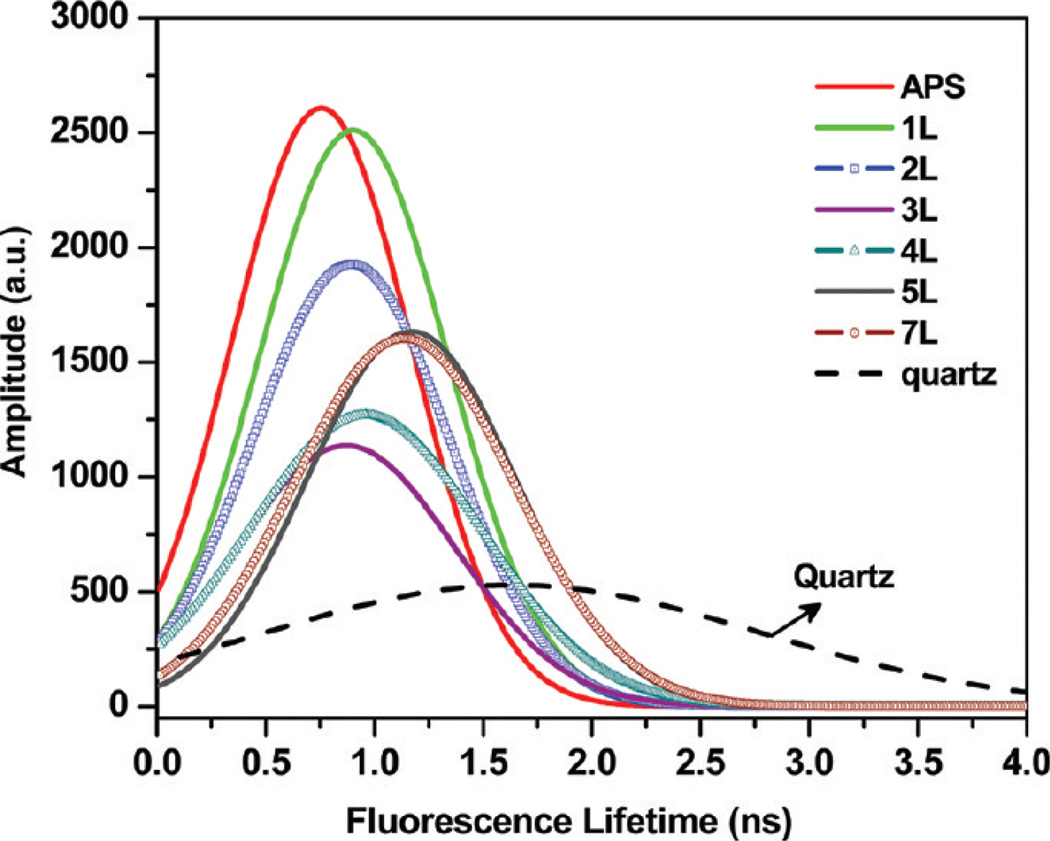
In some cases a decay-time distribution analysis provides a valuable method to analyze complex intensity decay. This alternative method is especially useful for fluorophores in complex and/or heterogeneous environments. We have performed a study on the lifetime distributions of the probe incorporated in the PSS/PAH nanocomposite assembly on glass and quartz surfaces. We have observed similar distributions of protein molecules for different distances from the quartz substrate (not shown). The lifetime distribution of the goat IgG incorporated in the LbL assembly on quartz surfaces is shown in Figure 6, which show a peak amplitude at 1.6 ns. A peak amplitude lifetime distribution around 750 ps is observed when the goat IgG molecules are directly on the Al surface. The measured lifetime distributions of the goat IgG probe, as presented in Figure 6, show an interesting trend when assembled on the Al nanostructured surface and are generally the center of the short (major) lifetime distribution shifts toward longer lifetimes with an increase in the distance between metal and fluorophores. The full width at half maxima (fwhm) of the Gaussian distributions on Al surfaces are systematically increased as a function of the increasing distance between the metal and fluorophores. The lifetime distributions on Al nanocomposite substrates are significantly different from than that on quartz. The center of the lifetime distribution is indicative of the average microenvironments experienced by the fluorophores, while the distribution width is related to the range of environments. The distributions suggest a range of environments for goat IgG on Al nanocomposites.
Figure 6.
Fluorescence lifetime distributions of the goat IgG monolayer at multiple distances from the Al surface. A lifetime distribution of the goat IgG monolayer on a glass substrate is also included for comparison.
In general, the quantum yield and lifetime of a fluorophore are described as28,29
| (8) |
| (9) |
where Γ and knr are the radiative and nonradiative decay rates, respectively. In proximity to the metallic surfaces and/or particles, eqs 9 and 10 are modified as
| (10) |
| (11) |
The radiative decay rate is increased to NrΓ in the presence of plasmonic metal nanostructures. knr′ is the nonradiative decay rate in the presence of metal particles. The ratio of fluorescence quantum yields in the presence and absence of metal is interrelated as
| (12) |
The changes in the rates of emission (Nr) and excitation (Nex) as a function of the metal–fluorophore distance (d) could be written as
| (13) |
| (14) |
Rr and Rex are the characteristic distances over which Nr and Nex decrease to 1/e exponentially. The measured emission intensity with (Im) or without (I0) metal could be related as
| (15) |
By combination of eqs 13–16, the total fluorescence intensity could more explicitly be written as
| (16) |
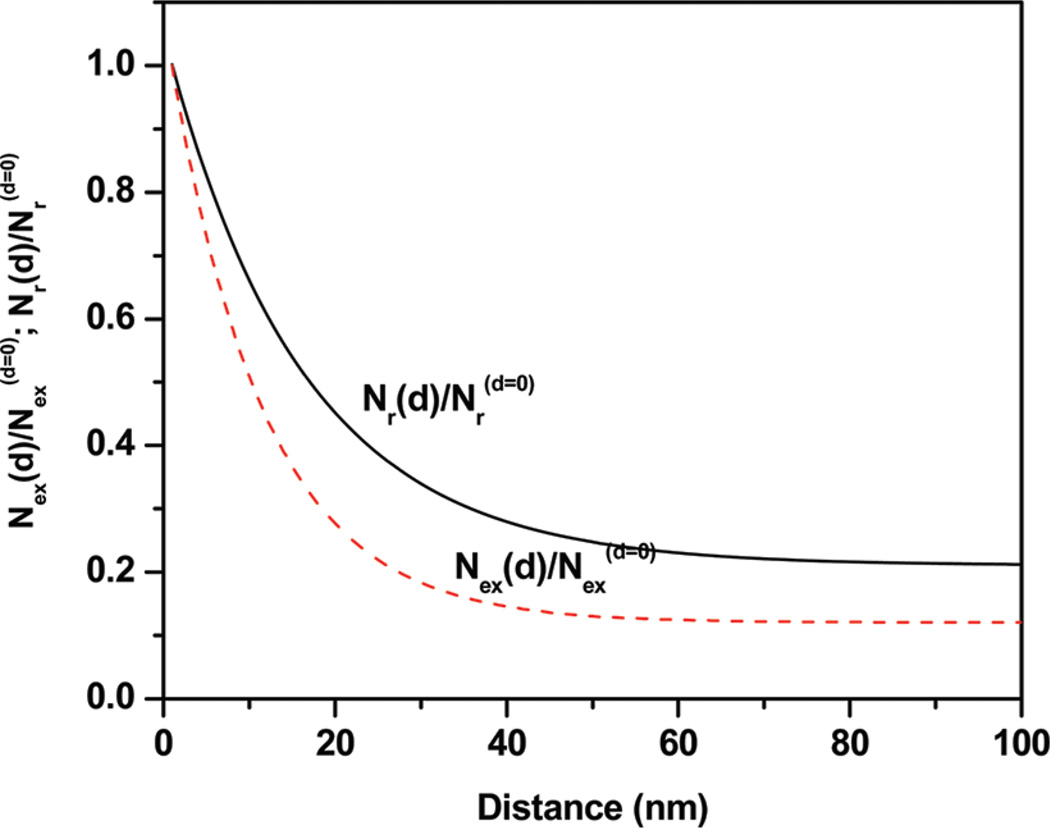
We analyzed our experimental steady-state intensities and fluorescence lifetimes data of proteins at various distances from the plasmonic metal-nanostructured surfaces. By fitting the experimental steady-state and time-resolved data with eq 16, the values of the free parameters Nrd=0 = 4, Nexd=0 = 8, Rr = 16 nm, and Rex= 10 nm were obtained. Furthermore, our analysis reveals that the rate of excitation is increased by a factor of 8 and arises at a distance of 10 nm, whereas the increase in the radiative decay rate is 4-fold and this increase continues over a distance of ~16 nm. The radiative decay and excitation rates were extracted from the spectral parameters and are plotted as a function of metal–fluorophore distance, as shown in Figure 7. These rates were obtained from eqs 13 and 14 and the measured spectral parameters. It is apparent from the normalized distance-dependent plot that the increases in radiative decay occur up to a distance of ~30 nm and the enhanced excitation takes place below ~20 nm.
Figure 7.
Normalized rate of excitation [Nex(d)/Nexd=0] and rate of radiative decay [Nr(d)/Nrd=0] as a function of the distance from the metal surface.
CONCLUSIONS
This study clearly shows that the fluorescence intensities and radiative decay rates vary as a function of the aluminum nanoparticle–fluorophore distance. We used the LbL assembly technique to control the metal–fluorophore distance. We investigated the steady-state and time-resolved fluorescence spectral property of BSA, goat IgG, and rabbit IgG at various distances from the aluminum-nanostructured surfaces. To examine the distance dependence of MEF, BSA was electrostatically attached to the positively charged PAH layer, and goat and rabbit IgG were attached to the negatively charged PSS layer. Experimental results show that the maximum fluorescence enhancements occur at distance about 8–9 nm from the metal-nanostructured surface. To unravel the heterogeneity in the distribution of proteins on metallic nanostructured surfaces, lifetime distributions are obtained from fluorescence decay curves. This lifetime distribution analysis is a useful tool in the surface photophysical studies especially when the fluorophores are located in proximity to the heterogeneous plasmonic nanostructured surfaces. The present systematic study provides improved understanding of the interaction between plasmonic nanostructures and intrinsic fluorescence or proteins at the UV region of the spectrum and their distance dependence nature, where we used robust, easy, and inexpensive alternate electrostatic LbL assembly as a bottom-up nanofabrication technique to control the probe distance from the surface. The significance of our studies can be judged by the present widespread interest and demand for label-free bioaffinity assays. To enable easy use, we developed metal nanostructures by simple thermal evaporation. In contrast to SPR our approach will require only simple optics and using UV LEDs can be readily extended to many biomedical applications. The simple optical requirements also means that our approach can be used with typical fluorescence imaging instruments once they are modified for use with UV wavelengths.
ACKNOWLEDGMENTS
This work was supported by the National Institutes of Health (NIH) Grant Nos. NHGRI RO1 HG002655, R21 HG005090, and NIAID K25 AI087968. This investigation was also partially supported by The Scientific and Technological Research Council of Turkey (TUBITAK).
Footnotes
The authors declare no competing financial interest.
REFERENCES
- 1.Szcmacinski H, Ray K, Lakowicz JR. Anal. Biochem. 2009;385:358–364. doi: 10.1016/j.ab.2008.11.025. [DOI] [PMC free article] [PubMed] [Google Scholar]
- 2.Li Q, Seeger S. Appl. Spectrosc. Rev. 2010;45:12–43. [Google Scholar]
- 3.Yu X, Xu D, Cheng Q. Proteomics. 2006;6:5493–5503. doi: 10.1002/pmic.200600216. [DOI] [PubMed] [Google Scholar]
- 4.Cooper MA. Drug Discov. Today. 2006;11:1068–1074. doi: 10.1016/j.drudis.2006.10.001. [DOI] [PubMed] [Google Scholar]
- 5.Sun L, Yu C, Irudayaraj J. Anal. Chem. 2007;79:3981–3988. doi: 10.1021/ac070078z. [DOI] [PMC free article] [PubMed] [Google Scholar]
- 6.Vestergaard KK, Tamiya E. Sensors. 2007;7:3442–3458. doi: 10.3390/s7123442. [DOI] [PMC free article] [PubMed] [Google Scholar]
- 7.Patolsky F, Zheng G, Lieber CM. Nat. Protocols. 2006;1:1711–1724. doi: 10.1038/nprot.2006.227. [DOI] [PubMed] [Google Scholar]
- 8.Armani AM, Kulkarni RP, Fraser SE, Flagan RC, Vahala KJ. Science. 2007;317:783–786. doi: 10.1126/science.1145002. [DOI] [PubMed] [Google Scholar]
- 9.Varma MM, Inerowicz HD, Regnier FE, Nolte DD. Biosens. Bioelectron. 2004;19:1371–1376. doi: 10.1016/j.bios.2003.12.033. [DOI] [PubMed] [Google Scholar]
- 10.Mathias PC, Ganesh N, Chan LL, Cunningham BT. Appl. Opt. 2007;46:2351–2360. doi: 10.1364/ao.46.002351. [DOI] [PubMed] [Google Scholar]
- 11.Ray K, Szcmacinski H, Chowdhury MH, Lakowicz JR. Proc. SPIE. 2010;7577:75770K. doi: 10.1117/12.840412. [DOI] [PMC free article] [PubMed] [Google Scholar]
- 12.Frey BL, Jordan CE, Kornguth S, Corn RM. Anal. Chem. 1995;67:4452–4457. [Google Scholar]
- 13.Yguerabide J, Yguerabide EE. Anal. Biochem. 1998;262:137–156. doi: 10.1006/abio.1998.2759. [DOI] [PubMed] [Google Scholar]
- 14.Yguerabide J, Yguerabide EE. Anal. Biochem. 1998;262:157–176. doi: 10.1006/abio.1998.2760. [DOI] [PubMed] [Google Scholar]
- 15.Strickler SJ, Berg RA. J. Chem. Phys. 1962;37:814–822. [Google Scholar]
- 16.Lakowicz JR. Anal. Biochem. 2001;298:1–24. doi: 10.1006/abio.2001.5377. [DOI] [PMC free article] [PubMed] [Google Scholar]
- 17.Lakowicz JR. Anal. Biochem. 2005;337:171–194. doi: 10.1016/j.ab.2004.11.026. [DOI] [PMC free article] [PubMed] [Google Scholar]
- 18.Lakowicz JR, Shen Y, D’Auria S, Malicka J, Fang J, Gryczynski Z, Gryczynski I. Anal. Biochem. 2002;301:261–277. doi: 10.1006/abio.2001.5503. [DOI] [PMC free article] [PubMed] [Google Scholar]
- 19.Szcmacinski H, Badugu R, Lakowicz JR. J.Phys. Chem. C. 2010;114:21142–21149. doi: 10.1021/jp107543v. [DOI] [PMC free article] [PubMed] [Google Scholar]
- 20.Ray K, Szmacinski H, Lakowicz JR. Anal. Chem. 2009;81:6049–6054. doi: 10.1021/ac900263k. [DOI] [PMC free article] [PubMed] [Google Scholar]
- 21.Ray K, Chowdhury MH, Lakowicz JR. Anal. Chem. 2007;79:6480–6487. doi: 10.1021/ac071363l. [DOI] [PMC free article] [PubMed] [Google Scholar]
- 22.Chowdhury MH, Ray K, Gray SK, Pond J, Lakowicz JR. Anal. Chem. 2009;81:1397–1403. doi: 10.1021/ac802118s. [DOI] [PMC free article] [PubMed] [Google Scholar]
- 23.Chowdhury MH, Chakraborty S, Lakowicz JR, Ray K. J. Phys. Chem. C. 2011;115(34):16879–16891. doi: 10.1021/jp205108s. [DOI] [PMC free article] [PubMed] [Google Scholar]
- 24.Chen Y, Munechika K, Ginger DS. Nano Lett. 2007;7(3):690–696. doi: 10.1021/nl062795z. [DOI] [PubMed] [Google Scholar]
- 25.Ray K, Badugu R, Lakowicz JR. Chem. Mater. 2007;19:5902–5909. doi: 10.1021/cm071510w. [DOI] [PMC free article] [PubMed] [Google Scholar]
- 26.Lakowicz JR. Principles of Fluorescence Spectroscopy. 3rd ed. New York: Springer; 2006. [Google Scholar]
- 27.D’Auria S, Bazzicalupo P, Rossi M, Gryczynski I, Lakowicz JR. J. Fluoresc. 2000;10:27–33. doi: 10.1023/A:1009431428680. [DOI] [PMC free article] [PubMed] [Google Scholar]
- 28.Lakowicz JR. Anal. Biochem. 2001;298:1. doi: 10.1006/abio.2001.5377. [DOI] [PMC free article] [PubMed] [Google Scholar]
- 29.Lakowicz JR. Anal. Biochem. 2005;337:171. doi: 10.1016/j.ab.2004.11.026. [DOI] [PMC free article] [PubMed] [Google Scholar]


