

TC21 is a Ras-like GTPase with high sequence and signaling similarity with classic Ras subfamily proteins. However, its role in vivo remains obscure. Results found with the use of a TC21-knockout mouse show that TC21 plays specific roles in pubertal mammary gland development. This function is not redundant with those exerted by H- and N-Ras in the same tissue.
Abstract
R-Ras2/TC21 is a GTPase with high sequence and signaling similarity with Ras subfamily members. Although it has been extensively studied using overexpression studies in cell lines, its physiological role remains poorly characterized. Here we used RRas2-knockout mice expressing β-galactosidase under the regulation of the endogenous RRas2 promoter to investigate the function of this GTPase in vivo. Despite its expression in tissues critical for organismal viability, RRas2−/− mice show no major alterations in viability, growth rates, cardiovascular parameters, or fertility. By contrast, they display a marked and specific defect in the development of the mammary gland during puberty. In the absence of R-Ras2/TC21, this gland forms reduced numbers of terminal end buds (TEBs) and ductal branches, leading to a temporal delay in the extension and arborization of the gland tree in mammary fat pads. This phenotype is linked to cell-autonomous proliferative defects of epithelial cells present in TEBs. These cells also show reduced Erk activation but wild type–like levels of phosphorylated Akt. Using compound RRas2-, HRas-, and NRas-knockout mice, we demonstrate that these GTPases act in a nonsynergistic and nonadditive manner during this morphogenic process.
INTRODUCTION
R-Ras2/TC21 is a member of the Ras GTPase superfamily that was originally isolated during the PCR-mediated screening of Ras-related GTPases in a teratocarcinoma cell line (Drivas et al., 1990) and, some years later, during expression cloning approaches aimed at identifying human oncogenes present in ovarian tumors (Chan et al., 1994). By homology criteria, R-Ras2/TC21 belongs to the R-Ras subfamily, which includes two additional GTPases: R-Ras/R-Ras1 and R-Ras3/M-Ras (Colicelli, 2004). Within this subfamily, R-Ras2/TC21 is the GTPase that shows more structural similarity to the classic H-Ras, K-Ras, and N-Ras proteins (Drivas et al., 1990; Colicelli, 2004).
R-Ras2/TC21 was the focus of attention some years ago because, unlike the other R-Ras and Rap proteins, it displayed transforming activities similar to those exhibited by the conventional Ras subfamily proteins (Chan et al., 1994; Graham et al., 1994, 1999; Movilla et al., 1999; Rosario et al., 1999, 2001). This observation, coupled with the fact that mutations in its gene were found in some cancer cell lines (Chan et al., 1994; Huang et al., 1995; Barker and Crompton, 1998), led to the idea that R-Ras2/TC21 could be an alternative route to promoting tumorigenesis in tumors that did not have a constitutive activation of classic Ras GTPases. Consistent with that hypothesis, a number of studies also revealed that the RRas2 gene and/or its encoded protein was overexpressed in some cancer cell lines and/or tumors (Clark et al., 1996; Arora et al., 2005; Rokavec et al., 2008; Macha et al., 2009; Luo et al., 2010; Lee et al., 2011). However, we now know that the RRas2 gene is seldom mutated in human tumors (www.sanger.ac.uk/perl/genetics/CGP/cosmic?action=gene&ln=RRAS2), indicating that it is unlikely that it could represent an alternative way to activate Ras-dependent routes in tumors lacking Ras subfamily oncogenes.
Owing to its high transforming activity, the characterization of its signaling elements has been circumscribed so far to the use of active versions of the GTPase in cancer cell contexts. These studies have revealed that constitutively active R-Ras2/TC21 triggers critical biological processes for cancer cells, including proliferation (Graham et al., 1994, 1996, 1999; Movilla et al., 1999; Rosario et al., 1999), migration (Keely et al., 1999; Huang et al., 2004; Luo et al., 2010), epithelial–mesenchymal transition (Luo et al., 2010), and resistance to both chemotherapy (Rong et al., 2002; Mendes-Pereira et al., 2012) and anoikis (McFall et al., 2001). In addition, it promotes the activation of a number of Ras-like signaling routes, such as those regulated by Raf1/MEK/Erk (Movilla et al., 1999; Rosario et al., 1999), RalGDS/Ral (Lopez-Barahona et al., 1996; Rosario et al., 2001), p38 mitogen-activated protein kinase (Graham et al., 1994), c-Jun N-terminal kinase (Graham et al., 1994; Movilla et al., 1999), protein kinase Cɛ (Murphy et al., 2002; Kelley et al., 2004), and phosphatidylinositol-3 kinase (PI3-K; McFall et al., 2001; Rosario et al., 2001; Murphy et al., 2002; Rong et al., 2002). It should be noted, however, that other studies have argued against the involvement of Raf1-dependent (Graham et al., 1996, 1999; Light et al., 2002) and RalGDS-dependent (Murphy et al., 2002) routes in the transformation induced by R-Ras2/TC21. The reason for this discrepancy is unknown. Additional studies have shown that wild-type R-Ras2/TC21 shares the GDP/GTP exchange factors (GEFs; Graham et al., 1996; Movilla et al., 1999; Ohba et al., 2000; Calvo and Crespo, 2009) and GTPase-activating proteins (GAPs; Ohba et al., 2000) that catalyze the activation and deactivation steps of Ras proteins, respectively. R-Ras2/TC21 can be also targeted by Rap1-specific GEFs (i.e., C3G) and R-Ras1-specific GAPs (Ohba et al., 2000). These results suggest that R-Ras2/TC21 will be regulated during signal transduction by mechanisms and signals very similar to those used by cells to stimulate Ras subfamily GTPases.
In contrast to the wealth of information on the role of R-Ras2/TC21 in cancer-related biological processes, very little is known about its physiological role in vivo. To address this issue, we recently generated a strain of R-Ras2/TC21–deficient mice, using a retroviral insertion inactivation approach (Delgado et al., 2009). These mice display very low levels of RRas2 transcript and negligible amounts of its encoded protein, thus allowing the analysis of the role of this GTPase in vivo (Delgado et al., 2009). The analysis of those mice showed that R-Ras2/TC21 is important for the engagement of B-cell receptor tonic signals that, via the stimulation of PI3-Kδ, ensure the proper homeostasis of peripheral lymphocytes (Delgado et al., 2009). This GTPase is also critical for T-cell trogocytosis, a phagocyte-like mechanism that promotes the internalization of the T-cell receptor/antigen–major histocompatibility complex complexes from the immune synapse in a PI3-Kδ/RhoG–dependent manner (Martinez-Martin et al., 2011). In the present work, we used this mouse strain to investigate the potential role of R-Ras2/TC21 in additional physiological and/or developmental roles in vivo. This led us to discover that this GTPase is important for the proper development and morphogenesis of the mammary gland during puberty.
RESULTS
RRas2 is expressed from early developmental stages to adulthood
We used the previously described strain of RRas2 knockout mice to investigate the expression pattern of the RRas2 gene in vivo. These animals, which were generated by the insertion of a β-galactosidase–encoding retroviral construct downstream of the first exon of the RRas2 locus, can express β-galactosidase under the regulation of the endogenous RRas2 promoter when the mutant allele is in heterozygosis or homozygosis (Delgado et al., 2009). This property allows the detection of the expression of this gene using standard 5-bromo-4-chloro-3-indolyl β-d-galactopyranoside (X-gal)–based staining techniques (Nagi et al., 2003). Using this approach, we found that the expression pattern of RRas2 varies in complexity along embryonic development. Thus, using whole-mount embryos, we observed that the X-gal signals are specifically concentrated in the heart area at embryonic stages (E) 10.5 (Figure 1, A and B) and 11.5 (Figure 1, C and D). At E13.5, the expression pattern of R-Ras2/TC21 is more widespread, being detected in the heart, the spinal cord, and the finger precursors of both the hindlimb and forelimb footpads (Figure 1, E and F). However, the expression in those new sites was very transient, since at E14.5 the expression was concentrated again in the heart area (Figure 1G). At E16.5, the staining of embryonic sections with X-gal revealed that the RRas2 gene was expressed in the heart (Figure 1, H, I, and M), tooth buds (Figure 1H), kidneys (Figure 1H), thymi (Figure 1, J and M), lungs (Figure 1, K and M), intestine (Figure 1, H, L, and N), aorta (Figure 1, H and M), pulmonary artery (Figure 1M), and bladder (Figure 1N). Confirming the specificity of the staining, no X-gal signals were observed in RRas2+/+ embryos (unpublished data).
FIGURE 1:

RRas2 gene expression during mouse embryonic development. (A–F) Whole-mount X-gal staining of E10.5 (A, B), E11.5 (C, D), and E13.5 (E, F) RRas2+/− embryos to reveal the expression (blue) of the RRas2 gene. The heart (A–D, F), interdigital area (F), and spinal cord (E) are indicated by filled arrowheads, black arrows, and open arrowheads, respectively. Scale bars, 1 mm. (G, H) Sagittal sections of X-gal–stained E14.5 (G) and E16.5 (H) RRas2−/− embryos. Scale bars, 1 mm. In C–E, the signal seen in the head area is due to nonspecific diffusion of the X-gal staining. In G, the closed and open arrowheads signal the heart ventricle and atrium, respectively. In H, the closed and open arrowheads indicate the heart ventricle and intestine, respectively. The black and white arrowheads signal the thymus and lung, respectively. (I–L) Magnifications of heart (I), thymus (J), lungs (K), and intestine (L) areas present in X-gal/eosin–stained E16.5 RRas2+/− embryos. Scale bar, 50 μm. (M, N) Images of thoracic (with [M, inset] or without thymus [M, main panel]) and abdominal (N) regions of an E16.5 RRas2−/− embryo stained with X-gal in toto. a, aorta; b, bladder; i, intestine; l, liver; la, left atrium; lu, lung; lv, left ventricle; pa, pulmonary artery; ra, right atrium; rv, right ventricle; t, thymus. Scale bar, 500 μm.
To analyze the expression pattern of the RRas2 gene in postembryonic stages, we first analyzed the expression levels of its transcript in a number of tissues obtained from 3-mo-old mice using quantitative reverse transcription PCR (qRT-PCR). We found expression of the gene in many of the tissues surveyed, although they show marked differences in terms of overall mRNA levels. Tissues with the highest expression of the RRas2 mRNA included the lung and testis (Figure 2A). Tissues with moderate expression levels included different parts of the gut, the bladder, the white adipose tissue, the ovary, and, as expected (Delgado et al., 2009), hematopoietic tissues such as the thymus and spleen (Figure 2A). Other tissues, such as the heart, trachea, a number of glands (adrenal, salivary, mammary, bulbourethral), kidney, eyes, skin, and the brain, showed lower levels of expression (Figure 2A). Tissues with very low expression levels included the tongue, liver, skeletal muscle, and brown adipose (Figure 2A).
FIGURE 2:

Expression of the RRas2 gene in tissues of adult mice. (A) qRT-PCR analysis using total RNA from the indicated tissues (bottom) of a 3-mo-old RRas2+/+ mouse. BAT, brown adipose tissue; BG, bulbourethral gland; SSM, striated skeletal muscle; WAT, white adipose tissue. Expression values are given relative to levels found for the RRas2 transcript in the mammary gland (which were given an arbitrary value of 1). All values were normalized taking into consideration the expression levels of the housekeeping Gapdh mRNA in each sample. a.u., arbitrary units. (B–K) Cryostat sections obtained from the lung (B, C), testicle (D), ovarian corpus luteum (E), white adipose tissue (F), heart (G), aorta (H), mammary gland (I), duodenum (J), and bladder (K) of a 3-mo-old RRas2+/− mice were subjected to X-gal staining (blue) and counterstained with eosin (purple). In B and C, the closed arrowhead and asterisk signal the smooth muscle cells and alveolar cells, respectively. In C, open arrowheads indicate scattered X-gal–positive epithelial bronchial cells. In H, the closed arrowhead and asterisk signal vascular endothelial cells and smooth muscle cells, respectively. In I, the closed arrowhead indicates the outer ductal layer of myoepithelial cells. In J and K, the closed arrowheads and asterisks indicate the epithelial cells and muscle cell layer, respectively. Scale bars, 50 μm.
To obtain more information about the expression pattern of the RRas2 gene at the single-cell level in the adult period, we performed X-gal staining with selected tissues obtained from RRas2+/− mice. In the lung, we detected strong X-gal signals in smooth muscle cells and alveolar cells (Figure 2, B and C) and, to a lower extent, in a small percentage of cells present in the bronchial epithelium (Figure 2C). In the testis, the expression of the RRas2 gene was restricted to Sertoli cells (Figure 2D), a group of cells with nurturing functions for developing sperm cells that are located in seminiferous tubules. In the ovary, X-gal staining was localized in the corpus luteum (Figure 2E), a structure involved in the secretion of pregnancy-related hormones, and in its surrounding stroma (unpublished data). In white adipose tissue, the expression of the RRas2 gene was found in adipocytes (Figure 2F). In the cardiovascular system, we detected expression of RRas2 in cardiomyocytes (Figure 2G), arterial smooth muscle cells (Figure 2H), and vascular endothelial cells (Figure 2H). The tubules of the mammary gland displayed expression of R-Ras2/TC21 in the outer myoepithelial layer but not in the luminal layer of epithelial cells (Figure 2I). Finally, we detected strong X-gal staining in the smooth muscle cell and epithelial layers of both the duodenum (Figure 2J) and bladder (Figure 2K). Confirming that the X-gal staining obtained in RRas2+/− and RRas2−/− mice was specific, we detected no X-gal signals in tissue sections obtained from RRas2+/+ mice (unpublished data).
R-Ras2/TC21 is dispensable for the proper development and function of mouse organs
The wide expression pattern of the RRas2 gene raised the possibility that its encoded GTPase could exert critical functions in nonhematopoietic tissues. Despite the high expression levels found for RRas2 in the heart and lung (Figures 1 and 2), we could not see any major defect in the size, histological structure, and physiological function of those two organs in 3-mo-old RRas2−/− mice (Supplemental Figure S1A and unpublished data). The male and female reproductive systems were also functioning properly in the absence of R-Ras2/TC21, as assessed by the normal size of the litters obtained in crosses between male and female RRas2−/− mice (Supplemental Table S1). Despite the high levels of expression previously detected for the RRas2 gene in white adipocytes (Figure 2), we did not find any alteration in the number, size, or fat content of these cells in RRas2−/− mice (Supplemental Figure S1B). Similarly, we did not detect any alterations in the structure of arterial vessels (unpublished data), blood pressure levels (Supplemental Table S2), or heart rates (Supplemental Table S2) between RRas2−/− and control mice. We did not find any obvious sign of cardiovascular remodeling, pulmonary hypertension, heart fibrosis, or renal fibrosis in RRas2−/− mice (unpublished data). Although the physiological status of other organs was not closely monitored, the analysis of X-gal–stained tissue sections indicated that the gross histology of the heart, aorta, lung, intestine, bladder, white adipose tissue, mammary gland, kidney, testes, and ovaries was similar in RRas2−/− and RRas2+/− mice (unpublished data), thus suggesting that the lack of R-Ras2/TC21 expression does not induce major histological and/or developmental alterations in the tissues surveyed. Consistent with all those data, RRas2−/− mice showed normal growth curves (Supplemental Figure S1C) and did not show enhanced mortality rates when compared with wild-type counterparts, at least up to 1 yr of age (unpublished data).
R-Ras2/TC21 is necessary for proper mammary gland development
Unlike the case of other tissues, the full development of the mammary gland is not fully achieved until the adult period. The first postnatal morphogenetic wave of this organ takes place at puberty. At this stage, the distal ends of ducts start proliferating and form multilayered terminal end buds (TEBs). These TEBs, which are composed of an external layer of cap cells and several layers of luminal epithelial cells, undergo serial cycles of proliferation, elongation, bifurcation, and lateral branching to generate the highly arborized structure typical of the mature mammary gland. These final tubules are composed of two cell layers: an outer one formed exclusively by smooth muscle cell actin–positive myoepithelial cells, and a luminal one containing epithelial cells. A second wave of morphogenic activity occurs during pregnancy, in which luminal epithelial cells proliferate extensively and differentiate into milk-secreting alveoli. Finally, after the lactation period, the mammary gland regresses back to the former structure and size by the engagement of a large apoptotic program that wipes out ∼80% of the cells generated during pregnancy (Gjorevski and Nelson, 2011). Because of this, we decided to analyze in more detail the potential role of R-Ras2/TC21 in this organ. Consistent with a potential role in this process, we found that the expression of the RRas2 mRNA, although present in all stages of the mammary gland, became specifically up-regulated during those two highly morphogenetic periods of the mammary gland (Figure 3A). Next we compared the structure of the mammary glands present in 4-wk-old (beginning of puberty), 5-wk-old (puberty), and 12-wk-old (postpubertal period) RRas2+/+ and RRas2−/− female mice. To that end, we extracted the mammary fat pads from animals of the indicated genotypes, stained them with red carmine to visualize the mammary gland tubules and TEBs, and then quantified the total gland area, the maximal length of extension of the tubules within the mammary fat pad, and the number of TEBs and branching points exhibited by the mammary glands under analysis. We found no major differences in any of those parameters in the mammary glands of 4-wk-old R-Ras2/TC21-deficient and control mice (Figure 3, B, C, E, and F). However, when we analyzed 5-wk-old mice, we observed that the mammary glands extracted from RRas2−/− mice were significantly smaller than those obtained from control animals (Figure 3, B–D). Those glands also displayed significant lower numbers of TEBs (Figure 3, B and E) and branching points (Figure 3, B and F). Most of those differences disappeared in the mammary glands of 12-wk-old mice (Figure 3, B–D). However, unlike the case of control mice, we found that ∼50% of the mammary glands obtained from RRas2−/− mice still contained a significant number of TEBs (Figure 3E), further suggesting that the R-Ras2/TC21 deficiency induces a delay in the development of this gland. This phenotype was highly penetrant, since it was observed in mice of homogenized (C57BL/6J, Figure 3) and mixed (129Sv/J × C57BL/6J, Supplemental Figure S2) genetic backgrounds. In the latter strain, kinetics experiments demonstrated that the developmental delay is present in both 5- and 6-wk-old RRas2−/− mice (Supplemental Figure S2). This maturational delay is circumscribed to the pubertal morphogenetic phase, because we could not detect any significant defect in the alveolar expansion of the mammary epithelium in lactating RRas2−/− mice (Supplemental Figure S3, A and B). The glands were also fully functional during lactation, as determined by the wild type–like ratios of overall survival (Supplemental Figure S3C) and net weight gain (Supplemental Figure S3D) of the offspring of RRas2−/− mothers. Taken together, these results indicate that R-Ras2/TC21 is involved in the proper developmental kinetics of the mammary gland during the pubertal period.
FIGURE 3:
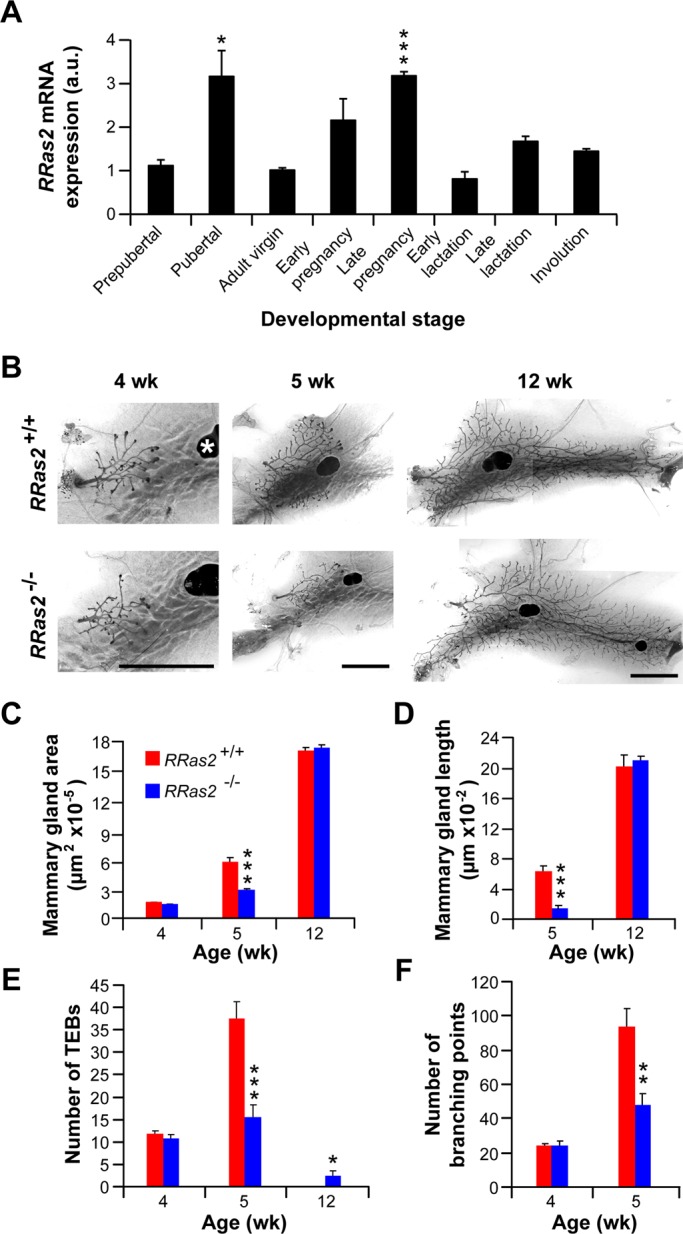
R-Ras2/TC21 regulates the timely development of the pubertal mammary gland. (A) qRT-PCR analysis of total RNA obtained from mammary glands extracted from the indicated stages. Prepubertal, pubertal, and adult virgins correspond to samples obtained from 3-, 8-, and 14-wk-old RRas2+/+ female mice, respectively. Early and late pregnancy correspond to female mice within weeks 1 and 2½ of pregnancy, respectively. The early and late lactation samples were taken 1 and 2 wk after labor, respectively. The involution phase samples were taken 3.5 d after offspring weaning. Data are given relative to the expression levels obtained in virgin adult state (which was given an arbitrary value of 1). All values were normalized taking into consideration the expression levels of the housekeeping Gapdh mRNA in each sample. *p ≤ 0.05; ***p ≤ 0.001 (n = 3). (B) Representative images of carmine alum–stained mammary fat pads obtained from female mice of the indicated ages (top) and genotypes (left). Scale bars, 500 μm. One of the inguinal lymph nodes is indicated by a white asterisk. (C–F) Quantification of the total area (C), maximal length (D), number of TEBs (E), and branching points (F) of mammary glands obtained from animals of the indicated genotypes and ages. *p ≤ 0.05, **p ≤ 0.01, ***p ≤ 0.001 when compared with values obtained in the appropriate wild-type control (n = 5–10 animals per genotype and developmental stage).
Because the morphogenic activity of the mammary gland during puberty is triggered by estrogens produced by the ovary (Sternlicht et al., 2006), an organ that displays high levels of expression of the RRas2 gene (Figure 2), we were concerned with the possibility that the developmental defect found in the mammary glands of RRas2−/− mice could be a reflection of impaired estrogen production or other extrinsic programs. To address this possibility, we took advantage of the known ability of isolated primary epithelial cells (MECs) to regenerate a complete mammary gland tree upon implantation in the mammary fat pads of recipient animals. Using that property, we isolated primary RRas2−/− MECs, transduced them in vitro with lentiviruses encoding either no ectopic protein or a hemagglutinin (HA)-tagged version of human R-RAS2/TC21 protein, and implanted them orthotopically in either RRas2+/+- or RRas2−/−-recipient female mice. The mammary glands of the recipient mice were surgically removed before the implantation step to allow the identification of the mammary gland developed exclusively by the newly implanted cells. Seven weeks after implantation, we evaluated both the structure and extension of the mammary gland trees developed under each of those experimental conditions. These experiments revealed that mock-transfected RRas2−/− MECs generated smaller glands regardless of the genotype of the recipient mice used (Figure 4, A and B). We also observed that the expression of HA-RAS2/TC21 in RRas2−/− MECs restored normal gland development upon implantation on either wild-type or RRas2−/−-recipient mice (Figure 4, A–C), a result indicating that R-Ras2/TC21 plays intrinsic signaling roles in MECs. Consistent with this view, we could not detect any defect in the development of the mammary gland when mock-infected wild-type MECs were implanted into RRas2−/−-recipient female mice (Figure 4, A and B). Taken together, these results indicate that the physiological/cellular environment present in RRas2−/− mice does not negatively affect the morphogenetic process of the mammary gland.
FIGURE 4:

The developmental defects of the mammary glands of R-Ras2/TC21–deficient mice are due to intrinsic signaling deficiencies in MECs. (A) Representative images of the mammary glands developed in recipient female mice of the indicated genotypes (left) upon orthotopic transplantation with primary mammary epithelial cells (top). Those included control (left) and RRas2−/− (middle) cells transduced before transplantation with a noncoding lentivirus (middle) and RRas2−/− cells transduced with a lentivirus encoding a HA-tagged version of human R-RAS2/TC21 protein (right). At 7 wk after transplantation, mammary fat pads were isolated, stained with carmine alum, and photographed. Scale bar, 500 μm. (B) Quantification of the total area occupied by the mammary gland generated in the transplantation experiments described in A. *p ≤ 0.05; **p ≤ 0.01 (n = 5–8). (C) Total cellular extracts from the indicated cultures of mammary epithelial cells were analyzed by Western blot (WB) with antibodies to HA (top) to reveal the expression of the ectopic HA-R-RAS2/TC21 proteins. As a loading control, the same extracts were immunoblotted with antibodies to tubulin α (bottom).
R-Ras2/TC21, H-Ras, and N-Ras act nonredundantly during pubertal mammary gland development
Given the high sequence and signaling similarity between Ras and R-Ras subfamily GTPases (Drivas et al., 1990; Colicelli, 2004), we next investigated whether R-Ras2/TC21 could be functionally redundant to H-Ras and N-Ras in this functional setting. To this end, we compared the pubertal mammary gland development in control, single RRas2−/−-knockout, double HRas−/−;NRas−/−-knockout (Esteban et al., 2001), and triple RRas2−/−;HRas−/−;NRas−/−-knockout mice. To facilitate such comparison, all these mouse strains were homogenized in the C57BL/6J genetic background. As previously seen with RRas2−/− mice (Figure 3), the prepubertal mammary gland primordium developed normally regardless of the genotypes of the animals analyzed in terms of total gland area (Figure 5, A and B), number of TEBs (Figure 5, A and D), and branching points (Figure 5, A and E). During pubertal morphogenesis, we observed that the glands generated in double H-Ras;N-Ras–deficient mice had, similar to those found in RRas2−/− mice (Figures 3 and 5, A, D, and E), fewer TEBs (Figure 5, A and D) and branching points (Figure 5, A and E) than those developed in control animals. However, unlike the case of RRas2−/− mice (Figures 3 and 5, A–C), these defects did not result in a defective growth within the mammary fat pad (Figure 5, A–C). In fact, the mammary glands of those mice were larger than those from other mouse genotypes (Figure 5B). Although the reason for this difference is unknown, we surmise that it could be due to the presence of larger fat pads in those animals because the double HRas−/−;NRas−/− mice are slightly fatter than the rest of mouse knockout and control strains used in these experiments (R.M.L. and X.R.B, unpublished observations). The triple RRas2;HRas;NRas gene deficiency recapitulated, but it did not aggravate, the defects seen in the mammary glands of R-Ras2/TC21–deficient mice (Figure 5), indicating that the three GTPases do not act redundantly or additively during gland development. All the defects found in the pubertal mammary glands of double HRas−/−;NRas−/−-knockout and triple RRas2−/−;HRas−/−;NRas−/−-knockout mice were erased after puberty (Figure 5). We found similar survival rates in the offspring of triple RRas2−/−;HRas−/−;NRas−/− and wild-type mothers (82.1 ± 6.1% [n = 250] vs. 85 ± 3.5% [n = 500], respectively), further indicating that the mammary glands are functional in the absence of these three Ras subfamily GTPases. These data further indicate that R-Ras2/TC21 and Ras proteins are important for the kinetics but not for the overall developmental program of this gland during the pubertal phase.
FIGURE 5:

R-Ras2/TC21 acts nonredundantly and nonadditively with H- and N-Ras GTPases during pubertal mammary gland development. (A) Representative images of carmine alum–stained mammary fat pads obtained from female mice of the indicated ages (top) and genotypes (left). Scale bars, 500 μm. (B–E) Quantification of the total area (B), maximal length (C), number of TEBs (D), and branching points (E) of mammary glands obtained from animals of the indicated genotypes and ages. *p ≤ 0.05, **p ≤ 0.01, ***p ≤ 0.001 when compared with values obtained in the appropriate wild-type control (n = 5–11 animals per genotype and developmental stage).
R-Ras2/TC21 is expressed in both cap and epithelial cells of terminal end buds during pubertal development of the mammary gland
The effect of the RRas2 gene deficiency in mammary gland development—a process basically regulated by epithelial cells (Gjorevski and Nelson, 2011)—was at odds with the specific expression of R-Ras2/TC21 seen in the myoepithelial cells of the gland tubules during the X-gal staining experiments performed with adult mice. This observation, coupled with the up-regulation of the RRas2 gene found in specific developmental stages of the gland (Figure 3A), led us to study the expression of this gene in more detail during the development of the mammary gland. Using X-gal staining techniques in both RRas2+/− and RRas2−/− mice, we could not find any detectable expression of the RRas2 gene in the mammary epithelial buds of E11.5–13.5 embryos (Figure 1, C–F), indicating that this GTPase is not expressed in the earliest developmental stages of the mammary gland. In the case of pubertal glands, we detected expression of RRas2 in the myoepithelial cells but not in the luminal epithelial cells present in the mammary gland ducts (Figure 6A), an expression pattern identical to that seen later in fully developed glands (Figure 2I). However, in this case, we also observed significant X-gal staining in both the cap and a small fraction of TEB body cells (Figure 6A). The expression of the RRas2 gene in epithelial cells was also demonstrated by qRT-PCR using total RNA extracted from isolated MECs (Figure 6B). Immunoblot analysis of total cellular MEC lysates using R-Ras2/TC21–specific antibody also confirmed the presence of the protein in epithelial cells (Figure 6C). The specificity of the antibody to R-Ras2/TC21 was demonstrated by the absence of signals in RRas2−/− MECs (Figure 6C). H-Ras and N-Ras were also detected by qRT-PCR in MECs (Figure 6B). These results indicate that R-Ras2/TC21 is expressed constitutively in the myoepithelial layer of postnatal mammary ducts and, in an inducible and developmental-specific manner, in cap and epithelial cells of TEBs.
FIGURE 6:

Expression of the RRas2 gene in pubertal mammary glands. (A) Mammary gland sections from 6-wk-old RRas2−/− female mice were stained with X-gal (blue) and antibodies to smooth muscle cell actin (brown) and counterstained with nuclear fast red (purple). Left, a representative image of a duct; middle and right, two TEBs in different orientations. Black arrows signal myoepithelial cells double positive for X-gal and smooth muscle cell actin. Closed arrowheads indicate cap cells double positive for X-gal and smooth muscle cell actin. Open arrowheads pinpoint single X-gal–positive body cells. Scale bar, 50 μm. (B) Expression of the indicated Ras family transcripts in primary mammary epithelial cells derived from the indicated genotypes. Values are given relative to the expression levels of each transcript found in wild-type mice (which was given an arbitrary value of 1). n = 1 experiment performed in triplicate. (C) Western blot analysis demonstrating the expression of the endogenous R-Ras2/TC21 protein in primary mammary epithelial cells (top). As loading control, aliquots of the same extracts were subjected to immunoblot analysis using antibodies to tubulin α (bottom).
R-Ras2/TC21 is important for the proliferation of mammary epithelial cells in vivo
TEBs are critical for mammary gland development, since they contain stem cells, undergo extensive proliferative rounds, and condition both the branching and migration of the gland tubules during the pubertal morphogenetic phase of the mammary gland. Those functions are regulated by intrinsic signaling routes and by extensive cross-talk established with adipocytes, fibroblasts, and hematopoietic cells present in the surrounding mammary fat pad (Gjorevski and Nelson, 2011). Given this, we next compared the functional status of those structures in control and RRas2−/− mice. Using antibodies to smooth muscle actin and immunofluorescence techniques, we could not observe any defect in the overall structure of TEBs in the glands of R-Ras2/TC21–deficient mice (Figure 7A). Using flow cytometry techniques, we also did not detect major changes in the populations of epithelial cells present in the mammary glands of RRas2−/− mice (Supplemental Figure S4). To analyze the branching morphogenesis process, we resorted to the use of mammary organotypic cultures in three-dimensional Matrigel gels. This technique allows the formation of mammary organoids in culture that adopt the typical bilayered cell structure of the mammary gland tubules and, in addition, enables the evaluation of the branching program when the cultures are stimulated with specific extracellular ligands such as FGF2 (fibroblast growth factor 2). As expected, organoids cultured in the absence of that mitogen showed typical smooth, spherical shape regardless of the genotype of the animals from which they were isolated (Supplemental Figure S5A, left). In the presence of FGF2, these organoids generated from animals of both genotypes showed a similar budding of new ducts in culture (Supplemental Figure S5, A and B), indicating that the lack of expression of the R-Ras2/TC21 GTPase does not impair this biological process. Independent of the FGF2 culturing conditions, immunofluorescence experiments demonstrated that organoids generated from control and RRas2−/− mice showed the typical two layers of myoepithelial and epithelial cells (Supplemental Figure S5C). Transwell migration assays conducted with isolated primary MECs in either the presence or absence of collagen also indicated that the lack of R-Ras2/TC21 does not affect the migration properties of primary MECs (Supplemental Figure S5, D and E).
FIGURE 7:

Reduced proliferation and Erk activation of epithelial cells in pubertal RRas2−/− mammary glands. (A) Mammary glands from 5-wk-old animals of the indicated genotypes (top) were sectioned, stained with antibodies to smooth muscle cell actin (SMA, red), incubated with 4′,6′-diamidino-2-phenylindole (DAPI, blue), and analyzed by immunofluorescence microscopy. The images show a representative section of TEBs. Cap cells are indicated with open arrowheads. Scale bar, 100 μm. (B, C) Mammary glands from 5-wk-old animals of the indicated genotypes (top) were subjected to immunohistochemical analysis with antibodies to Ki67 and analyzed by standard light microscopy (B) to quantify the number of Ki67-positive cells present in both TEBs and the surrounding stroma (C). Scale bar, 100 μm. **p ≤ 0.01 compared with appropriate wild-type control (n = 6–8). (D, E) Mammary glands obtained as described were subjected to TUNEL assays and analyzed by immunofluorescence (D), and the number of apoptotic, TUNEL-positive cells present in TEBs quantified de visu (E). Scale bar, 100 μm. (F–I) Mammary glands obtained from mice of the indicated genotypes were immunostained with antibodies to either phosphorylated Akt (F) or phosphorylated Erk1/2 (H) to quantify the percentage of phospho-Akt–positive (G) and phospho-Erk1/2–positive (I) cells present in TEBs and adjacent stroma. p, phospho. Scale bars in G and H, 100 μm. In I, ***p ≤ 0.001 when compared with values obtained in wild-type mice (n = 5).
Next we evaluated the proliferation of TEBs by staining tissue sections with antibodies to the proliferative marker Ki67. These studies revealed a statistically significant defect in the number of proliferating cells in RRas2−/− mice (Figure 7, B and C). By contrast, no major defects were seen in the number of proliferating cells present in the surrounding stroma (Figure 7C), indicating that the R-Ras2/TC21 deficiency only affects the proliferation of epithelial cells present in TEBs. Finally, the use of terminal deoxynucleotidyl transferase dUTP nick end labeling (TUNEL) assays revealed similar apoptotic rates in the TEBs of both control and RRas2−/− mice (Figure 7, D and E). Taken together, these results indicate that R-Ras2/TC21 is not critical for the structure and budding process of the mammary gland and the efficient migration and survival epithelial cells. By contrast, this GTPase seems to be specifically involved in the proliferation of epithelial cells within the TEBs.
Given that R-Ras2/TC21 can induce the activation of the PI3-K/Akt (McFall et al., 2001; Rosario et al., 2001; Murphy et al., 2002; Rong et al., 2002; Delgado et al., 2009) and Raf/MEK/Erk (Graham et al., 1994; Movilla et al., 1999; Rosario et al., 1999) routes, we next analyzed the status of both signaling routes in mammary glands sections, using immunohistochemical analysis with antibodies to phosphorylated Akt and Erk, respectively. Whereas no defects were seen in the number of phospho-Akt–positive cells in the RRas2−/− gland TEBs (Figure 7, F and G), we did find that those gland structures had reduced numbers of phospho-Erk–positive cells when compared with parallel sections obtained from control mice (Figure 7, H and I). As in the case of the detection of Ki67-labeled cells (Figure 7C), the defect in phospho-Erk–positive cells was circumscribed to the MECs present in TEBs (Figure 7I).
R-Ras2/TC21 is also important for the proliferation of mammary epithelial cells in vitro
To rule out the possibility that the reduced proliferation rates of RRas2−/− TEB epithelial cells in vivo was due to non–cell-autonomous effects, we evaluated the intrinsic proliferation of isolated RRas2−/− MECs in vitro. We found that RRas2−/− MECs proliferated at lower rates than wild-type counterparts in two-dimensional cultures using both standard cell counting (Figure 8A) and 5-bromodeoxyuridine (BrdU)-labeling (Figure 8, B and C) determinations. The analysis of colonies formed in three-dimensional cultures also indicated that the elimination of R-Ras2/TC21 resulted in reduced proliferation rates, leading to the formation of very small colonies (Figure 8, D–G). Comparative studies showed that the effect of the R-Ras2/TC21 deficiency on primary MEC proliferation in vitro was very similar to that induced by the culturing of those cells in mitogen-free media (Figure 8, D and E) or in growth media containing a MEK (PD98059) inhibitor (Figure 8, F and G). Wild type–like proliferation rates were restored both in two-dimensional (Figure 8C) and three-dimensional (Figure 8, D and E) culture conditions upon the lentiviral-mediated expression of wild-type, HA-tagged human R-RAS2/TC21 in RRas2−/− MECs. Immunoblot analysis of total cellular lysates confirmed the expression of the HA-R-RAS2/TC21 GTPase in the appropriate infections of RRas2−/− MECs (Figure 8H).
FIGURE 8:

Defective in vitro proliferation of RRas2−/− primary mammary epithelial cells. (A, B) Proliferation of primary mammary epithelial cells of the indicated genotypes using standard cell number (A) and BrdU incorporation (B) determination experiments. ***p ≤ 0.001 when compared with values obtained in control cells (n = 3). O.D., optical density. (C) Primary mammary epithelial cells obtained from RRas2−/− mice were transduced with either an empty lentivirus (RRas2−/−) or a lentivirus encoding HA-R-RAS2/TC21 protein (RRas2−/− + RRAS2) and the proliferation determined using BrdU incorporation assays. As control, we determined in parallel the proliferation of mock-infected wild-type mammary epithelial cells (RRas2+/+). ***p ≤ 0.001 when compared with values obtained in mock-transduced RRas2−/− cells (n = 3). (D, E) The indicated sets of mammary epithelial cells (top) were embedded into Matrigel and cultivated in either starvation medium (SM) or growth medium (GM) for 10 d. At each experimental time point, cultures were photographed (D) and the volume of the colonies formed determined (E) as indicated in Materials and Methods. In D, scale bar, 50 μm. In E, *p ≤ 0.05 and **p ≤ 0.01 when compared with mock-infected RRas2−/− cells (n = 3). (F, G) Mammary epithelial cells of the indicated genotypes (left) were maintained in Matrigel cultures containing starvation medium, (F, left), growth medium with DMSO carrier (F, middle), or growth medium supplemented with the PD98059 MEK inhibitor (F, right). After 10 d, the colonies formed were photographed (F) and their volumes determined (G). In F, scale bar, 50 μm. In G, ***p ≤ 0.001 (n = 3). (H) Western blot analysis demonstrating the expression of the ectopic HA-RRAS2/TC21 protein in the appropriate experimental samples used in the foregoing experiments (top). As loading control, aliquots of the same extracts were subjected to immunoblot analysis with antibodies to tubulin α (bottom).
Finally, we verified the status of the Akt and Erk routes in cultured primary MECs. To this end, cells were starved and then stimulated with growth factors known to affect mammary morphogenesis, such as FGF2, EGF (epidermal growth factor), insulin-like growth factor (IGF), and hepatocyte growth factor (HGF). At the indicated time points, cells were lysed and the levels of stimulation of both routes determined by immunoblot analysis of total cellular lysates with antibodies to phospho-Akt and phospho-Erk1/2. These experiments showed no significant variations of phospho-Akt between wild-type and RRas2−/− MECs in any of the stimulation conditions tested (Supplemental Figure S6). In the case of phospho-Erk1/2, we observed no significant variations upon stimulation of MECs with either EGF (Supplemental Figure S6A) or FGF2 (Supplemental Figure S6B). Mild although reproducible defects in activation of this serine/threonine kinase were observed when RRas2−/− MECs were stimulated with either IGF (Supplemental Figure S6C) or HGF (Supplemental Figure S6D).
DISCUSSION
Despite the important functions described for R-Ras proteins in vitro, the characterization of their physiological and developmental roles is still in its infancy. This scenario is beginning to change due to the development of animal models for RRas1, RRas2, and RRas3 genes. The analysis of these mice has shown that whereas R-Ras1 plays roles in hematopoietic stem cells (Shang et al., 2011), antigen-presenting dendritic cells (Singh et al., 2012), and vascular smooth muscle/endothelial cells (Komatsu and Ruoslahti, 2005), R-Ras2/TC21 is important for the peripheral maintenance of mature lymphocytes (Delgado et al., 2009) and T-cell trogocytosis (Martinez-Martin et al., 2011). By contrast, RRas3−/− mice display no overt phenotype during the embryonic or postnatal period despite the high expression levels of this gene in the brain (Nunez Rodriguez et al., 2006). Given the widespread expression pattern of some of those genes, is unlikely, however, that these functions will be the only ones disrupted in those knockout mice. Here we used the recently described strain of RRas2−/− mice to unveil new functions of R-Ras2/TC21 outside the lymphoid system. This study revealed that this GTPase plays additional roles in the development of the mammary gland during puberty. In particular, we saw that the lack of R-Ras2/TC21 leads to reduced number of TEBs and ductal branches during the pubertal development of the mammary gland, which, in turn, induces a marked delay in the arborization and extension of the mammary gland tree within the fat pad. This role is transient and very specific, because the lack of this GTPase does not affect the development of mammary gland primordium during the embryonic period, the large expansion of the gland during pregnancy, or the physiological function of the fully developed gland during lactation.
The comparison of the mammary glands of pubertal control and RRas2−/− female mice indicates that the lack of this GTPase is associated to defective proliferation of TEB epithelial cells. By contrast, alterations in cell viability or cell migration can be ruled out. The lack of migration defects is in contrast with previous data indicating that constitutively active version of R-Ras2/TC21 enhances the motility of primary breast epithelial cells (Keely et al., 1999), a result that confirms the idea that data from overexpression studies do not necessarily reflect the actual roles of GTPases in vivo. Although R-Ras2/TC21 is expressed in tissues (ovary) and cells (vascular endothelial cells, adipocytes, and hematopoietic cells) that influence mammary gland morphogenesis through hormonal and local paracrine signals (Gjorevski and Nelson, 2011), we believe that the biological defects found in RRas2−/− mice are mainly due to cell autonomous problems in mammary epithelial cells. In agreement with this possibility, we showed using transplantation and rescue experiments that the hormonal and/or stromal environment present in RRas2−/− mice is not a key factor in the developmental defects found in the mammary glands of those mice. Furthermore, we also detected proliferative defects when purified RRas2−/− primary mammary epithelial cells were maintained in two- and three-dimensional culture conditions.
Regarding the potential signaling elements involved in this route, our results show that the Akt route is activated normally both in vivo and in vitro in the absence of R-Ras2/TC21, indicating that this pathway cannot be accountable for the phenotype found in RRas2−/− mice. By contrast, we did find severe defects in the activation status of the Erk route in vivo, a result consistent with the known role of this pathway in the proliferation and ductal branching of the pubertal mammary gland (Gjorevski and Nelson, 2011). However, this signaling defect is much milder and stimulus specific when using isolated mammary epithelial ex vivo, suggesting that it cannot explain single-handedly the proliferative defects shown by RRas2−/− epithelial cells in cell culture. We do not know the reason for the different activation levels of the Erk route between the in vivo and in vitro conditions. One possibility is that the stronger defects seen in the former case could be due to the fact that cells are exposed to limited amounts of extracellular stimuli than when stimulated in vitro. Alternatively, they may reflect the presence of signaling cross-talk initiated by RRas2−/− epithelial cells, which, in turn, could lead to reduced levels of paracrine activation of epithelial cells by the stromal cells in vivo. For example, it is known that estrogens trigger the expression of Areg in mammary epithelial cells, leading to the subsequent activation of the EGF receptor in stromal cells and the final, stromal-dependent stimulation of epithelial cells (Sternlicht et al., 2005). This hypothesis, however, is not supported by the observation that similar numbers of phospho-Erk–positive stromal cells exist in RRas2−/− and control mice, at least in the areas adjacent to TEBs. Given that mammary gland morphogenesis is regulated by many other tyrosine kinase receptors (i.e., Ron, ephrin family receptors; Gjorevski and Nelson, 2011), another possibility is that R-Ras2/TC21 could be activated in vivo by mitogen/receptor pairs different from those tested by us in vitro. In any case, we do not consider non–cell-autonomous defects because, as noted, we found that wild-type epithelial cells could develop normal mammary glands when transplanted into RRas2−/−-recipient female mice. Whether other known effectors of R-Ras2/TC21 (i.e., the RalGDS/Ral route) or new downstream elements contribute to this process remains to be determined.
Consistent with the phenotype observed, we detected a developmentally regulated expression of the RRas2 gene in the cap and body cells of TEBs, the structures that drive the proliferation, branching, and extension of the ductal tree (Gjorevski and Nelson, 2011). This differential regulation is not unheard off in the case of the R-Ras subfamily. Indeed, other reports showed that the expression of the RRas2 gene can change in different cell types during physiological and/or pathological conditions (Drivas et al., 1990; Kozian and Augustin, 1997; Larkin et al., 2004; Zhu et al., 2005; Rokavec et al., 2008). Similarly, the down-regulation of the RRas1 gene has been described in vascular smooth muscle cells during both neointima formation and tumor-induced neoangiogenesis (Komatsu and Ruoslahti, 2005). Finally, the R-Ras3/M-Ras protein levels increase during neuronal development (Nunez Rodriguez et al., 2006). These data indicate that, unlike the case of Ras subfamily GTPases, these proteins are probably subjected to a dual regulation at the gene expression level and the standard GDP/GTP cycle.
It should be noted that the phenotype described here can be an underestimation of the actual role of R-Ras2/TC21 in this gland, since mammary epithelial cells also express R-Ras1 (unpublished data) and Ras subfamily proteins (this work). We started to assess this possibility by comparing the phenotypes of single RRas2−/−, double HRas−/−;NRas−/−, and triple RRas2−/−;HRas−/−;NRas−/− mice. Our results indicate that these proteins, although affecting mammary gland morphogenesis during puberty, do not seem to act additively or synergistically in this process. It would be interesting in the near future to carry out similar studies with RRas1−/−;RRas2−/− mice in order to see whether these two R-Ras subfamily proteins have redundant roles during mammary gland development.
Although the RRas2 gene is expressed in organs that are critical for both embryonic and postnatal viability, our study also indicates that the lack of expression of this GTPase does not affect the overall viability, physiology, or reproduction of mice. Whether the triple RRas2−/−;HRas−/−;NRas−/−-knockout mice have aggravated defects in the postnatal period awaits further examination. In any case, it is clear that, unlike the lethal effects of the combined K-Ras, H-Ras, and N-Ras inactivation in the postnatal period (Drosten et al., 2010), the combined elimination of H-Ras, N-Ras, and R-Ras2/TC21 does not negatively affect the long-term viability of the mice. As discussed in the case of the mammary gland phenotype, it is possible that this mild phenotype is due to redundancy issues with R-Ras1, R-Ras3/M-Ras, and/or K-Ras proteins. For example, RRas1 and RRas2 genes are coexpressed in vascular smooth muscle cells, vascular endothelial cells, and hematopoietic cells. In addition, it is also possible that R-Ras2/TC21 may be important for the function of some of the aforementioned tissues during pathological conditions rather than during the course of normal physiological responses. Hence, the role of R-Ras1 in vascular remodeling could be picked up only when neointima- and angiogenic-triggering experimental conditions were conducted on otherwise normal RRas1−/− mice (Komatsu and Ruoslahti, 2005). It is possible therefore that R-Ras2/TC21 could also play roles during specific pathological conditions associated to tissues of high expression of this GTPase, such as obesity, metabolic syndrome, and hypertension/tumor–driven cardiovascular remodeling. The exploration of all those possibilities using single- and compound-knockout mice will provide additional clues about the role of R-Ras2/TC21 during physiological and pathological conditions.
MATERIALS AND METHODS
Plasmids
To generate the lentiviral vector encoding HA-tagged human RRAS2 (pRL1), a cDNA fragment encoding wild-type R-RAS2/TC21 was amplified by PCR using the pcDNA3-HA-RRAS2 plasmid (Delgado et al., 2009) as template and the primers 5′-GGC GCG GAT CCA TGT ATC CTT ATG ACG TGC CTG ACT ATG CCA GCG CCG CGG CCG GCT GGC GG-3′ (forward, BamH1 and HA epitope sites underlined and in bold font, respectively) and 5′-CCC CCC GGA TCC CTC GAG CTA GAA AAT GAC ACA ATG G-3′ (reverse, BamH1 site underlined). After digestion with BamH1, the RRAS2 cDNA fragment was cloned into BamH1-linearized pLVX-IRES-Hyg lentiviral vector (Clontech, Mountain View, CA).
Animal strains and genotyping
Animal care and work protocols were approved and carried out according to the regulations set forth by the Animal Research and Welfare committees of both the University of Salamanca and the Consejo Superior de Investigaciones Científicas. RRas2−/− mice have been described previously (Delgado et al., 2009). Mice were maintained in a mixed 129Sv/J × C57BL/6J background or backcrossed for 10 generations to obtain RRas2−/− animals in a stabilized C57BL/6J background. RRas2−/−;HRas−/−;NRas−/−-knockout mice (C57BL/6J genetic background) were generated by crossing RRas2−/− mice with double HRas−/−;NRas−/−-knockout mice (Esteban et al., 2001).
To genotype the RRas2 and HRas alleles present in offspring animals, we submitted tail DNA to PCR analysis at 94°C for 5 min, followed by 35 cycles of denaturation (94°C, 30 s), annealing (60°C, 30 s), and extension (72°C, 50 s). In the case of NRas-knockout mice, the annealing cycles were performed at 55°C for 30 s each. Primers used to identify RRas2 alleles included 5′-TGAAACAGGATCATGTTGTGGAG-3′ (forward), 5′-CAG GAG GAG TCC AAG AAG AC-3′ (reverse), and 5′-ATA AAC CCT CTT GCA GTT GCA TC-3′ (reverse). These primers yielded diagnostic PCR bands of 267 base pairs (in the case of RRas2+/+ mice) and 128 base pairs (in the case of RRas2−/− mice). RRas2+/− mice yielded two bands of 267 and 128 base pairs. Primers used to identify HRas alleles included 5′-CTA CCG GTG GAT GTG GAA TGT GTG CGA-3′ (forward), 5′-ATA GTT GTA GGT TGC ACC CAC ATG CCG-3′ (reverse), and 5′-ACC TGC CAA TGA GAA GCA CAC TTA GCC-3′ (reverse). These primers generated diagnostic bands of 434 (in the case of HRas+/+ mice), 336 (in the case of HRas−/− mice), and 434 plus 336 base pairs (in the case of HRas+/− mice). Primers used to identify NRas alleles were 5′-CCA GGA TTC TTA CCG AAA GCA AGT GGT G-3′ (forward), 5′-CAG AGC AGA TTG TAC TGA GAG TGC ACC-3′ (reverse), and 5′-GAT GGC AAA TAC ACA GAG GAA CCC TTC G-3′ (reverse). Amplifications with those primers yielded diagnostic fragments of 185 (in the case of NRas+/+ mice), 315 (in the case of NRas−/− mice), and 185 plus 315 base pairs (in the case of NRas+/− mice).
To analyze RRas2 expression during embryonic development, pregnant female mice were killed at the indicated days after observation of the postfecundation vaginal plug and embryos extracted. Staging of embryos was verified using the information contained in Theiler (1989).
Cell culture
For lentiviral production, 5 × 10⁶ Lenti-X 293T cells (Clontech) were plated onto 10-cm plates and maintained for 24 h in DMEM (Invitrogen, Carlsbad, CA) supplemented with 10% tetracycline-free fetal calf serum (Clontech). Cells were transfected with 7 μg of pRL1 using the Lenti-X HTX Packaging System (Clontech) according to the manufacturer's instructions. After 48 h, viral supernatants were collected, cleared by low-speed centrifugation, and concentrated 50-fold using the Lenti-X Concentrator (Clontech). Viral pellets were then resuspended in MEC primary growth medium (DMEM:F12 media [Invitrogen] containing 10% fetal calf serum [Invitrogen], 5 μg/ml insulin [Sigma-Aldrich, St. Louis, MO], 5 ng/ml EGF [Sigma-Aldrich], 100 μg/ml streptomycin [Invitrogen], 100 U/ml penicillin [Invitrogen], and 50 μg/ml gentamicin [Invitrogen]) and titered using the Lenti-X qRT-PCR Titration Kit (Clontech) according to the manufacturer's instructions. Viral particles were kept at –80°C until experimentally used.
Cultures of primary MECs were generated from 8- to 12-wk-old wild-type and RRas2−/− female mice (C57BL/6J background). Mammary glands number 3, 4 (without lymph node), and 5 were isolated, minced with a #22 scalpel for 3 min, and digested in collagenase buffer (DMEM:F12 supplemented with 5% fetal calf serum, 2 mg/ml Clostridium histolyticum collagenase [Sigma-Aldrich], 100 μg/ml streptomycin, and 100 U/ml penicillin) for 1 h at 37°C under moderate shaking. Mammary organoids were separated from fat and single cells (such as fibroblasts and red cells) by 600 × g centrifugation steps lasting 10 min (one), 5 min (one), and 2 s (four). After each centrifugation step, cell pellets were resuspended in DMEM:F12 medium. Purified organoids were then trypsinized (0.5 mg/ml trypsin and 0.2 mg/ml EDTA in saline solution [Invitrogen]) for 20 min at 37°C, washed with DMEM:F12, incubated with DNAseI (4 U/ml in DMEM:F12 [Sigma-Aldrich]) for 3 min at 25°C, and filtered through a 70-μm cell strainer (BD Falcon, BD Biosciences, San Jose, CA). Cells were cultured in MEC primary growth medium (DMEM:F12 media containing 10% fetal calf serum, 5 μg/ml insulin, 5 ng/ml EGF, 100 μg/ml streptomycin, 100 U/ml penicillin, and 50 μg/ml gentamicin) from passage 0 to passage 2. For growth factor stimulation, MECs were incubated for 4 h in starvation medium (MEC primary growth medium lacking mitogens and containing 0.5% fetal calf serum), and EGF (5 nM; Sigma-Aldrich), FGF2 (1 nM; Sigma-Aldrich), IGF (5 nM; Sigma-Aldrich), or HGF (1 nM; Sigma-Aldrich) was added.
MECs were infected with lentivirus as described (Deome et al., 1959; Daniel et al., 1968; Welm et al., 2008). Briefly, 2 × 10⁶ cells were transferred into a well of 24-well ultralow attachment plates (Corning, Corning, NY) and transduced with 1 × 10⁷ titer units of virus in a volume of 800 μl of primary growth medium for 16 h.
X-gal staining in whole embryos and tissue sections
For whole-mount β-galactosidase assays, embryos and adult tissues were dissected, fixed in phosphate-buffered saline solution (PBS) containing 0.2% glutaraldehyde (Sigma-Aldrich), 5 mM ethylene glycol tetraacetic acid (Sigma-Aldrich), and 2 mM MgCl2 (Sigma-Aldrich) for 30 min at 25°C, and stained in PBS containing 1 mg/ml X-gal (Sigma-Aldrich), 2 mM MgCl2, 0.02% Nonidet P-40 (Sigma-Aldrich), 5 mM potassium ferricyanide (Sigma-Aldrich), and 0.01% sodium deoxycholate (Sigma-Aldrich). Embryos were analyzed with a Nikon SMZ800 stereomicroscope and acquired with a Nikon Digital Sight DS-Fi1 camera (Nikon, Melville, NY). Alternatively, embryos and adult tissues were postfixed in 10%-buffered Formalin (Leica Microsystems, Jena, Germany), paraffin embedded, sectioned (2–3 μm in thickness), and counterstained with eosin except when otherwise stated.
For the determination of β-galactosidase activity in sections, embryos and adult tissue samples were dissected, fixed for 30 min at 4°C in PBS containing 2% paraformaldehyde (Sigma-Aldrich), cryoprotected by stepwise immersions in 15–30% sucrose (Sigma-Aldrich)–PBS solutions, embedded in Tissue-Tek OCT compound (Sakura, Alphen aan den Rijn, Netherlands), and stored frozen at −75°C. Tissue blocks were then cut into 10-μm-thick sections using a cryostat (HM 505 N; Microm International GmbH, Walldorf, Germany). Sections were air dried for 1 h, rinsed in PBS, postfixed for 10 min at 4°C in PBS containing 2% paraformaldehyde, washed with PBS, and stained for 14 h at 37°C with embryo-staining solution. Sections were washed in distilled water and counterstained with eosin unless otherwise specified (Nagi et al., 2003). Histological sections were analyzed with an Olympus BX51TF microscope and acquired with an Olympus DP70 camera (Olympus, Tokyo, Japan). Digital slides were obtained with the Mirax scan (Zeiss).
qRT-PCR
Total RNAs were extracted using the RNeasy Mini Kit (Qiagen, Valencia, CA), and expression levels of transcripts for the indicated Ras family GTPases were determined by qRT-PCR using the QuantiTect SYBR Green RT-PCR kit (Qiagen) and qRT-PCR apparatus (StepOnePlus Real-Time PCR System Cycler; Applied Biosystems, Foster City, CA). Primers used for mRNA quantitation included 5′-GTG GAT GGC TTC TGA CTT TG-3′ (forward for mouse RRas2), 5′-AAA CTT CAA TGG GGC TGT TG-3′ (reverse for mouse RRas2), 5′-AGG GAG CAG ATC AAG CGG GTG AAA G-3′ (forward for mouse HRas), 5′-AGA CTC AAC AGT GCG AGC AGC CA-3′ (reverse for mouse HRas), 5′-TGA CGA TGG CAC TCA AGG TTG TAT GG G-3′ (forward for mouse NRas), and 5′-CCA GGG ATG TCA GAA CCA GGG CA-3′ (reverse for mouse NRas). For normalization, we used the expression levels obtained in the different PCR reactions for the housekeeping Gapdh gene using primers 5′-TCG ACC ACC AAC TGC TTA GC-3′ (forward) and 5′-TCT TCT GGG TGG CAG TGA TG-3′ (reverse).
Hemodynamic studies
Blood pressure and heart rates were recorded in conscious mice with a volume–pressure recording noninvasive blood pressure monitoring system (CODA; Kent Scientific, Torrington, CT), as previously described (Sauzeau et al., 2006, 2007).
Analysis of mammary gland development
Mammary fat pads were extracted from animals of the indicated age, placed on dry, silanized glass slides, and fixed overnight in Carnoy's fixative (1:3:6 parts of glacial acetic acid:chloroform:100% ethanol). Tissues were rehydrated through successive incubations with 70% ethanol, followed by distilled water, and stained with red carmine overnight. Mammary glands were analyzed with a stereomicroscope (SMZ800; Nikon) and acquired with a digital camera (Digital Sight DS-Fi1; Nikon). The mammary gland area was obtained by calculating the area occupied by a lane drawn around the gland, including the nipple. The mammary gland length was measured from the end of the longest duct to a reference median point located between the nipple and the adjacent lymph node. In both cases, the analyses were carried out using ImageJ software (National Institutes of Health, Bethesda, MD). The number of terminal end buds and branching points were counted using photomicrographs of the entire gland.
Transplantation experiments
Both naive and lentiviral-transduced MECs were injected into either 3-wk-old wild-type or RRas2−/−-recipient female mice, exactly as described (Deome et al., 1959; Daniel et al., 1968; Welm et al., 2008). When needed, cells transduced with empty and HA-RAS2/TC21–encoding lentiviruses were injected in each experiment in the left and right inguinal mammary fat pads of the same recipient animal, respectively.
Immunohistochemical analysis of mammary glands
Tissues were dissected, fixed in 10%-buffered Formalin, embedded in paraffin, cut into either 3- or 5-μm-thick sections, and stained with hematoxylin/eosin. When appropriate, sections were subjected to immunohistochemical analysis using a mouse monoclonal antibody to Ki67 (clone MM1, dilution 1:100; Novocastra, Newcastle upon Tyne, United Kingdom), rabbit polyclonal antibodies to smooth muscle actin (dilution 1:200; Biocare Medical, Concord, CA), phospho-Erk (dilution 1:400; Cell Signaling Technology, Beverly, MA) or phospho-Akt (clone EP2109Y, dilution 1:100; Epitomics, Burlingame, CA). After an overnight incubation, tissue slides were rinsed with PBS, incubated 1 h at room temperature in a milk/PBS solution containing a sheep anti–mouse or a goat anti–rabbit immunoglobulin G (IgG)–horseradish peroxidase (GE Healthcare, Piscataway, NJ), rinsed with PBS, and developed with diaminobenzidine (Dako, Glostrup, Denmark). Positive cells in all of these analyses were scored de visu using an Olympus BX51TF microscope and acquired with an Olympus DP70 camera. Apoptotic cells were detected using the TUNEL-based In Situ Cell Detection kit (Roche, Indianapolis, IN). To this end, sections were deparafinized, hydrated, digested with proteinase K (Dako) for 30 min at 37°C, and subjected to the TUNEL reaction according to the manufacturer's instructions. TUNEL-positive cells in all those analysis were scored de visu using a standard immunofluorescence microscope (CTR600; Leica).
Immunofluorescence analysis of mammary glands
The fourth right and left mammary glands were dissected from 6-wk-old virgin or lactating female mice (1 d after parturition), fixed in 10%-buffered Formalin, embedded in paraffin, cut into either 3- or 5-μm-thick sections, and serially incubated with a mouse monoclonal antibody to smooth muscle actin (clone 1A4, dilution 1:200; Sigma-Aldrich) and a rabbit polyclonal antibody to mucin (MUC1, dilution 1:50; Abcam, Cambridge, MA). After an overnight incubation, tissue slides were rinsed in PBS, incubated 1 h at room temperature in a milk/PBS solution containing either a Cy3-conjugated goat anti–mouse IgG or a Cy3-conjugated goat anti–rabbit IgG–horseradish peroxidase (each diluted 1:200; Jackson ImmunoResearch Laboratories, West Grove, PA), washed with PBS, stained with 4′,6′-diamidino-2-phenylindole (Sigma-Aldrich), and mounted using Vectashield media (Vector Laboratories, Burlingame, CA). Microscopic analysis was performed using a Leica DM 6000B fluorescence microscope and a Hamamatsu ORCA-ER C4742-80 camera (Hamamatsu, Hamamatsu, Japan).
Immunoblot analysis
Cells were washed with ice-cold PBS solution and scrapped in 20 mM Tris-HCl (pH 7.4), 150 mM NaCl, 1% Nonidet-P40 (Sigma-Aldrich), 0.5% sodium deoxycholate (Sigma-Aldrich), 1 mM β-glycerophosphate (Sigma-Aldrich), 1 mM Na3VO4 (Sigma-Aldrich), 50 mM NaF (Sigma-Aldrich), and a protease inhibitor cocktail (Complete; Roche) at 4°C. After transfer to an Eppendorf tube and extensive vortexing, lysates were cleared by centrifugation at 10,000 rpm for 10 min at 4°C and supernatants diluted in 2× SDS–PAGE sample buffer. Protein samples were denatured by boiling in SDS–PAGE sample buffer, separated electrophoretically, and transferred onto nitrocellulose filters using the iBlot Dry Blotting System (Invitrogen; Castro-Castro et al., 2011). Membranes were blocked using 5% nonfat dry milk in TBS-T (25 mM Tris-HCl, pH 8.0, 150 mM NaCl, 0.1% Tween-20) for 1 h and then incubated at 4°C with the appropriate primary antibodies diluted in blocking buffer. Those included monoclonal antibodies to the HA epitope (clone 16B12, dilution 1:1000; Covance) and tubulin α (clone DM1A, dilution 1:1000; Calbiochem, La Jolla, CA), a home-made, affinity-purified rabbit polyclonal antibody raised against the R-Ras2/TC21 C-terminal region (residues 183–198) that recognizes specifically R-Ras2/TC21 but not the related R-Ras1 protein or other Ras superfamily proteins (1234, dilution 1:1000), a goat polyclonal antibody to total Akt (C-20, dilution 1:1000; Santa Cruz Biotechnology, Santa Cruz, CA), and rabbit polyclonal antibodies to phospho-Akt (phosphorylated residue S473; dilution 1:1000; Cell Signaling Technology), phospho-Erk1/2 (phosphorylated residues T202 + Y204 and T185 + Y187 in Erk1 and Erk2, respectively; dilution 1:1000; Cell Signaling Technology), and total Erk1/2 (dilution 1:1000; Cell Signaling Technology). After three washes with TBS-T, the membrane was incubated with horseradish peroxidase–conjugated protein A or the appropriate secondary antibody (1:5000 dilution) for 1 h at room temperature. Immunoreacting bands were developed using a standard chemiluminescence method (ECL; GE Healthcare).
Determination of mammary epithelial cell populations by flow cytometry
Freshly isolated MECs from 8-wk-old female mice of the indicated genotypes were washed twice with ice-cold PBS, resuspended in PBS at a density of 1 × 10⁶/ml, and incubated at 4°C with fluorescein isothiocyanate–conjugated rat IgG to CD24 (clone M1/69, dilution 1:400; BD Biosciences), allophycocyanin-labeled Armenian hamster IgG to CD29 (clone HMb1-1, dilution 1:1000; eBioscience, San Diego, CA), and phycoerythrin-conjugated rat IgG to CD49f (clone GoH3, dilution 1:200; eBioscience). After 30 min, cells were washed twice with ice-cold PBS and subjected to flow cytometry analysis using the FACSCalibur system (BD Biosciences). Raw data were processed using the Cell Quest and Paint-a-Gate software (both from BD Biosciences). Samples were gated on the basis of forward- and side-scatter. Information about the populations characterized with these markers can be found in previous publications (Sleeman et al., 2006; Stingl et al., 2006).
Branching and immunofluorescence assays using mammary organoids
Organoids obtained as indicated were not trypsinized and, instead, were incubated in DMEM:F12 containing 1× insulin/transferrin/sodium selenite liquid media supplement (Sigma-Aldrich), 100 μg/ml streptomycin, and 100 U/ml penicillin with or without 2.5 nM FGF2 (Sigma-Aldrich). After 4 d in culture, bright-field pictures of the colonies formed were taken using a Zeiss Axiovert 135 inverted microscope coupled to a digital camera (C2724-95; Hamamatsu). Alternatively, organoids were processed for immunofluorescence analysis. To this end, organoids were equilibrated in PBS containing 25% sucrose for 1 h, washed in PBS, and resuspended in ice-cold 1:1 methanol:acetone. After an overnight fixation at −20°C in the latter solution, organoids were reequilibrated for 1 h in PBS containing 25% sucrose, blocked for 1 h with 5% fetal bovine serum, and incubated for 2 h with a mouse monoclonal antibody to smooth muscle actin (clone 1A4, dilution 1:200; Sigma-Aldrich). After staining of the F-actin cytoskeleton with rhodamine-labeled phalloidin (dilution 1:200; Cytoskeleton, Denver, CO), organoids images were captured using a confocal microscopy (SP5 DMI-6000B microscope; Leica) and processed using LAS AF software (Leica).
Migration assays with primary mammary epithelial cells in vitro
For standard migration assays, we used the CytoSelect 24-Well Cell Migration Assay (Cell Biolabs, San Diego, CA) according to the manufacturer's protocol. Briefly, 2 × 10⁵ cells in starvation medium were plated onto the upper side of an 8-μm-pore polycarbonate membrane that was exposed to an underneath chamber filled with MEC primary growth medium. After culturing at 37°C for 24 h, the inserts were taken, stained with Lysis Buffer/CyQuant GR Solution (Cell Biolabs), and fluorescence measured with a 485/528-nm filter set using a Synergy 4 Microplate Reader (BioTek, Winooski, VT). For migration assays in collagen I, we used the collagen I–coated CytoSelect 24-Well Cell Haptotaxis Assay (Cell Biolabs). To this end, 2 × 10⁵ cells in starvation medium were plated onto the upper side of an 8-μm-pore polycarbonate membrane coated on the underside with collagen I and cultured as described. Inserts were then stained using Cell Stain Solution (Cell Biolabs) and incubated with Extraction Solution (Cell Biolabs), and absorbance was measured at the 560-nm wavelength using a microplate reader (Ultraevolution; Tecan, Männedorf, Switzerland).
Quantification of the proliferation of primary mammary epithelial cells in vitro
Aliquots of 20 × 103 MECs (passages 0–2; see earlier description) were plated onto six-well culture plates and cultured in MEC primary growth medium. At the indicated time points, cells were trypsinized and counted. Alternatively, BrdU incorporation assays were performed using a commercial kit (Cell Proliferation ELISA; Roche) according to the manufacturer's instructions.
Analysis of three-dimensional growth of primary mammary epithelial cells in vitro
MEC cultures were trypsinized, washed, resuspended as a single-cell suspension in growth factor–reduced Matrigel, and cultured in either starvation medium (MEC primary growth medium lacking mitogens and containing 0.5% fetal calf serum) or in standard MEC primary growth medium supplemented with 40 μM PD98059 (Calbiochem). After 10 d, bright-field pictures of cell colonies were acquired using an inverted microscope (Axiovert 135; Zeiss) coupled to a digital camera (C2724-95; Hamamatsu). After measuring the diameter (D) of the cell colonies using ImageJ software, we calculated the volume of colonies (V) using the following formula: V = 4π(D/2)3/3.
Statistical analysis
Statistical analyses were performed using the two-tailed Student's t test for paired and unpaired data versus control values. Experimental values in this work are all given as mean and SEM. Results with p ≤ 0.05 are considered statistically significant.
Supplementary Material
Acknowledgments
X.R.B. was supported by grants from the Spanish Association Against Cancer, the Spanish Ministry of Economy and Competitiveness (SAF2009-07172 and RD06/0020/0001), and the Castilla-León Autonomous Government (GR97). This work was also supported by the Spanish Ministry of Economy and Competitiveness through grants RD06/0020/0000 (to E.S.), PS09/01979 (to E.S.), and RD06/0020/1002 (to B.A.). Spanish funding to X.R.B. is cosponsored by the European Regional Development Fund.
Abbreviations used:
- BrdU
5-bromodeoxyuridine
- DAPI
4′,6-diamidino-2-phenylindole
- EGF
epidermal growth factor
- FGF2
fibroblast growth factor 2
- GAP
GTPase-activating protein
- GEF
GDP/GTP exchange factor
- GM
growth medium
- HGF
hepatocyte growth factor
- IGF
insulin-like growth factor
- MECs
mammary epithelial cells
- PI3-K
phosphatidylinositol-3 kinase
- qRT-PCR
quantitative reverse transcription PCR
- SM
starvation medium
- TEB
terminal end bud
- TUNEL
terminal deoxynucleotidyl transferase dUTP nick end labeling
- X-gal
5-bromo-4-chloro-3-indolyl β-d-galactopyranoside
Footnotes
This article was published online ahead of print in MBoC in Press (http://www.molbiolcell.org/cgi/doi/10.1091/mbc.E12-01-0060) on April 25, 2012.
The authors declare no competing financial interests.
REFERENCES
- Arora S, Matta A, Shukla NK, Deo SV, Ralhan R. Identification of differentially expressed genes in oral squamous cell carcinoma. Mol Carcinog. 2005;42:97–108. doi: 10.1002/mc.20048. [DOI] [PubMed] [Google Scholar]
- Barker KT, Crompton MR. Ras-related TC21 is activated by mutation in a breast cancer cell line, but infrequently in breast carcinomas in vivo. Br J Cancer. 1998;78:296–300. doi: 10.1038/bjc.1998.490. [DOI] [PMC free article] [PubMed] [Google Scholar]
- Calvo F, Crespo P. Structural and spatial determinants regulating TC21 activation by RasGRF family nucleotide exchange factors. Mol Biol Cell. 2009;20:4289–4302. doi: 10.1091/mbc.E09-03-0212. [DOI] [PMC free article] [PubMed] [Google Scholar]
- Castro-Castro A, Ojeda V, Barreira M, Sauzeau V, Navarro-Lerida I, Muriel O, Couceiro JR, Pimentel-Muinos FX, Del Pozo MA, Bustelo XR. Coronin 1A promotes a cytoskeletal-based feedback loop that facilitates Rac1 translocation and activation. EMBO J. 2011;30:3913–3927. doi: 10.1038/emboj.2011.310. [DOI] [PMC free article] [PubMed] [Google Scholar]
- Chan AM, Miki T, Meyers KA, Aaronson SA. A human oncogene of the RAS superfamily unmasked by expression cDNA cloning. Proc Natl Acad Sci USA. 1994;91:7558–7562. doi: 10.1073/pnas.91.16.7558. [DOI] [PMC free article] [PubMed] [Google Scholar]
- Clark GJ, Kinch MS, Gilmer TM, Burridge K, Der CJ. Overexpression of the Ras-related TC21/R-Ras2 protein may contribute to the development of human breast cancers. Oncogene. 1996;12:169–176. [PubMed] [Google Scholar]
- Colicelli J. Human RAS superfamily proteins and related GTPases. Sci STKE. 2004;2004:RE13. doi: 10.1126/stke.2502004re13. [DOI] [PMC free article] [PubMed] [Google Scholar]
- Daniel CW, De Ome KB, Young JT, Blair PB, Faulkin LJ., Jr The in vivo life span of normal and preneoplastic mouse mammary glands: a serial transplantation study. Proc Natl Acad Sci USA. 1968;61:53–60. doi: 10.1073/pnas.61.1.53. [DOI] [PMC free article] [PubMed] [Google Scholar]
- Delgado P, Cubelos B, Calleja E, Martinez-Martin N, Cipres A, Merida I, Bellas C, Bustelo XR, Alarcon B. Essential function for the GTPase TC21 in homeostatic antigen receptor signaling. Nat Immunol. 2009;10:880–888. doi: 10.1038/ni.1749. [DOI] [PubMed] [Google Scholar]
- Deome KB, Faulkin LJ, Jr, Bern HA, Blair PB. Development of mammary tumors from hyperplastic alveolar nodules transplanted into gland-free mammary fat pads of female C3H mice. Cancer Res. 1959;19:515–520. [PubMed] [Google Scholar]
- Drivas GT, Shih A, Coutavas E, Rush MG, D'Eustachio P. Characterization of four novel ras-like genes expressed in a human teratocarcinoma cell line. Mol Cell Biol. 1990;10:1793–1798. doi: 10.1128/mcb.10.4.1793. [DOI] [PMC free article] [PubMed] [Google Scholar]
- Drosten M, Dhawahir A, Sum EY, Urosevic J, Lechuga CG, Esteban LM, Castellano E, Guerra C, Santos E, Barbacid M. Genetic analysis of Ras signalling pathways in cell proliferation, migration and survival. EMBO J. 2010;29:1091–1104. doi: 10.1038/emboj.2010.7. [DOI] [PMC free article] [PubMed] [Google Scholar]
- Esteban LM, et al. Targeted genomic disruption of H-ras and N-ras, individually or in combination, reveals the dispensability of both loci for mouse growth and development. Mol Cell Biol. 2001;21:1444–1452. doi: 10.1128/MCB.21.5.1444-1452.2001. [DOI] [PMC free article] [PubMed] [Google Scholar]
- Gjorevski N, Nelson CM. Integrated morphodynamic signalling of the mammary gland. Nat Rev. 2011;12:581–593. doi: 10.1038/nrm3168. [DOI] [PubMed] [Google Scholar]
- Graham SM, Cox AD, Drivas G, Rush MG, D'Eustachio P, Der CJ. Aberrant function of the Ras-related protein TC21/R-Ras2 triggers malignant transformation. Mol Cell Biol. 1994;14:4108–4115. doi: 10.1128/mcb.14.6.4108. [DOI] [PMC free article] [PubMed] [Google Scholar]
- Graham SM, Oldham SM, Martin CB, Drugan JK, Zohn IE, Campbell S, Der CJ. TC21 and Ras share indistinguishable transforming and differentiating activities. Oncogene. 1999;18:2107–2116. doi: 10.1038/sj.onc.1202517. [DOI] [PubMed] [Google Scholar]
- Graham SM, Vojtek AB, Huff SY, Cox AD, Clark GJ, Cooper JA, Der CJ. TC21 causes transformation by Raf-independent signaling pathways. Mol Cell Biol. 1996;16:6132–6140. doi: 10.1128/mcb.16.11.6132. [DOI] [PMC free article] [PubMed] [Google Scholar]
- Huang Y, Rangwala F, Fulkerson PC, Ling B, Reed E, Cox AD, Kamholz J, Ratner N. Role of TC21/R-Ras2 in enhanced migration of neurofibromin-deficient Schwann cells. Oncogene. 2004;23:368–378. doi: 10.1038/sj.onc.1207075. [DOI] [PMC free article] [PubMed] [Google Scholar]
- Huang Y, Saez R, Chao L, Santos E, Aaronson SA, Chan AM. A novel insertional mutation in the TC21 gene activates its transforming activity in a human leiomyosarcoma cell line. Oncogene. 1995;11:1255–1260. [PubMed] [Google Scholar]
- Keely PJ, Rusyn EV, Cox AD, Parise LV. R-Ras signals through specific integrin alpha cytoplasmic domains to promote migration and invasion of breast epithelial cells. J Cell Biol. 1999;145:1077–1088. doi: 10.1083/jcb.145.5.1077. [DOI] [PMC free article] [PubMed] [Google Scholar]
- Kelley GG, Reks SE, Smrcka AV. Hormonal regulation of phospholipase Cepsilon through distinct and overlapping pathways involving G12 and Ras family G-proteins. Biochem J. 2004;378:129–139. doi: 10.1042/BJ20031370. [DOI] [PMC free article] [PubMed] [Google Scholar]
- Komatsu M, Ruoslahti E. R-Ras is a global regulator of vascular regeneration that suppresses intimal hyperplasia and tumor angiogenesis. Nat Med. 2005;11:1346–1350. doi: 10.1038/nm1324. [DOI] [PubMed] [Google Scholar]
- Kozian DH, Augustin HG. Transcriptional regulation of the Ras-related protein TC21/R-Ras2 in endothelial cells. FEBS Lett. 1997;414:239–242. doi: 10.1016/s0014-5793(97)01038-7. [DOI] [PubMed] [Google Scholar]
- Larkin JE, Frank BC, Gaspard RM, Duka I, Gavras H, Quackenbush J. Cardiac transcriptional response to acute and chronic angiotensin II treatments. Physiol Genomics. 2004;18:152–166. doi: 10.1152/physiolgenomics.00057.2004. [DOI] [PubMed] [Google Scholar]
- Lee JH, et al. Greater expression of TC21/R-ras2 in highly aggressive malignant skin cancer. Int J Dermatol. 2011;50:956–960. doi: 10.1111/j.1365-4632.2010.04846.x. [DOI] [PubMed] [Google Scholar]
- Light Y, Paterson H, Marais R. 14-3-3 antagonizes Ras-mediated Raf-1 recruitment to the plasma membrane to maintain signaling fidelity. Mol Cell Biol. 2002;22:4984–4996. doi: 10.1128/MCB.22.14.4984-4996.2002. [DOI] [PMC free article] [PubMed] [Google Scholar]
- Lopez-Barahona M, Bustelo XR, Barbacid M. The TC21 oncoprotein interacts with the Ral guanosine nucleotide dissociation factor. Oncogene. 1996;12:463–470. [PubMed] [Google Scholar]
- Luo H, Hao X, Ge C, Zhao F, Zhu M, Chen T, Yao M, He X, Li J. TC21 promotes cell motility and metastasis by regulating the expression of E-cadherin and N-cadherin in hepatocellular carcinoma. Int J Oncol. 2010;37:853–859. doi: 10.3892/ijo_00000736. [DOI] [PubMed] [Google Scholar]
- Macha MA, Matta A, Sriram U, Thakkar A, Shukla NK, Datta Gupta S, Ralhan R. Clinical significance of TC21 overexpression in oral cancer. J Oral Pathol Med. 2009;39:477–485. doi: 10.1111/j.1600-0714.2009.00854.x. [DOI] [PubMed] [Google Scholar]
- Martinez-Martin N, et al. T cell receptor internalization from the immunological synapse is mediated by TC21 and RhoG GTPase-dependent phagocytosis. Immunity. 2011;35:208–222. doi: 10.1016/j.immuni.2011.06.003. [DOI] [PMC free article] [PubMed] [Google Scholar]
- McFall A, Ulku A, Lambert QT, Kusa A, Rogers-Graham K, Der CJ. Oncogenic Ras blocks anoikis by activation of a novel effector pathway independent of phosphatidylinositol 3-kinase. Mol Cell Biol. 2001;21:5488–5499. doi: 10.1128/MCB.21.16.5488-5499.2001. [DOI] [PMC free article] [PubMed] [Google Scholar]
- Mendes-Pereira AM, et al. Genome-wide functional screen identifies a compendium of genes affecting sensitivity to tamoxifen. Proc Natl Acad Sci USA. 2012;109:2730–2735. doi: 10.1073/pnas.1018872108. [DOI] [PMC free article] [PubMed] [Google Scholar]
- Movilla N, Crespo P, Bustelo XR. Signal transduction elements of TC21, an oncogenic member of the R-Ras subfamily of GTP-binding proteins. Oncogene. 1999;18:5860–5869. doi: 10.1038/sj.onc.1202968. [DOI] [PubMed] [Google Scholar]
- Murphy GA, Graham SM, Morita S, Reks SE, Rogers-Graham K, Vojtek A, Kelley GG, Der CJ. Involvement of phosphatidylinositol 3-kinase, but not RalGDS, in TC21/R-Ras2-mediated transformation. J Biol Chem. 2002;277:9966–9975. doi: 10.1074/jbc.M109059200. [DOI] [PubMed] [Google Scholar]
- Nagi A, Gertsenstein M, Vintersen K, Behringer K. Manipulating the Mouse Embryo: A Laboratory Manual. Cold Spring Harbor, NY: Cold Spring Harbor Press; 2003. [Google Scholar]
- Nunez Rodriguez N, Lee IN, Banno A, Qiao HF, Qiao RF, Yao Z, Hoang T, Kimmelman AC, Chan AM. Characterization of R-ras3/m-ras null mice reveals a potential role in trophic factor signaling. Mol Cell Biol. 2006;26:7145–7154. doi: 10.1128/MCB.00476-06. [DOI] [PMC free article] [PubMed] [Google Scholar]
- Ohba Y, Mochizuki N, Yamashita S, Chan AM, Schrader JW, Hattori S, Nagashima K, Matsuda M. Regulatory proteins of R-Ras, TC21/R-Ras2, and M-Ras/R-Ras3. J Biol Chem. 2000;275:20020–20026. doi: 10.1074/jbc.M000981200. [DOI] [PubMed] [Google Scholar]
- Rokavec M, Schroth W, Amaral SM, Fritz P, Antoniadou L, Glavac D, Simon W, Schwab M, Eichelbaum M, Brauch H. A polymorphism in the TC21 promoter associates with an unfavorable tamoxifen treatment outcome in breast cancer. Cancer Res. 2008;68:9799–9808. doi: 10.1158/0008-5472.CAN-08-0247. [DOI] [PubMed] [Google Scholar]
- Rong R, He Q, Liu Y, Sheikh MS, Huang Y. TC21 mediates transformation and cell survival via activation of phosphatidylinositol 3-kinase/Akt and NF-kappaB signaling pathway. Oncogene. 2002;21:1062–1070. doi: 10.1038/sj.onc.1205154. [DOI] [PubMed] [Google Scholar]
- Rosario M, Paterson HF, Marshall CJ. Activation of the Raf/MAP kinase cascade by the Ras-related protein TC21 is required for the TC21-mediated transformation of NIH 3T3 cells. EMBO J. 1999;18:1270–1279. doi: 10.1093/emboj/18.5.1270. [DOI] [PMC free article] [PubMed] [Google Scholar]
- Rosario M, Paterson HF, Marshall CJ. Activation of the Ral and phosphatidylinositol 3′ kinase signaling pathways by the ras-related protein TC21. Mol Cell Biol. 2001;21:3750–3762. doi: 10.1128/MCB.21.11.3750-3762.2001. [DOI] [PMC free article] [PubMed] [Google Scholar]
- Sauzeau V, Jerkic M, Lopez-Novoa JM, Bustelo XR. Loss of Vav2 proto-oncogene causes tachycardia and cardiovascular disease in mice. Mol Biol Cell. 2007;18:943–952. doi: 10.1091/mbc.E06-09-0877. [DOI] [PMC free article] [PubMed] [Google Scholar]
- Sauzeau V, Sevilla MA, Rivas-Elena JV, de Alava E, Montero MJ, Lopez-Novoa JM, Bustelo XR. Vav3 proto-oncogene deficiency leads to sympathetic hyperactivity and cardiovascular dysfunction. Nat Med. 2006;12:841–845. doi: 10.1038/nm1426. [DOI] [PMC free article] [PubMed] [Google Scholar]
- Shang X, et al. R-Ras and Rac GTPase cross-talk regulates hematopoietic progenitor cell migration, homing, and mobilization. J Biol Chem. 2011;286:24068–24078. doi: 10.1074/jbc.M111.226951. [DOI] [PMC free article] [PubMed] [Google Scholar]
- Singh G, et al. R-Ras is required for murine dendritic cell maturation and CD4+ T-cell priming. Blood. 2012;119:1693–1701. doi: 10.1182/blood-2011-05-357319. [DOI] [PMC free article] [PubMed] [Google Scholar]
- Sleeman KE, Kendrick H, Ashworth A, Isacke CM, Smalley MJ. CD24 staining of mouse mammary gland cells defines luminal epithelial, myoepithelial/basal and non-epithelial cells. Breast Cancer Res. 2006;8:R7. doi: 10.1186/bcr1371. [DOI] [PMC free article] [PubMed] [Google Scholar]
- Sternlicht MD, Kouros-Mehr H, Lu P, Werb Z. Hormonal and local control of mammary branching morphogenesis. Differentiation. 2006;74:365–381. doi: 10.1111/j.1432-0436.2006.00105.x. [DOI] [PMC free article] [PubMed] [Google Scholar]
- Sternlicht MD, Sunnarborg SW, Kouros-Mehr H, Yu Y, Lee DC, Werb Z. Mammary ductal morphogenesis requires paracrine activation of stromal EGFR via ADAM17-dependent shedding of epithelial amphiregulin. Development. 2005;132:3923–3933. doi: 10.1242/dev.01966. [DOI] [PMC free article] [PubMed] [Google Scholar]
- Stingl J, Raouf A, Eirew P, Eaves CJ. Deciphering the mammary epithelial cell hierarchy. Cell Cycle. 2006;5:1519–1522. doi: 10.4161/cc.5.14.2983. [DOI] [PubMed] [Google Scholar]
- Theiler K. The House Mouse: Atlas of Embryonic Development. New York: Springer-Verlag; 1989. [Google Scholar]
- Welm BE, Dijkgraaf GJ, Bledau AS, Welm AL, Werb Z. Lentiviral transduction of mammary stem cells for analysis of gene function during development and cancer. Cell Stem Cell. 2008;2:90–102. doi: 10.1016/j.stem.2007.10.002. [DOI] [PMC free article] [PubMed] [Google Scholar]
- Zhu Y, Zhong X, Zheng S, Ge Z, Du Q, Zhang S. Transformation of immortalized colorectal crypt cells by microcystin involving constitutive activation of Akt and MAPK cascade. Carcinogenesis. 2005;26:1207–1214. doi: 10.1093/carcin/bgi069. [DOI] [PubMed] [Google Scholar]
Associated Data
This section collects any data citations, data availability statements, or supplementary materials included in this article.