

Abstract
Many researchers have noted that the functional architecture of the human brain is relatively invariant during task performance and the resting state. Indeed, intrinsic connectivity networks (ICNs) revealed by resting‐state functional connectivity analyses are spatially similar to regions activated during cognitive tasks. This suggests that patterns of task‐related activation in individual subjects may result from the engagement of one or more of these ICNs; however, this has not been tested. We used a novel analysis, spatial multiple regression, to test whether the patterns of activation during an N‐back working memory task could be well described by a linear combination of ICNs delineated using Independent Components Analysis at rest. We found that across subjects, the cingulo‐opercular Set Maintenance ICN, as well as right and left Frontoparietal Control ICNs, were reliably activated during working memory, while Default Mode and Visual ICNs were reliably deactivated. Further, involvement of Set Maintenance, Frontoparietal Control, and Dorsal Attention ICNs was sensitive to varying working memory load. Finally, the degree of left Frontoparietal Control network activation predicted response speed, while activation in both left Frontoparietal Control and Dorsal Attention networks predicted task accuracy. These results suggest that a close relationship between resting‐state networks and task‐evoked activation is functionally relevant for behavior, and that spatial multiple regression analysis is a suitable method for revealing that relationship. Hum Brain Mapp, 2011. © 2011 Wiley‐Liss, Inc.
Keywords: fMRI, resting state, reaction time, frontoparietal, default mode, set maintenance, dorsal attention
INTRODUCTION
Functional magnetic resonance imaging (fMRI) studies of the human brain in a resting state (that is, while subjects are not engaged in a directed task) have demonstrated that spontaneous fluctuations in activity within various distinct regions exhibit a strong temporal correlation, suggesting that the correlated regions form a functional network [Biswal et al.,1995]. Several such functional networks have been identified [Beckmann et al.,2005; De Luca et al.,2006], and these networks are spatially consistent across subjects and across testing sessions [Chen et al.,2008; Meindl et al.,2009; Shehzad et al.,2009; Van Dijk et al.,2010]. These networks, termed “intrinsic connectivity networks” (ICNs) [Seeley et al.,2007] have been posited to represent a fundamental functional organization of the brain [Fox and Raichle,2007]. However, the extent to which this functional network architecture may be relevant to cognition is an open question.
It is well established that there is close correspondence between the spatial composition of ICNs and sets of regions engaged by specific cognitive processes. For example, the Default Mode network is one well‐studied ICN comprising the ventral and anterior medial prefrontal cortex, the precuneus/posterior cingulate cortex, and bilateral angular gyrus [Buckner et al.,2008]. These same regions are also reliably activated during self‐referential processing, such as autobiographical memory and theory of mind tasks [Spreng et al.,2009], and reliably deactivated during performance of tasks requiring a focus on external stimuli rather than on the self [Raichle et al.,2001]. The close correspondence between the spatial extent of the functional connectivity pattern identified during the resting state and the activation/deactivation pattern during task‐evoked states suggests that the Default Mode ICN is being engaged or suppressed by task demands. This observation—that an entire ICN may be engaged or suppressed by some task demands—appears to hold true not just for the Default Mode network, but also for other ICNs. Spatial similarities between task activation and resting connectivity have similarly been observed in motor [Biswal et al.,1995], visual [Lowe et al.,1998], and higher‐order executive control regions [Fransson,2006]. In a formal analysis of this effect, a close spatial correspondence between ICNs and task‐evoked activation patterns was demonstrated between resting‐state ICNs identified in a relatively small group of subjects and task‐related activation peaks reported in more than 7,000 fMRI studies using a variety of tasks [Smith et al.,2009]. Such evidence supports the notion that ICNs are functionally specialized to subserve discrete cognitive processes. Specific networks have been identified as serving sensory functions, such as a Visual network, an Auditory network, and a Somatosensory network [Beckmann et al.,2005], while others serve higher functions, such as a Frontoparietal Executive Control network and a cingulo‐opercular Set Maintenance network [Dosenbach et al.,2007]. This suggests that specific regions may tend to activate together in the same tasks because they are intrinsically linked into a coherent network specialized for discrete forms of information processing.
Complex cognitive functions that involve multiple forms of information processing are likely to draw upon multiple ICNs, each contributing a distinct cognitive process. One complex cognitive function is the short‐term maintenance and manipulation of information in the face of distracting stimuli, commonly referred to as working memory. Working memory is often measured by the N‐back task, in which subjects see a continuous sequence of stimuli and are required to press a button whenever a stimulus matches a stimulus they saw n trials ago. This task draws upon several cognitive processes, including visual attention and monitoring of presented stimuli, maintenance of target information in working memory, identification and orienting toward targets when they appear, constant updating of new target information, and suppression of previously relevant but currently irrelevant targets [Owen et al.,2005]. These cognitive processes are likely subserved by brain regions comprising multiple ICNs, rather than by a single ICN. Indeed, the regions activated during N‐back performance, which include dorsal anterior cingulate cortex, dorsolateral and ventrolateral prefrontal cortex, and inferior parietal lobule [D'Esposito et al.,1998; Owen et al.,2005], are part of two ICNs, the Frontoparietal Control network and the Set Maintenance network. Further, activation within these regions, particularly in the frontal lobe, is known to scale with the “n” or working memory load of the N‐back task [Braver et al.,1997; Manoach et al.,1997]. However, no previous study has tested ICN engagement during the task‐evoked state in individual subjects by examining the extent to which the spatial pattern of activation matches ICNs identified in the resting state.
The nature and extent of ICN engagement is known to predict individual differences in cognition. In healthy subjects scanned at rest, there is some variability in the spatial extent and connectivity strength of these networks [Damoiseaux et al.,2006; Mennes et al.,2010]. There is also variability in task‐evoked functional connectivity strength [Hampson et al.,2006] and the activation/suppression of regions within these networks [Eichele et al.,2008; Weissman et al.,2006]. In some networks, this individual variability is associated with differences in performance, as lower Default Mode network suppression and weaker functional connectivity was associated with more errors and slower performance [Eichele et al.,2008; Hampson et al.,2006; Weissman et al.,2006]. Further, altered activation/suppression and connectivity of several networks has been linked to neuropsychological disorders such as Attention Deficit‐Hyperactivity Disorder [Cao et al.,2006; Castellanos et al.,2008; Fassbender et al.,2009; Uddin et al.,2008], Autism Spectrum Disorders [Kennedy and Courchesne,2008; Kennedy et al.,2006], Schizophrenia [Bluhm et al.,2007; Calhoun et al.,2008; Whitfield‐Gabrieli et al.,2009], and Alzheimer's disease [Greicius et al.,2004; Rombouts et al.,2005; Wermke et al.,2008], all of which include symptoms with some form of cognitive impairment. Thus, both normal variation in ICN engagement among healthy subjects and pathological variation among disordered populations are predictive of behavior. Together, this evidence suggests that engagement of ICNs during working memory performance ought to be associated with differences in task performance across individuals.
To summarize, close spatial correspondence between the ICNs observed during rest and the activation patterns observed during tasks suggests that complex cognitive processing may be conceptualized as activation of multiple ICNs delineated during the resting state. This possibility has not been formally tested within individual subjects. In the present study, we tested the hypothesis that a given subject's pattern of brain activation during working memory corresponds to the engagement of multiple ICNs, which are detected in that subject using functional connectivity analyses at rest. Furthermore, we hypothesized that the degree of network engagement will change as working memory load increases, and that the degree of network engagement will predict performance. Healthy young adults underwent fMRI during the resting state and during performance of an N‐back task with three levels of working memory load. We used a novel spatial multiple regression technique to compare the spatial extent of activation patterns observed in individual subjects during the N‐back task with subject‐level networks derived from an Independent Components Analysis (ICA) of the resting‐state data. This technique allows unbiased, hypothesis‐free comparisons of task‐related activation patterns with all ICNs in the brain. We predicted the following: first, patterns of N‐back‐evoked activation would be spatially similar to subjects' ICNs, specifically those ICNs comprising regions known to mediate working memory and cognitive control processes, such as the Frontoparietal Control network and the cingulo‐opercular Set Maintenance network. Second, the patterns of deactivation observed would be similar to the Default Mode network observed in those subjects. These results would demonstrate for the first time that individual variability in the shape of ICNs detected at rest is reflected in the variability in activation patterns observed during tasks. Third, as regions within the Frontoparietal Control, cingulo‐opercular Set Maintenance, and Default Mode networks are known to be sensitive to working memory load [Braver et al.,1997; McKiernan et al.,2003] and cognitive performance [Perlstein et al.,2003; Weissman et al.,2006], we predicted that the degree of engagement of these networks would be altered by increasing working memory loads and would predict behavioral performance.
MATERIALS AND METHODS
Participants
Forty‐four Georgetown University undergraduates (25 female) ages 18 to 22 years (mean ± SD = 19.22 ± 1.17) participated in the study for payment. Informed consent procedures were carried out according to Georgetown University's Institutional Review Board guidelines. Exclusion criteria included (1) self‐reported use of psychotropic medication (e.g., stimulants, anti‐anxiety/depression); (2) self‐reported history of neurological injury or disease, seizure disorder, psychiatric diagnosis; (3) contraindications for MRI—e.g., metal implants in the body, dental work involving metal, pregnancy. Four subjects were excluded from analysis due to technical problems during the resting‐state scanning session.
MRI Scanning Protocol
N‐back task
Subjects were scanned during performance of the N‐back task, in which nine 30 s blocks of task (three blocks each with 1‐, 2‐, and 3‐back trials) alternated with eight 15 s blocks of fixation, lasting for 6:26 min in total. Each N‐back block consisted of nine serially presented consonants appearing for 500 ms, with an intertrial interval of 2,500 ms. The N‐back load condition (1‐, 2‐, or 3‐back) varied between task blocks, with condition order pseudorandomized using a modified Latin Square. Each block was preceded by a 3,000 ms screen informing the subject of the condition. Subjects were instructed that, in each N‐back condition, they should press a right‐hand‐held button when the current letter matched the letter n trials ago. Targets were present on 19% of trials; each block contained between one and three targets with target frequency balanced across conditions. No condition contained sequences of stimuli that were appropriate as targets in any other condition. To eliminate learning effects during the scanning session, all subjects had been previously exposed to a variant of the same N‐back task with different stimulus sequences. Stimuli were presented using E‐Prime software (Psychology Software Tools Inc., Pittsburg, PA).
Rest
Subjects were scanned for 5:04 min while lying awake with eyes closed. Subjects were told to relax and to not think of anything in particular.
Image acquisition
All images were acquired on a 3.0T MRI Siemens Trio system. For each subject, a high resolution structural scan (MPRAGE) was acquired, followed by functional imaging during the N‐back task, followed by functional imaging during the resting state. The scan parameters were as follows: Structural—a T1‐weighted MPRAGE scan was acquired with the following parameters: TR/TE = 2,300/2.94 ms, TI = 900 ms, 90 degree flip angle, 1 slab, 160 sagittal slices with a 1.0 mm thickness, FOV = 256 × 256 mm2, matrix = 256 × 256, resulting in an effective resolution of 1.03 mm isotropic voxels. N‐back—193 whole‐brain images were acquired using a gradient echo pulse sequence (34 slices, TR = 2,000 ms, TE = 30 ms, 256 × 256 mm FOV, 90 degree flip angle, voxel dimensions 4 × 4 × 4.2 mm). Rest—150 whole‐brain images were acquired using a gradient echo pulse sequence (37 slices, TR = 2,000 ms, TE = 30 ms, 192 × 192 mm FOV, 90 degree flip angle, voxel dimensions 3 mm isotropic).
Data Analysis
Preprocessing
The first two images were discarded from both fMRI runs to allow for signal stabilization. The remaining images were processed in SPM5 (Wellcome Department of Cognitive Neurology, London, UK) implemented in MATLAB (Version 7.0 Mathworks, Inc., Sherborn, MA). For both the Rest and N‐back sessions, images were corrected for translational and rotational motion by realigning to the first image of the session. Exclusion criteria for excessive motion was set at 3 mm of translation (1 voxel width) in any orthogonal direction or 1° rotation around any one axis. All timepoints in all subjects were found to be below these criteria (actual range: all translation <1.2 mm; all rotation <1°). Images were then corrected for slice acquisition timing and were coregistered with the high‐resolution structural images. The structural images were segmented into separate gray and white matter images, and the gray matter image was normalized into standard MNI space by comparison with a template gray matter image. The normalization parameters used were then applied to the functional images to bring them into MNI space. All images were smoothed using a Gaussian kernel with full‐width at half‐maximum (FWHM) of 8 mm.
Following preprocessing, the following analysis were performed (as illustrated in Fig. 1).
Figure 1.

Schematic diagram of spatial multiple regression analysis steps. (A) For each subject, N‐back > Fixation contrasts were computed using a General Linear Model (GLM) to generate a spatial mask of N‐back activation. (B) Independent Component Analysis (ICA) was conducted for each subject, as well as for the entire group, to generate group‐level and subject‐level intrinsic connectivity network (ICN) maps. Subject‐level ICNs were identified by spatially correlating with group‐level ICNs. (C) For one subject, a spatial multiple regression was conducted in which the spatial pattern of the N‐back activation map (dependent variable; from step A) was explained as a linear combination of subject‐level ICNs (independent regressors; from step B). Parameter estimates for each network were obtained and fed into later analyses. [Color figure can be viewed in the online issue, which is available at wileyonlinelibrary.com.]
Regions activated and deactivated during N‐back task
First‐level analysis was performed using a general linear model as implemented in SPM5. For each subject, four temporal regressors were specified, each one consisting of a boxcar timeseries convolved with a hemodynamic response function. The regressors represented the timecourses of the 1‐back, 2‐back, 3‐back, and fixation conditions. For each subject, four contrasts were specified: Task > Fixation, representing the regions activated by the average of the three N‐back conditions; and 3‐back > Fixation, 2‐back > Fixation, and 1‐back > Fixation, representing regions activated for each load condition.
Group‐level ICNs
In order to delineate ICNs present in the group, the 150 time points of preprocessed resting data from each subject were temporally concatenated across subjects to create a single data set. An Independent Components Analysis (ICA) was performed on this dataset using the MELODIC toolbox [Beckmann and Smith,2004] implemented within FSL (Centre for Functional Magnetic Resonance Imaging of the Brain, University of Oxford, London, UK). This ICA algorithm was preset to specify 20 independent components, as this number of components has been shown to divide the brain into recognizable networks [Abou‐Elseoud et al.,2010]. The ICA thus delineated 20 components in the form of 20 three‐dimensional Z‐score images, in which the Z‐score in each voxel represents the degree of covariation with the rest of the network. Group‐level components in which the areas of maximal covariation were non‐neuronal (e.g., white matter, cerebrospinal fluid, brain edge covariation resulting from head motion) were visually identified and removed from further analysis. The remaining group components were visually inspected for similarities to known brain networks.
Subject‐level ICNs
In order to discover coherent networks within each subject's brain, ICA was performed on each subject's preprocessed resting data, with the algorithm again preset to return 20 independent components. The resulting components represented the networks detectable in each subject's brain.
A Fourier transform of the average time‐course within each of these subject‐level networks was conducted to determine the frequencies present in that network. As neuronally based ICNs are known to oscillate at frequencies between 0.01 and 0.1 Hz [Biswal et al.,1995], we considered any detected network which contained more than 50% of its total signal energy in a range above 0.1 Hz to be an artifactual network. Such networks were removed from further analysis.
Each of these subject‐level networks delineated by the ICA analysis was presumed to be that subject's version of one of the ICNs identified at the group level. To identify which group‐level network best matched each subject‐level network, all unthresholded (whole‐brain image) subject‐level networks were spatially correlated against all unthresholded group‐level networks, separately for each subject. The spatial correlation procedure involved using MARSBAR [Brett et al.,2003] to extract the Z‐scores of the subject‐level network within every voxel in the brain, and then reshaping the three‐dimensional matrix of voxel values into a one‐dimensional vector. This extraction was then repeated for the group‐level network, and a Pearson's correlation was computed between the subject‐level network vector of Z‐scores and the group network vector of Z‐scores. The resulting r value represents the square root of the percent of variance in the spatial pattern of Z‐scores from the individual subject network that can be explained by the spatial pattern of the group‐level network. In order to identify each individual subject network as a version of a group‐level network, the subject‐level network was spatially correlated against all group‐level networks; the group‐level network with the most positive r value was the group network which explained the highest percentage of the variance in the individual network. This group network was considered the best spatial match for that individual network, and the individual network was thus considered that subject's version of that group network. Individual networks which did not match any group‐level network with an r value of greater than 0.1 were considered to have no group‐level equivalent. Such networks with no group‐level match were not included in later analyses. This relatively liberal threshold of r = 0.1 was used in order to preserve individual variability in network shape.
This analysis allowed comparison of different ICA‐delineated networks across different subjects (i.e., subject‐level networks from two subjects which matched the same group‐level network could be treated as the “same” network in each subject).
ICNs engaged during N‐back task performance
In order to test the hypothesis that each individual's task activation map can be expressed as a combination of that subject's ICNs identified during rest, we conducted a spatial multiple regression to explain the spatial pattern of each subject's unthresholded task‐activation map as a linear combination of all of that subject's unthresholded ICA‐derived ICN maps. As in the spatial correlation procedure described earlier, the Z‐scores of each individual subject network were extracted within every voxel in the brain and the three‐dimensional matrix of voxel values was reshaped into a one‐dimensional vector. These vectors were used as regressors against a similarly reshaped vector of the values within the previously calculated Task > Fixation contrast map. Notably, only valid individual‐level networks (as determined by the spatial correlation procedure above) were entered as regressors. Thus, different subjects could have different numbers of regressors. However, this variability did not affect subsequent results (see Supp. Info.).
This analysis returned an r 2 value for each subject, reflecting the degree to which that subject's spatial pattern of task activation can be explained as a combination of ICNs. The analysis also returned a (β) value for each network in each subject, reflecting the degree to which the spatial pattern of that particular ICN explained the spatial pattern of task activation—in other words, the degree to which that network was active during the N‐back task for that subject. To identify which networks were reliably activated during the N‐back task across subjects, one‐sample t‐tests (testing against the null hypothesis of (β) = 0) were conducted for the beta values in each network, and the results were Bonferroni‐corrected for the number of t‐tests conducted.
Effect of working memory load on ICN activation
To test the prediction that networks important for task performance would be more likely to be activated at higher loads, we repeated the same methods detailed above for each load condition. Thus, spatial multiple regression was used to compare subject‐level ICNs with the individual subject's 1‐back > Fixation, 2‐back > Fixation, and 3‐back > Fixation contrasts. To examine the effect of load on each network, that network's (β) values (activation) from each subject were analyzed with a repeated measures one‐way ANOVA, with condition (1‐back, 2‐back, 3‐back) as the within‐subjects factor. The critical significance value for the effect of load was determined by Bonferroni‐correction for the total number of networks analyzed (and therefore, ANOVAs conducted). For networks with significant load effects, post hoc t‐tests were conducted to determine the direction of load modulation.
Comparison of ICN activation to task performance
We hypothesized that individual variability in the degree to which ICNs were activated by the n‐back task would predict task performance. Both mean reaction time (RT) for correct target responses and percent accuracy (correct targets minus false alarms) were computed for each subject across all load conditions. To test for effects of network activation on RT, a multiple regression was performed with the beta values for each ICN entered as regressors. As accuracy was at or near ceiling in all conditions, we computed a categorical measure for accuracy by classifying each subject as either performing perfectly across all conditions, or as having committed at least one error in the experiment. To test for effects of network activation on accuracy, a binary logistic multiple regression was performed with the calculated (β) values entered as regressors testing for effects on accuracy (perfect/not perfect). In these regressions, if a subject had no subject‐level ICN matching a given group‐level ICN above the threshold of r > 0.1, a (β) value of 0 was used for that network in that subject.
RESULTS
Behavior
A repeated‐measures one‐way ANOVA testing for load effects on percent accuracy showed a main effect of load, F (2,38) = 13.59, P < 0.001. Pairwise contrasts indicated that mean accuracy in the 1‐back (99.4% ± 2.8%) and 2‐back (99.8% ± 1.0%) conditions were near ceiling and did not differ, but both were performed more accurately than the 3‐back condition (85.3% ± 19.5%), P < 0.001. However, the 3‐back condition was also performed near ceiling level in some subjects, as 22 of the 40 subjects had 100% accuracy in the 3‐back condition. Over all task conditions, twenty subjects had 100% accuracy, while 20 subjects made one or more mistakes.
A repeated measures one‐way ANOVA on response times (mean ± SD) showed a main effect of load, F(2,38) = 15.14, P < 0.001. Pairwise contrasts indicated that the 1‐back task (518 ± 150 ms) was performed faster than the 2‐back task (575 ± 174 ms), t (39) = 2.24, P < 0.05; and the 2‐back task was performed faster than the 3‐back task (684 ± 268 ms), t (39) = 3.45, P = 0.001 (Fig. 2). Overall mean RTs did not differ between the subjects with perfect accuracy and those with at least one error (P > 0.1), indicating that RTs were not being driven by a speed‐accuracy tradeoff (for further evidence see Supp. Info.).
Figure 2.
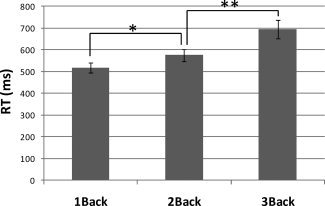
Mean ± SD reaction times (RTs) for the N‐back task for three load conditions. RTs differed significantly by load. *Differences at P < 0.05; **differences at P = 0.001.
Regions Activated and Deactivated During N‐Back Task
Figure 3 displays N‐back versus Fixation contrast maps for five representative subjects. Visual examination of subjects' N‐back > Fixation contrast maps (thresholded at P < 0.01 for visualization purposes) suggested that most subjects activated a variety of frontal and parietal regions, commonly including dorsal medial supplementary motor area extending into dorsal anterior cingulate cortex, bilateral premotor cortex, bilateral middle frontal gyrus, bilateral anterior insula, bilateral thalamus, bilateral inferior parietal lobule, and bilateral middle and lateral cerebellum. This pattern of activation, in particular the medial and lateral prefrontal clusters, as well as the lateral parietal clusters, is broadly consistent with those reported in previous studies using the N‐back task [D'Esposito et al.,1998; Owen et al.,2005]. Examination of the reverse contrasts (Fixation > N‐back) suggested that subjects commonly deactivated posterior cingulate cortex extending into precuneus, cuneus, and retrosplenial cortex; ventral medial prefrontal cortex extending into anterior medial prefrontal cortex; bilateral posterior insula; bilateral angular gyrus; and bilateral ventral and medial temporal cortex including hippocampus, parahippocampal gyrus, and fusiform gyrus. This pattern of deactivation, in particular the posterior cingulate, ventral medial prefrontal, and angular gyrus clusters, is broadly consistent with the “Default Mode network,” a set of brain regions which consistently deactivates compared to baseline conditions across many tasks [Raichle et al.,2001]. These activation/deactivation patterns were also observed at the group level (see Supp. Info., Fig. S1).
Figure 3.

N‐back > Fixation (red‐yellow) and Fixation > N‐back (blue‐green) contrasts from five representative subjects, thresholded at P < 0.01 uncorrected for visualization purposes. Note that the contrast maps were unthresholded when used in the later spatial multiple regression analysis. [Color figure can be viewed in the online issue, which is available at wileyonlinelibrary.com.]
Group‐Level ICNs
ICA of all subjects' concatenated rest datasets delineated 20 spatial networks of coherent activity. Nine networks were identified as deriving from non‐neuronal sources: two from CSF, three from eyeball movement, and four from subject head motion. The remaining 11 networks (Fig. 4; Table I) were labeled based upon visual similarity to past reports. These networks included: a cingulo‐opercular Set Maintenance network, a left‐lateralized Frontoparietal Control network, and a right‐lateralized Frontoparietal Control network [identified by Dosenbach et al.,2007; lateralization shown by Beckmann et al.,2005; Habas et al.,2009; Kiviniemi et al.,2009; Smith et al.,2009; Stevens et al.,2009]; a posterior Default Mode network and an anterior Default Mode network [identified by Greicius et al.,2003; anterior‐posterior split shown by numerous studies including Abou‐Elseoud et al.,2010; Smith et al.,2009; Uddin et al.,2009; Zuo et al.,2010]; a Dorsal Attention network [Fox et al.,2006]; an Auditory network [Upadhyay et al.,2008]; a Visual network [De Luca et al.,2006]; a Sensorimotor network [Biswal et al.,1995]; a Language network [Hampson et al.,2002]; and a medial/lateral temporal cortex network which has not been well described in previous literature, and which we tentatively name a Memory network.
Figure 4.

Eleven ICNs delineated in the resting‐state data by the ICA procedure. ICN maps are thresholded at Z = 4.9, corresponding to a voxelwise probability of inclusion in the network of 99.9%. Note that the ICN maps were unthresholded when used in the later spatial multiple regression analysis. [Color figure can be viewed in the online issue, which is available at wileyonlinelibrary.com.]
Table I.
ICA‐derived resting‐state ICNs
| Network | Peak coordinates (MNI) | Peak location | Network | Peak coordinates (MNI) | Peak location |
|---|---|---|---|---|---|
| Memory | 16, 4, −20 | Right parahippocampal | Dorsal Attention | −12, −60, 56 | Left precuneus |
| −20, −4, −24 | Left hippocampus | 12, −64, 56 | Right precuneus | ||
| −32, 8, −28 | Left superior temporal | −52, 8, 24 | Left inferior frontal | ||
| Set Maintenance | 28, 48, 28 | Right middle frontal | −40, 36, 28 | Left middle frontal | |
| 4, 32, 20 | Dorsal anterior cingulate | −24, 0, 64 | Left superior frontal | ||
| 4, −28, 44 | Posterior middle cingulate | 24, 0, 60 | Right superior frontal | ||
| −44, 12, −4 | Left anterior insula | Anterior DMN | −4, 56, −8 | Ventral medial frontal | |
| −56, 0, 4 | Left frontal operculum | −24, 40, 40 | Left superior frontal | ||
| −20, 12, −8 | Ventral striatum | −8, −56, 20 | Posterior cingulate | ||
| 40, 16, −4 | Right anterior insula | Language | −60, −56, 20 | Left middle temporal | |
| −40, 44, 24 | Left middle frontal | −52, 24, −8 | Left inferior frontal | ||
| −36, 40, 32 | Left middle frontal | −60, −32, −4 | Left middle temporal | ||
| 60, −32, 36 | Right supramarginal | 56, −48, 24 | Right supramarginal | ||
| −64, −40, 32 | Left supramarginal | 52, 24, −4 | Right inferior frontal | ||
| Left FPC | −52, 16, 24 | Left middle frontal | 56, −28, −8 | Right middle temporal | |
| −48, 28, 20 | Left inferior frontal | −4, 56, 24 | Medial superior frontal | ||
| −48, 44, −4 | Left inferior frontal | 4, 20, 60 | Medial superior frontal | ||
| −32, −68, 44 | Left inferior parietal | −28, −84, −36 | Left lateral cerebellum | ||
| −48, −48, 48 | Left inferior parietal | 40, 12, 44 | Right middle frontal | ||
| −60, −44, −12 | Left middle temporal | −44, 8, 48 | Left precentral | ||
| 8, −80, −28 | Right medial cerebellum | 0, −52, 36 | Medial precuneus | ||
| 28, −68, −32 | Right lateral cerebellum | Right FPC | 48, 28, 24 | Right inferior frontal | |
| 52, 40, 12 | Right inferior frontal | 32, 12, 56 | Right middle frontal | ||
| Sensorimotor | 0, −12, 52 | Medial supplementary motor | 36, −60, 48 | Right inferior parietal | |
| 28, −28, 60 | Right postcentral | 56, −48, −12 | Right inferior temporal | ||
| −28, −20, 64 | Left postcentral | −12, −80, −28 | Left medial cerebellum | ||
| Posterior DMN | 4, −60, 24 | Posterior cingulate | Auditory | −60, −8, 24 | Left postcentral |
| 0, −60, 44 | Medial precuneus | −40, −12, 12 | Left posterior insula | ||
| 44, −64, 36 | Right angular | −44, −32, 16 | Left superior temporal | ||
| −40, −72, 40 | Left angular | 56, −8, 32 | Right postcentral | ||
| Visual | −4, −76, 16 | Calcarine | 60, 0, 20 | Right postcentral | |
| 0, −4, 56 | Medial supplementary motor area | ||||
| −20, −28, 68 | Left postcentral | ||||
Coordinates and location of network “peaks” (voxels of local maximal covariation with the network) are listed.
Subject‐Level ICNs
For each subject‐level ICN delineated by the ICA procedure, spatial correlations were conducted with every group‐level ICN to determine the best individual‐group matches; these subject‐level ICNs were labeled as that subject's version of the group‐level ICN. Across subjects, valid subject‐level ICN matches (i.e., above the threshold of r = 0.1) were found for 91.8% of the group‐level networks. Seventeen of 40 subjects had subject‐level versions of all 11 group‐level ICNs; no subject had subject‐level versions of fewer than eight group‐level ICNs (i.e., three missing ICNs). The average number of valid subject‐level ICNs was 10.1 out of 11 (less than 1 missing). This low variability in regressor number suggests that the number of ICNs present was unlikely to drive any systematic effects on the resulting (β) values; and indeed, formal tests revealed no effect of the number of valid ICNs on subsequent results (Supp. Info.).
Of valid group‐individual network matches, the mean ± SD r value was 0.42 ± 0.17. Across subjects, the networks with the lowest average r values were the Memory (0.24 ± 0.08) and Sensorimotor (0.29 ± 0.12) networks; all other networks had average r values between 0.38 and 0.63. The Sensorimotor network was the network that most commonly had no valid group‐individual matches; it was present in 29 of 40 individuals (72.5%). All other networks were present in at least 34 of 40 individuals (85%).
ICNs Engaged During N‐Back Task Performance
For each subject, spatial multiple regressions were conducted evaluating the spatial pattern of N‐back activation as a linear combination of ICNs. The average r 2 of these regressions across subjects was 0.38 (SD = 0.12; range = 0.11–0.59). Thus, the linear combination of ICNs explained on average 38% of the variance of the spatial pattern of task‐evoked activations.
(β) values from this spatial multiple regression were calculated for each network in each subject, reflecting the degree to which that network was activated (or deactivated, in the case of a negative beta value) during the N‐back task (see Fig. 5). A one‐sample t‐test of these beta values was conducted across subjects for each of the 11 networks. Networks for which beta values were significantly different than zero at P < 0.05 after Bonferroni correction for the 11 t‐tests (critical threshold: P < 0.0045) included the right Frontoparietal Control network (mean ± SD = 0.14 ± 0.12), the cingulo‐opercular Set Maintenance network (0.10 ± 0.12), the left Frontoparietal Control network (0.083 ± 0.14), all of which were significantly activated, as well as the anterior Default Mode network (−0.15 ± 0.16), posterior Default Mode network (−0.11 ± 0.13), and Visual network (−0.11 ± 0.13), which were significantly deactivated. The Dorsal Attention network (0.049 ± 0.11, P = 0.006 uncorrected) and the Memory network (−0.039 ± 0.099, P = 0.018 uncorrected) were also respectively activated and deactivated, but did not survive correction for multiple comparisons.
Figure 5.

Results of the spatial multiple regression analysis comparing subject‐level ICNs with subject‐level Task > Fixation contrasts. The graph displays average (β) values across subjects for every network. *Values were significantly different from zero (P < 0.05, corrected for the number of networks).
Effect of Working Memory Load on ICN Activation
Three spatial multiple regressions were conducted to determine the degree to which the networks were activated during the 1‐back, 2‐back, and 3‐back conditions (see Fig. 6). For each network, the resulting beta values for the three conditions were entered into a repeated‐measures one‐way ANOVA testing for effects of load at P < 0.05 after Bonferroni correction for 11 ANOVAs (critical threshold: P < 0.0045). Activation differed significantly among the three levels of load for the Dorsal Attention network (F (2,38) = 6.83), the Set Maintenance network (F (2,38) = 12.20), the left Frontoparietal Control network (F (2,38) = 19.80), and the right Frontoparietal Control network (F (2,38) = 17.27). Effects of load were also observed in the Visual network (F (2,38) = 5.20, P = 0.01 uncorrected), but this effect did not survive correction for multiple ANOVA tests.
Figure 6.
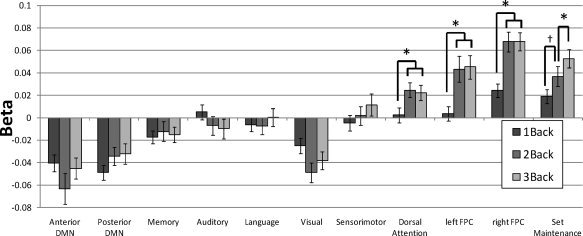
Results of the spatial multiple regression analysis assessing effect of working memory load by comparing subject‐level ICNs with subject‐level 1‐Back > Fixation, 2‐Back > Fixation, and 3‐Back > Fixation contrasts. The graph displays average (β) values across subjects for 11 networks included in the analysis, for each load. Significant effects of load were found in Dorsal Attention, Set Maintenance, and Frontoparietal Control networks. Differences between load conditions obtained from post hoc tests within those networks are indicated by *P < 0.05 and † P = .057.
Post hoc t‐tests for the networks modulated by load revealed that, for the Dorsal Attention and both left and right Frontoparietal Control networks, activation was lower during the 1‐back than 2‐back and 3‐back conditions (all P < 0.005), but 2‐back and 3‐back conditions did not differ (all P > 0.5). In contrast, the Set Maintenance network showed a graded pattern of activation such that activation was lower during the 1‐back than 2‐back condition (P = 0.057), which in turn was lower than activation in the 3‐back condition (P = 0.014). We further examined whether these four load‐sensitive networks had activation greater than zero in all three loads by conducting one‐sample t‐tests on the (β) values of each network in each load condition. We found that the Dorsal Attention and left Frontoparietal Control networks had activity greater than zero in 2‐back and 3‐back conditions (P < 0.005), but not in the 1‐back condition (P > 0.5). The Set Maintenance and right Frontoparietal Control networks had activation greater than zero for all three loads (P < 0.005). This suggests that the Set Maintenance and right Frontoparietal Control networks were active under all load conditions, but that the Dorsal Attention and left Frontoparietal Control networks only activated during the more difficult conditions.
Comparison of ICN Activation With Task Performance
The (β) values for each network from the spatial multiple regression analysis (across load) were entered as regressors in a multiple regression testing for effects of network activation on mean RT across all loads. Only activation of left Frontoparietal Control network predicted RT significantly (P = 0.033). A post‐hoc test showed that left Frontoparietal Control network activation correlated negatively with RT (r (39) = −0.31, P = 0.053; Fig. 7), such that subjects with greater left Frontoparietal Control network activation during the N‐back task had faster mean RT across all conditions. This effect was not due to any systematic differences between subjects with and without 100% accuracy, as mean RT did not differ between these groups, and the effect was still present at trend level if only perfectly‐performing subjects were included (Supp. Info.). The (β) values for each network were also entered as regressors in a binary logistic multiple regression testing for effects of network activation on binary accuracy (perfect or not perfect). Greater activation of both the Dorsal Attention network (B = 36.9, Wald = 5.44, P = 0.020) and the left Frontoparietal Control network (B = 9.90, Wald = 4.09, P = 0.043) significantly predicted a greater likelihood to have perfect accuracy across all conditions.
Figure 7.
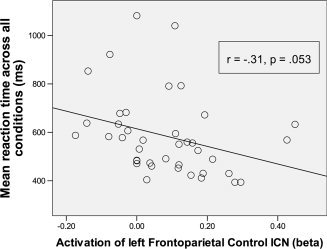
Correlation between spatial multiple regression (β) values from the left Frontoparietal control network and reaction time.
DISCUSSION
Using a novel spatial multiple regression technique, the present study found that the spatial extent of selective intrinsic connectivity networks (ICN), characterized while subjects were in the resting state, corresponded to their pattern of functional neural engagement during working memory assessed by the N‐back task. Of the 11 ICNs included, the patterns of activation best matched the left and right Frontoparietal Control networks and the cingulo‐opercular Set Maintenance network, and the pattern of deactivation best matched the anterior and posterior Default Mode networks and the Visual network. Furthermore, the degree of network engagement increased at higher working memory loads, such that increasing load from 1‐back to 2‐back increased activation of the Dorsal Attention, Set Maintenance, and right and left Frontoparietal Control networks, and increasing the load from 2‐back to 3‐back induced additional activation increases in the Set Maintenance network only. Degree of network engagement was associated with performance, such that increased activation of the left Frontoparietal Control and Dorsal Attention networks predicted faster response speed and an increased chance of attaining 100% task accuracy. Default mode network deactivation did not relate to performance. In sum, these results confirm, within individual subjects, the close correspondence between functional organization of resting and task‐evoked states that has been previously reported across studies [Smith et al.,2009]. Further, these results demonstrate that the degree of task‐rest correspondence in individuals is sensitive to cognitive load and performance variability.
Decomposition of the Functional Neural Architecture of Working Memory in Terms of Intrinsic Connectivity Networks
The present findings extend current knowledge about similar functional organization between resting and task‐evoked states in two ways. First, strong spatial matches between functional neural engagement and ICNs were observed at the individual subject level. In a seminal study by Smith et al. [2009], spatial matches were evaluated at the group level between activation patterns derived from multiple task‐evoked studies and single ICNs derived from a separate group of 36 subjects. The present results extend those findings to individual subjects, from whom both the task‐evoked activation/deactivation patterns and the ICNs were derived. Second, while Smith et al. evaluated matches between task activation patterns and single ICNs, the present findings demonstrate that the combination of multiple ICNs explained a large amount of variance in the spatial distribution of activation associated with working memory. A linear combination of ICNs explained between 11% and 59% of the spatial pattern of task‐evoked activation across subjects; the average across all subjects was 38%. By comparison, Smith et al. demonstrated visually convincing spatial correlation matches between task‐evoked activation and resting networks in which the resting network explained at least 6.3% of the task activation (r = 0.25), which was considered a minimum threshold for a good spatial match. Thus, the task‐rest spatial matches in the present study were well above that minimum threshold. Together, our results show that task‐evoked states in individual subjects reflect the simultaneous engagement and disengagement of not just one, but several of the ICNs detected at rest in the same subjects.
The pattern of activation and deactivation during N‐back performance was largely consistent with past reports, with one exception. Results showed that the bilateral Frontoparietal Control networks (including dorsolatreral prefrontal cortex, ventrolateral prefrontal cortex, and inferior parietal cortex) and the Set Maintenance network (including bilateral anterior insula and dorsal anterior cingulate cortex) were consistently activated by the N‐back task. Networks deactivated by the task included the anterior Default Mode network (including ventral and dorsal medial prefrontal cortex and posterior cingulate cortex) and the posterior Default Mode network (including posterior cingulate cortex extending into precuneus and retrosplenial cortex, ventromedial prefrontal cortex, and bilateral angular gyrus). This regional composition of activation [D'Esposito et al.,1998; Owen et al.,2005] and deactivation [McKiernan et al.,2003] is consistent with past studies using the N‐back task. An unexpected finding, however, was that deactivations included the Visual network (including most of occipital cortex). Deactivation of visual regions appears contrary to task demands of a visual N‐back task. Examination of deactivated regions revealed by the Fixation > N‐back contrast showed that cuneus, lateral middle occipital cortex, and lateral inferior occipital cortex were deactivated (Supp. Info., Fig. S2, yellow circles), but primary visual cortex was not. Thus, only extrastriate portions of the Visual network that are associated with higher‐order visual processing were deactivated. Indeed, such processing is unlikely to be evoked during perception of single letter stimuli used in the present task.
In sum, the present results extend past working memory findings by demonstrating that the observed patterns of activation/deactivation can be decomposed in terms of temporally segregated networks, ICNs, that are detected without task demands. However, while these findings seem to suggest that the task evokes entire ICNs to a greater or lesser extent, it is important to note that the present analysis cannot readily discriminate differential engagement of smaller subunits of ICNs (as demonstrated by the partial deactivation of the visual cortex). Indeed, whether or not a whole ICN is engaged is likely to depend on the demands of specific tasks. This limitation of the analysis is further discussed below (“Advantages and Limitations of Spatial Multiple Regression”).
Effect of Working Memory Load
The Set Maintenance and bilateral Frontoparietal Control ICNs that were engaged during N‐back performance were also sensitive to increased load. In addition, activation in the Dorsal Attention network was sensitive to load, although this network was not significantly active in the overall task. Post hoc analyses indicated that this network was indeed active during the 2‐ and 3‐back conditions, but not activated in the low‐load 1‐Back condition. Past studies have demonstrated load‐sensitivity of individual regions within the ICNs observed here, such as prefrontal, parietal, and anterior cingulate regions [Braver et al.,1997; Callicott et al.,1999; Veltman et al.,2003]. Dosenbach et al. [2007,2008] have argued that the Frontoparietal Control and Set Maintenance networks perform distinct cognitive control operations, with the Frontoparietal Control network adapting to short‐term variations in task requirements and the Set Maintenance network maintaining longer‐term task goals and strategies. These cognitive functions are likely to be required at all loads, but to be engaged more strongly in more difficult conditions than in easy conditions such as the 1‐Back. The Dorsal Attention network has been argued to control voluntary, top–down orienting of attention and selection of behavior [Corbetta and Shulman,2002], and specifically to be involved in rehearsal during working memory [Corbetta et al.,2002]. Unlike the 2‐ and 3‐back conditions, the optimal strategy for performing the 1‐back condition does not involve rehearsing the target stimulus, which may explain why this network was not active during the 1‐back condition.
These four ICNs were differentially responsive to increased working memory demands. The Set Maintenance network responded linearly to working memory load, such that activation was greater during the 3‐back condition than during 2‐back, which in turn was greater than during the 1‐back condition. In contrast, Frontoparietal Control and Dorsal Attention networks responded to load in a “stepwise” function, such that activation was greater during 2 and 3‐back than 1‐back, but 2‐back and 3‐back activation did not differ. In previous studies using a multiload N‐back design, both uniformly linear [Braver et al.,1997; Veltman et al.,2003] and mixed linear and stepwise [Callicott et al.,1999; Cohen et al.,1997; Jonides et al.,1997] load‐responses have been reported. Those studies reporting mixed responses found stepwise responses within lateral prefrontal cortex [Callicott et al.,1999; Cohen et al.,1997; Jonides et al.,1997], but linear responses within dorsal anterior cingulate cortex [Callicott et al.,1999]. This pattern is similar to that observed here, as lateral prefrontal cortex is part of the Frontoparietal Control network while dorsal anterior cingulate is part of the Set Maintenance network.
Neither the Anterior nor the Posterior Default Mode network was modulated by load. By contrast, McKiernan et al. [2003] demonstrated that deactivation in medial prefrontal but not in posterior Default Mode regions increased with increasing working memory load. It is possible that the working memory task used by McKiernan et al. [2003] (an auditory monitoring task) may be more sensitive in detecting load‐related deactivation effects. In addition, effects of load on performance also differed more substantially in the auditory monitoring task than in the present study. Thus, both task and performance characteristics may be important factors in determining deactivation effects.
Relationship With Performance
Of the seven ICNs comprising task‐evoked activation and deactivation, only two were associated with N‐back performance. Increased activation of the left Frontoparietal Control network predicted both faster reaction time and an increased probability of perfect performance, while increased activation of the Dorsal Attention network predicted an increased probability of perfect performance. Greater right‐lateralized [Callicott et al.,2000; Tan et al.,2006] and bilateral [Callicott et al.,1999] lateral prefrontal involvement has previously been associated with superior performance on a spatial N‐back paradigm. By contrast, the specifically left‐hemispheric involvement of the Frontoparietal Control network in our study likely reflects use of verbal processing required for N‐back performance with letter stimuli. While associations between N‐back performance and engagement of medial and superior parietal regions comprising the Dorsal Attention network have not been reported in the literature, these regions have been associated with information rehearsal during a delayed response working memory task [Corbetta et al.,2002].
By contrast, no association was found between behavioral performance and activation of the Set Maintenance or Default Mode networks. The Set Maintenance network is posited to mediate maintenance of relatively stable information such as task goals [Dosenbach et al.,2007,2008] and has been associated with detection of stimuli which are salient to current goals [Seeley et al.,2007]. Further, the anterior cingulate gyrus within this network has been associated with monitoring for responses incompatible with current goals (errors) [Carter et al.,1998]. Failure to deactivate the Default Mode network has previously been associated with increased errors [Eichele et al.,2008] and slower reaction times [Weissman et al.,2006] during cognitively demanding tasks, which has been interpreted as Default Mode‐related lapses of attention (though this has not been shown in working memory tasks). The N‐back task in the present study produced unusually high performance levels (50% of subjects made no errors over the course of the task), suggesting that lapses of attention were infrequent. Few lapses of attention and few errors may have reduced our ability to detect associations with the Default Mode and Set Maintenance ICNs. Use of binary logistic regression allowed detection of ICNs associated with perfect/imperfect performance, but this analysis is still not as sensitive as a linear regression would be, which may explain why no association was found between performance and Default Mode or Set Maintenance networks. These high performance levels may have limited our findings in other ways as well. The high accuracy may have been due at least in part to subjects' previous exposure to the task, but it may also suggest that these subjects are not representative of the average population in terms of intellectual ability and/or motivation. Further, our findings regarding linear and step‐wise effects of load should be considered in the context of this near‐ceiling performance. Specifically, it is possible that the nature of ICN engagement depends upon subjects' subjective experience of increased demands, which may be more challenging to a lower performing sample than ours.
Advantages and Limitations of Spatial Multiple Regression
We employed a novel spatial multiple regression analysis in this study to compare ICNs identified at rest to activation patterns observed during task. In this analysis, the dimensionality of the brain is first reduced from many thousands of voxels to a few ICNs using ICA, a well‐established technique for delineating functional brain networks [Beckmann and Smith,2004], and then these networks are further examined during task‐evoked states. Conceptually, using spatial multiple regression involves viewing the task‐performing brain as a small collection of ICNs rather than as many thousands of voxels. As the regions within ICNs have very strong intra‐network functional connectivity [Seeley et al.,2007], tasks that activate one part of an ICN will likely activate all parts of the ICN, such that all voxels within an ICN will be activated in approximately the same way. Thus, it is reasonable to conduct hypothesis testing in an ICN‐wise fashion rather than in a voxel‐wise fashion. An advantage of this approach is that fewer statistical tests are conducted relative to a voxel‐wise analysis, which eliminates the need to use stringent corrections for multiple comparisons that increase the likelihood of Type II errors. This advantage is well illustrated in the present study. We tested for effects of network activation on response speed and found that increased activity in the left Frontoparietal Control network significantly predicted faster RT (see Fig. 7). For comparison, we conducted a post hoc whole‐brain voxelwise analysis using RT as a linear regressor. This analysis also showed clusters well matching the left Frontoparietal Control network (in left dorsolateral prefrontal, ventrolateral prefrontal, and inferior parietal cortex, as well as small clusters in right ventrolateral prefrontal and inferior parietal cortex), but these clusters did not survive a correction for multiple comparisons (Supp. Info., Figs. S3A and B).
The approach of conducting spatial multiple regression against task is based on observations of group‐level task‐rest similarities [Fransson,2006; Smith et al.,2009], and extends that work to show similarities between task activation and multiple ICNs within individual subjects. Other recent work has similarly demonstrated task‐rest associations. Mennes et al. [2010] used a voxel‐matched regression method to demonstrate voxels in which task activation was directly predicted by degree of functional connectivity. An advantage of that technique is its ability to examine rest‐task relationships in a voxelwise fashion, allowing for direct comparisons of the strength of resting connectivity to task activation. This is not possible with our proposed technique, which compares the shape of resting ICNs to task activation. However, the voxel‐matched regression technique is also somewhat limited by its use of only two broad brain networks, the “task‐positive” and “task‐negative” networks. Thus, the specificity of the obtained connectivity values may not be high in this technique, as they represent connectivity with a broad conglomerate of ICNs.
Multiple regressions in the spatial domain have previously been employed to analyze ICA data using the dual regression technique [Filippini et al.,2009]. Dual regression, which involves spatially regressing group‐level ICA components against an individual‐level functional session and then temporally regressing the resulting time‐courses against that functional session, allows the reconstruction of individual components without running ICA on individuals. As such, it represents an alternative to the component‐matching procedure we used to identify individual‐level ICNs. While the dual regression technique has been shown to have strong test‐retest reliability [Zuo et al.,2010], it is as yet unclear how much individual variability is lost by forcing the ICNs from individual subjects to conform to group‐level ICNs. Dual regression may thus increase consistency across subjects by reducing individual variability. Importantly, the primary purpose of both the component matching technique used here and the dual regression technique (as well as the back‐reconstruction method used in the GIFT software, http://icatb.sourceforge.net/) is to identify individual versions of group components. Once this identification is performed, the spatial multiple regression against task activation data detailed in this paper may be conducted using the results of any of these techniques. Thus, the technique proposed in the present study is a flexible tool to determine the specifics of task‐rest similarities that can be employed in concert with any component identification method.
Importantly, despite the advantages offered by spatial multiple regression analysis, this technique is not suitable for testing hypotheses about sub‐regions within ICNs. For example, possible dissociations between frontal and parietal regions within the Frontoparietal Control network cannot be identified in the present study because these regions were parceled into the same ICN. The degree of network parcellation can be controlled, as a higher model order ICA will divide the functional networks into smaller subnetworks [Abou‐Elseoud et al.,2010; Kiviniemi et al.,2009] and thus allow for more specificity in the spatial multiple regression analysis. We used a model order of 20 in the present study because that model order has been shown to return visually identifiable networks [Abou‐Elseoud et al.,2010] similar to those described using seed‐based connectivity. However, the large scale of these networks does prevent examination of sub‐network effects in the present study. This limitation is illustrated by our finding of deactivation in the Visual ICN during N‐back performance, which closer examination showed was limited to extrastriate regions, a subset of the network (Supp. Info., Fig. S2). These subregional differences were not discerned by the spatial multiple regression analysis because the ICA‐generated Visual network included both primary and secondary visual cortex. However, while increasing the ICA model order would likely increase the specificity of testing, it would also increase the number of ICNs statistically tested, and thus require more stringent correction. A logical next step in the development of the spatial multiple regression technique would be to systematically investigate how the number of ICNs delineated in the ICA procedure may affect the specificity and post‐correction power of the results. Such an investigation could conceivably identify an “optimal” number of ICNs beyond which the increased spatial specificity does not make up for the loss of power, and could be of great interest for the field.
CONCLUSION
We have demonstrated that a novel analysis, spatial multiple regression, is useful in identifying network‐level functional engagement during working memory. The left and right Frontoparietal Control and Set Maintenance networks were activated during the N‐back task, while Default Mode and Visual networks were deactivated during the task. Further, activated networks, in addition to the Dorsal Attention network, were sensitive to increased working memory load. The degree of activation of the left Frontoparietal Control and Dorsal Attention networks was associated with performance. The spatial multiple regression approach compares task‐states to multiple rest‐state connectivity networks, and also allows sensitive examination of relatively subtle effects on network activation by avoiding correction for large numbers of statistical comparisons. In future work, this approach should be promising for testing hypotheses about network‐level differences between conditions or populations. As functional disruptions in a number of disorders (e.g., Schizophrenia, Attention Deficit‐Hyperactivity Disorder, Autism Spectrum disorders, and Alzheimer's disease) are hypothesized to include abnormalities at the network level, rather than at the level of the individual voxel or brain region [Broyd et al.,2009], an approach which examines functional activation at the network level may be substantially more sensitive to differences between disordered populations and healthy controls than voxelwise analyses.
Supporting information
Additional Supporting Information may be found in the online version of this article.
Supporting Information
Supporting Information
Supporting Information
Supporting Information
Acknowledgements
The authors thank Stephanie Bean and Lindsay Anderson for assistance with subject recruitment and behavioral testing, and Maxmilian Riesenhuber for valuable feedback on an earlier version of the manuscript.
Contributor Information
Evan M. Gordon, Email: emg56@georgetown.edu.
Chandan J. Vaidya, Email: cjv2@georgetown.edu.
REFERENCES
- Abou‐Elseoud A, Starck T, Remes J, Nikkinen J, Tervonen O, Kiviniemi V ( 2010): The effect of model order selection in group PICA. Hum Brain Mapp 31: 1207–1216. [DOI] [PMC free article] [PubMed] [Google Scholar]
- Beckmann CF, DeLuca M, Devlin JT, Smith SM ( 2005): Investigations into resting‐state connectivity using independent component analysis. Philos Trans R Soc Lond B Biol Sci 360: 1001–1013. [DOI] [PMC free article] [PubMed] [Google Scholar]
- Beckmann CF, Smith SM ( 2004): Probabilistic independent component analysis for functional magnetic resonance imaging. IEEE Trans Med Imaging 23: 137–152. [DOI] [PubMed] [Google Scholar]
- Biswal BB, Yetkin FZ, Haughton VM, Hyde JS ( 1995): Functional connectivity in the motor cortex of resting human brain using echo‐planar MRI. Magn Reson Med 34: 537–541. [DOI] [PubMed] [Google Scholar]
- Bluhm RL, Miller J, Lanius RA, Osuch EA, Boksman K, Neufeld R, Theberge J, Schaefer B, Williamson P ( 2007): Spontaneous low‐frequency fluctuations in the BOLD signal in schizophrenic patients: Anomalies in the default network. Schizophr Bull 33: 1004–1012. [DOI] [PMC free article] [PubMed] [Google Scholar]
- Braver TS, Cohen JD, Nystrom LE, Jonides J, Smith EE, Noll DC ( 1997): A parametric study of prefrontal cortex involvement in human working memory. Neuroimage 5: 49–62. [DOI] [PubMed] [Google Scholar]
- Brett M, Anton J, Valabregue R, Poline J ( 2003): Region of interest analysis using an SPM toolbox (abstract). Neuroimage 16:abstract 497. Available on CD‐ROM. [Google Scholar]
- Broyd SJ, Demanuele C, Debener S, Helps SK, James CJ, Sonuga‐Barke EJ ( 2009): Default‐mode brain dysfunction in mental disorders: A systematic review. Neurosci Biobehav Rev 33: 279–296. [DOI] [PubMed] [Google Scholar]
- Buckner RL, Andrews‐Hanna JR, Schacter DL ( 2008): The brain's default network: Anatomy, function, and relevance to disease. Ann NY Acad Sci 1124: 1–38. [DOI] [PubMed] [Google Scholar]
- Calhoun VD, Maciejewski PK, Pearlson GD, Kiehl KA ( 2008): Temporal lobe and “default” hemodynamic brain modes discriminate between schizophrenia and bipolar disorder. Hum Brain Mapp 29: 1265–1275. [DOI] [PMC free article] [PubMed] [Google Scholar]
- Callicott JH, Bertolino A, Mattay VS, Langheim FJ, Duyn J, Coppola R, Goldberg TE, Weinberger DR ( 2000): Physiological dysfunction of the dorsolateral prefrontal cortex in schizophrenia revisited. Cereb Cortex 10: 1078–1092. [DOI] [PubMed] [Google Scholar]
- Callicott JH, Mattay VS, Bertolino A, Finn K, Coppola R, Frank JA, Goldberg TE, Weinberger DR ( 1999): Physiological characteristics of capacity constraints in working memory as revealed by functional MRI. Cereb Cortex 9: 20–26. [DOI] [PubMed] [Google Scholar]
- Cao Q, Zang Y, Sun L, Sui M, Long X, Zou Q, Wang Y ( 2006): Abnormal neural activity in children with attention deficit hyperactivity disorder: A resting‐state functional magnetic resonance imaging study. Neuroreport 17: 1033–1036. [DOI] [PubMed] [Google Scholar]
- Carter CS, Braver TS, Barch DM, Botvinick MM, Noll D, Cohen JD ( 1998): Anterior cingulate cortex, error detection, and the online monitoring of performance. Science 280: 747–749. [DOI] [PubMed] [Google Scholar]
- Castellanos FX, Margulies DS, Kelly A, Uddin LQ, Ghaffari M, Kirsch A, Shaw D, Shehzad Z, Di Martino A, Biswal BB, Sonuga‐Barke EJ, Rotrosen J, Adler LA, Milham MP ( 2008): Cingulate‐precuneus interactions: A new locus of dysfunction in adult attention‐deficit/hyperactivity disorder. Biol Psychiatry 63: 332–337. [DOI] [PMC free article] [PubMed] [Google Scholar]
- Chen S, Ross TJ, Zhan W, Myers CS, Chuang K, Heishman SJ, Stein EA, Yang Y ( 2008): Group independent component analysis reveals consistent resting‐state networks across multiple sessions. Brain Res 1239: 141–151. [DOI] [PMC free article] [PubMed] [Google Scholar]
- Cohen JD, Perlstein WM, Braver TS, Nystrom LE, Noll DC, Jonides J, Smith EE ( 1997): Temporal dynamics of brain activation during a working memory task. Nature 386: 604–608. [DOI] [PubMed] [Google Scholar]
- Corbetta M, Kincade JM, Shulman GL ( 2002): Neural systems for visual orienting and their relationships to spatial working memory. J Cogn Neurosci 14: 508–523. [DOI] [PubMed] [Google Scholar]
- Corbetta M, Shulman GL ( 2002): Control of goal‐directed and stimulus‐driven attention in the brain. Nat Rev Neurosci 3: 201–215. [DOI] [PubMed] [Google Scholar]
- Damoiseaux JS, Rombouts SA, Barkhof F, Scheltens P, Stam CJ, Smith SM, Beckmann CF ( 2006): Consistent resting‐state networks across healthy subjects. Proc Natl Acad Sci USA 103: 13848–13853. [DOI] [PMC free article] [PubMed] [Google Scholar]
- De Luca M, Beckmann CF, De Stefano N, Matthews P, Smith S ( 2006): fMRI resting state networks define distinct modes of long‐distance interactions in the human brain. Neuroimage 29: 1359–1367. [DOI] [PubMed] [Google Scholar]
- D'Esposito M, Aguirre GK, Zarahn E, Ballard D, Shin RK, Lease J ( 1998): Functional MRI studies of spatial and nonspatial working memory. Brain Res Cogn Brain Res 7: 1–13. [DOI] [PubMed] [Google Scholar]
- Dosenbach NUF, Fair DA, Miezin FM, Cohen AL, Wenger KK, Dosenbach RAT, Fox MD, Snyder AZ, Vincent JL, Raichle ME, Schlaggar BL, Petersen SE ( 2007): Distinct brain networks for adaptive and stable task control in humans. Proc Natl Acad Sci USA 104: 11073–11078. [DOI] [PMC free article] [PubMed] [Google Scholar]
- Dosenbach NU, Fair DA, Cohen AL, Schlaggar BL, Petersen SE ( 2008): A dual‐networks architecture of top‐down control. Trends Cogn Sci 12: 99–9105. [DOI] [PMC free article] [PubMed] [Google Scholar]
- Eichele T, Debener S, Calhoun VD, Specht K, Engel AK, Hugdahl K, von Cramon DY, Ullsperger M ( 2008): Prediction of human errors by maladaptive changes in event‐related brain networks. Proc Natl Acad Sci USA 105: 6173–6178. [DOI] [PMC free article] [PubMed] [Google Scholar]
- Fassbender C, Zhang H, Buzy WM, Cortes CR, Mizuiri D, Beckett L, Schweitzer JB ( 2009): A lack of default network suppression is linked to increased distractibility in ADHD. Brain Res 1273: 114–128. [DOI] [PMC free article] [PubMed] [Google Scholar]
- Filippini N, Macintosh BJ, Hough MG, Goodwin GM, Frisoni GB, Smith SM, Matthews PM, Beckmann CF, Mackay CE ( 2009): Distinct patterns of brain activity in young carriers of the APOE‐{varepsilon}4 allele. Proc Natl Acad Sci USA 106: 7209–7214. [DOI] [PMC free article] [PubMed] [Google Scholar]
- Fox MD, Corbetta M, Snyder AZ, Vincent JL, Raichle ME ( 2006): Spontaneous neuronal activity distinguishes human dorsal and ventral attention systems. Proc Natl Acad Sci USA 103: 10046–10051. [DOI] [PMC free article] [PubMed] [Google Scholar]
- Fox MD, Raichle ME ( 2007): Spontaneous fluctuations in brain activity observed with functional magnetic resonance imaging. Nat Rev Neurosci 8: 700–711. [DOI] [PubMed] [Google Scholar]
- Fransson P ( 2006): How default is the default mode of brain function? Further evidence from intrinsic BOLD signal fluctuations. Neuropsychologia 44: 2836–2845. [DOI] [PubMed] [Google Scholar]
- Greicius MD, Krasnow B, Reiss AL, Menon V ( 2003): Functional connectivity in the resting brain: A network analysis of the default mode hypothesis. Proc Natl Acad Sci USA 100: 253–258. [DOI] [PMC free article] [PubMed] [Google Scholar]
- Greicius MD, Srivastava G, Reiss AL, Menon V ( 2004): Default‐mode network activity distinguishes Alzheimer's disease from healthy aging: Evidence from functional MRI. Proc Natl Acad Sci USA 101: 4637–4642. [DOI] [PMC free article] [PubMed] [Google Scholar]
- Habas C, Kamdar N, Nguyen D, Prater K, Beckmann CF, Menon V, Greicius MD ( 2009): Distinct cerebellar contributions to intrinsic connectivity networks. J Neurosci 29: 8586–8594. [DOI] [PMC free article] [PubMed] [Google Scholar]
- Hampson M, Driesen NR, Skudlarski P, Gore JC, Constable RT ( 2006): Brain connectivity related to working memory performance. J Neurosci 26: 13338–13343. [DOI] [PMC free article] [PubMed] [Google Scholar]
- Hampson M, Peterson BS, Skudlarski P, Gatenby JC, Gore JC ( 2002): Detection of functional connectivity using temporal correlations in MR images. Hum Brain Mapp 15: 247–262. [DOI] [PMC free article] [PubMed] [Google Scholar]
- Jonides J, Schumacher EH, Smith EE, Lauber EJ, Awh E, Minoshima S, Koeppe RA ( 1997): Verbal working memory load affects regional brain activation as measured by PET. J Cognit Neurosci 9: 462–475. [DOI] [PubMed] [Google Scholar]
- Kennedy DP, Redcay E, Courchesne E ( 2006): Failing to deactivate: Resting functional abnormalities in autism. Proc Natl Acad Sci USA 103: 8275–8280. [DOI] [PMC free article] [PubMed] [Google Scholar]
- Kennedy DP, Courchesne E ( 2008): The intrinsic functional organization of the brain is altered in autism. Neuroimage 39: 1877–1885. [DOI] [PubMed] [Google Scholar]
- Kiviniemi V, Starck T, Remes J, Long X, Nikkinen J, Haapea M, Veijola J, Moilanen I, Isohanni M, Zang Y, Tervonen O ( 2009): Functional segmentation of the brain cortex using high model order group PICA. Hum Brain Mapp 30: 3865–3886. [DOI] [PMC free article] [PubMed] [Google Scholar]
- Lowe MJ, Mock BJ, Sorenson JA ( 1998): Functional connectivity in single and multislice echoplanar imaging using resting‐state fluctuations. Neuroimage 7: 119–132. [DOI] [PubMed] [Google Scholar]
- Manoach DS, Schlaug G, Siewert B, Darby DG, Bly BM, Benfield A, Edelman RR, Warach S ( 1997): Prefrontal cortex fMRI signal changes are correlated with working memory load. Neuroreport 8: 545–549. [DOI] [PubMed] [Google Scholar]
- McKiernan KA, Kaufman JN, Kucera‐Thompson J, Binder JR ( 2003): A parametric manipulation of factors affecting task‐induced deactivation in functional neuroimaging. J Cogn Neurosci 15: 394–408. [DOI] [PubMed] [Google Scholar]
- Meindl T, Stefan Teipel, Rachid Elmouden, Sophia Mueller, Walter Koch, Olaf Dietrich, Ute Coates, Maximilian Reiser, Christian Glaser ( 2009): Test‐retest reproducibility of the default‐mode network in healthy individuals. Hum Brain Mapp 31: 237–246. [DOI] [PMC free article] [PubMed] [Google Scholar]
- Mennes M, Kelly C, Zuo X, Di Martino A, Biswal BB, Castellanos FX, Milham MP ( 2010): Inter‐individual differences in resting‐state functional connectivity predict task‐induced BOLD activity. Neuroimage 50: 1690–1701. [DOI] [PMC free article] [PubMed] [Google Scholar]
- Owen AM, McMillan KM, Laird AR, Bullmore E ( 2005): N‐back working memory paradigm: A meta‐analysis of normative functional neuroimaging studies. Hum Brain Mapp 25: 46–59. [DOI] [PMC free article] [PubMed] [Google Scholar]
- Perlstein WM, Dixit NK, Carter CS, Noll DC, Cohen JD ( 2003): Prefrontal cortex dysfunction mediates deficits in working memory and prepotent responding in schizophrenia. Biol Psychiatry 53: 25–38. [DOI] [PubMed] [Google Scholar]
- Raichle ME, MacLeod AM, Snyder AZ, Powers WJ, Gusnard DA, Shulman GL ( 2001): A default mode of brain function. Proc Natl Acad Sci USA 98: 676–682. [DOI] [PMC free article] [PubMed] [Google Scholar]
- Rombouts SA, Barkhof F, Goekoop R, Stam CJ, Scheltens P ( 2005): Altered resting state networks in mild cognitive impairment and mild Alzheimer's disease: An fMRI study. Hum Brain Mapp 26: 231–239. [DOI] [PMC free article] [PubMed] [Google Scholar]
- Seeley WW, Menon V, Schatzberg AF, Keller J, Glover GH, Kenna H, Reiss AL, Greicius MD ( 2007): Dissociable intrinsic connectivity networks for salience processing and executive control. J Neurosci 27: 2349–2356. [DOI] [PMC free article] [PubMed] [Google Scholar]
- Shehzad Z, Kelly AMC, Reiss PT, Gee DG, Gotimer K, Uddin LQ, Lee SH, Margulies DS, Roy AK, Biswal BB, Petkova E, Castellanos FX, Milham MP ( 2009): The resting brain: Unconstrained yet reliable. Cereb Cortex 19: 2209–2229. [DOI] [PMC free article] [PubMed] [Google Scholar]
- Smith SM, Fox PT, Miller KL, Glahn DC, Fox PM, Mackay CE, Filippini N, Watkins KE, Toro R, Laird AR, Beckmann CF ( 2009): Correspondence of the brain's functional architecture during activation and rest. Proc Natl Acad Sci USA 106: 13040–13045. [DOI] [PMC free article] [PubMed] [Google Scholar]
- Spreng RN, Mar RA, Kim ASN ( 2009): The common neural basis of autobiographical memory, prospection, navigation, theory of mind, and the default mode: A quantitative meta‐analysis. J Cogn Neurosci 21: 489–510. [DOI] [PubMed] [Google Scholar]
- Stevens MC, Pearlson GD, Calhoun VD ( 2009): Changes in the interaction of resting‐state neural networks from adolescence to adulthood. Hum Brain Mapp 30: 2356–2366. [DOI] [PMC free article] [PubMed] [Google Scholar]
- Tan H, Sust S, Buckholtz JW, Mattay VS, Meyer‐Lindenberg A, Egan MF, Weinberger DR, Callicott JH ( 2006): Dysfunctional prefrontal regional specialization and compensation in schizophrenia. Am J Psychiatry 163: 1969–1977. [DOI] [PubMed] [Google Scholar]
- Uddin LQ, Kelly AM, Biswal BB, Xavier Castellanos F, Milham MP ( 2009): Functional connectivity of default mode network components: Correlation, anticorrelation, and causality. Hum Brain Mapp 30: 625–637. [DOI] [PMC free article] [PubMed] [Google Scholar]
- Uddin LQ, Kelly AMC, Biswal BB, Margulies DS, Shehzad Z, Shaw D, Ghaffari M, Rotrosen J, Adler LA, Castellanos FX, Milham MP ( 2008): Network homogeneity reveals decreased integrity of default‐mode network in ADHD. J Neurosci Methods 169: 249–254. [DOI] [PubMed] [Google Scholar]
- Upadhyay J, Silver A, Knaus TA, Lindgren KA, Ducros M, Kim DS, Tager‐Flusberg H ( 2008): Effective and structural connectivity in the human auditory cortex. J Neurosci 28: 3341–3349. [DOI] [PMC free article] [PubMed] [Google Scholar]
- Van Dijk KRA, Hedden T, Venkataraman A, Evans KC, Lazar SW, Buckner RL ( 2010): Intrinsic functional connectivity as a tool for human connectomics: Theory, properties, and optimization J Neurophysiol 103: 297–321. [DOI] [PMC free article] [PubMed] [Google Scholar]
- Veltman DJ, Rombouts SARB, Dolan RJ ( 2003): Maintenance versus manipulation in verbal working memory revisited: An fMRI study. Neuroimage 18: 247–256. [DOI] [PubMed] [Google Scholar]
- Weissman DH, Roberts KC, Visscher KM, Woldorff MG ( 2006): The neural bases of momentary lapses in attention. Nat Neurosci 9: 971–978. [DOI] [PubMed] [Google Scholar]
- Wermke M, Sorg C, Wohlschläger A, Drzezga A ( 2008): A new integrative model of cerebral activation, deactivation and default mode function in Alzheimer's disease. Eur J Nucl Med Mol Imaging 35: 12–24. [DOI] [PubMed] [Google Scholar]
- Whitfield‐Gabrieli S, Thermenos HW, Milanovic S, Tsuang MT, Faraone SV, McCarley RW, Shenton ME, Green AI, Nieto‐Castanon A, LaViolette P, Wojcik J, Gabrieli JDE, Seidman LJ ( 2009): Hyperactivity and hyperconnectivity of the default network in schizophrenia and in first‐degree relatives of persons with schizophrenia. Proc Natl Acad Sci USA 106: 1279–1284. [DOI] [PMC free article] [PubMed] [Google Scholar]
- Zuo X, Kelly C, Adelstein JS, Klein DF, Castellanos FX, Milham MP ( 2010): Reliable intrinsic connectivity networks: Test‐retest evaluation using ICA and dual regression approach. Neuroimage 49: 2163–2177. [DOI] [PMC free article] [PubMed] [Google Scholar]
Associated Data
This section collects any data citations, data availability statements, or supplementary materials included in this article.
Supplementary Materials
Additional Supporting Information may be found in the online version of this article.
Supporting Information
Supporting Information
Supporting Information
Supporting Information