

Abstract
Introduction
Resistance exercise (RE) stimulates a muscle protein anabolic response partially through enhanced satellite cell (SC) activity, however, age and gender-related changes in SC content over a 24h time course are not known.
Methods
Ten young (27±2y) men and women and eleven older (70±2y) men and women performed an acute bout of RE. Myofiber and SC characteristics were determined from muscle biopsies of the vastus lateralis using immunohistochemistry. Immunoblotting was used to determine phosphorylation of cyclin dependent kinase-2 and protein expression of p27Kip1 and cyclin D1.
Results
Pax7+ SC were significantly increased in young men 24h following RE. Percent SC were significantly increased in older women at 6 and 24h following RE. Aging decreased myonuclear domain and increased protein expression of p27Kip1.
Conclusions
An acute bout of RE increases SC content in young men at 24h and older women at 6 and 24h.
Keywords: aging, cell cycle, muscle, myonuclear domain, gender
Introduction
Satellite cells (SC) are mononucleated cells that serve as a source of nuclei for muscle fibers1. They are easily distinguishable from muscle nuclei, as they lie in indentations between the sarcolemma and basal lamina.2 Normally quiescent, SC are activated by a number of stimuli to proliferate and fuse with the neighboring muscle fiber to donate their nuclei (due to the inability of myonuclei to proliferate), fuse together to generate new myofibers, or return to quiescence to maintain the SC pool.1 Thus muscle SC are needed not only for growth but also for muscle repair and regeneration. SC were first identified 50 years ago using electron microscopy.3 However, with the availability of commercial antibodies, we are now able to study SC using epifluorescent microscopy. Specifically, expression of Pax7, a paired-box transcription factor, is limited to skeletal muscle SC4 and therefore is a commonly used SC marker in humans.5-15 Pax7 plays an important role in muscle development, as it may be required for specification and progression of cells towards a myogenic lineage.4
Understanding the functional significance of SC in humans is of particular interest but is limited to descriptive experiments. However, in animal models, using synergistic ablation and stretch models, SC re-enter the cell cycle and migrate to the injured site within 24 hours16-18, suggesting that, in response to injury, SC activity increases to aid in repair and/or growth of muscle fibers. Furthermore, SC activity of rodent EDL muscle is attenuated when it is subjected to irradiation prior to ablation of the synergist tibilalis anterior. This prevents hypertrophy of the EDL muscle and demonstrates the need of SC for growth.19 In human SC cultures, irradiation was specifically shown to significantly reduce S phase and G2/M phase progression and promote apoptosis within 30 h.20 However, in a recent study, conditional ablation of SC during loading of the plantaris muscle in adult mice did not prevent hypertrophy of the muscle, suggesting that SC may not be needed for hypertrophy.21 Similarly, studies using mutant Akt and myostatin mouse models have shown SC are not needed for muscle hypertrophy.22,23 In human studies, exercise training is used as a research model for muscle growth, in addition to overall preservation of muscle mass. The involvement of SC in exercise-induced muscle hypertrophy is, however, unclear as some resistance exercise training studies demonstrate a concomitant increase in myonuclear content with hypertrophy,24,25 whereas other studies demonstrate hypertrophy with no change in myonuclear content with training.26,27 Thus future research is warranted to determine the precise mechanism of SC function in human muscle growth and repair.
Aging has diminishing effects on human SC activity. Specifically, at birth, SC represent approximately 15% of total muscle nuclei and decline to 0.6 - 3.4% in adults.28-30 Furthermore, SC content is reduced in the biceps and anterior masseter muscles of older individuals.31 Verdijk et al.6 demonstrated that the reduction in SC content in older individuals is driven by loss of type II fiber SC. Research suggests that the decrements in SC of aging human muscle could be attributed to shortened telomeres and reduced proliferation.32,33 Consequently, a diminished SC response may contribute to the consistently demonstrated reduced anabolic response of older adults34,35, and this may contribute potentially to the onset of sarcopenia. Additionally, data on gender-related differences are limiting. Therefore, the main purpose of this study was to quantify changes in Pax7+ SC associated with aging and gender during a 24 h time course following an acute bout of unaccustomed resistance exercise. We also determined changes in myofiber characteristics and cell-cycle regulators during the same time course.
Materials and Methods
Study Subjects
Ten healthy young (5 men, 5 women; 27 ± 2 years) and eleven healthy older (6 men, 5 women; 70 ± 2 years) subjects participated in the study and were a subset of a larger study.35 Subjects were considered physically active, but they were not participating in any structured exercise training program at the time of enrollment. Subject screening included evaluation of medical history, physical exam, and blood tests. For older subjects, additional screening was performed, which included an electrocardiogram and treadmill stress test. Maximum strength was tested for each subject on two separate occasions by performing a one-repetition maximum (1RM) on a leg extension machine (Cybex-VR2, Medway, MA). The highest 1RM was recorded and used as the subject's final 1RM. Written informed consent was obtained by all subjects before the initiation of the study, which was approved by the Institutional Review Board of the University of Texas Medical Branch (which is in compliance with the Declaration of Helsinki).
Study Design
Qualified subjects were admitted to the Institute of Translational Sciences-Clinical Research Center of the University of Texas Medical Branch the day prior to the study. Subjects refrained from exercising 48 h prior to study participation. Experiments for each subject were carried out at the same approximate time of day to minimize subject-to-subject variation due to circadian rhythms and fasting. The morning of the study, a muscle biopsy was collected for baseline measurements. After the basal biopsy, subjects were moved to the exercise laboratory where each subject performed 8 sets of 10 repetitions of bilateral leg extension exercise (Cybex International Inc., Medway, MA) at 70% of 1RM with a 3 min rest period between sets. After completion of exercise (∼40 min), subjects returned to their hospital bed for the remainder of the study. Additional muscle biopsies were collected at 6 and 24 h following completion of the resistance exercise.35
Muscle Biopsies
Baseline and 6 h post-exercise muscle biopsies were collected from different incisions (7 cm apart) on the same leg whereas the 24 h post-exercise biopsy was collected on the opposite leg. Biopsies were collected under local anesthesia (1% lidocaine) from the vastus lateralis using a 5 mm Bergström biopsy needle with suction. Muscle samples were carefully freed of any visible fat, connective tissue, or blood clots. Approximately 20 mg of sample was embedded in Tissue Tek optimal cutting temperature (OCT; Thermo Fisher Scientific, Rockford, IL) on a cork and frozen in liquid nitrogen cooled isopentane. Muscle histology samples were stored at -80°C for subsequent immunohistochemical analysis. Additional muscle tissue was snap frozen in liquid nitrogen and stored at -80°C for subsequent immunoblot analysis.
Immunohistochemical Analysis
Muscle fiber distribution was determined on 10 μm thick cross sections cut at -20°C using a cryostat (Jencons, Bridgeville, PA). Specifically, sections were fixed using 4% paraformaldehyde (Thermo Fisher Scientific) for 10 min at room temperature followed by three 5 min rinses with phosphate buffer saline (PBS). Sections were permeabilized with 0.5% triton-X 100 for 30 min at room temperature. Slides were incubated for 1 h with primary antibodies, mouse anti-myosin heavy chain type I (1:50, Sigma-Aldrich, St. Louis, MO) and rabbit anti-laminin (1:400, Sigma-Aldrich). Slides were rinsed three times for 5 min each with PBS followed by 30 min incubation with secondary antibodies, Alexa Fluor 488 goat anti-rabbit (1:3000, Invitrogen, Carlsbad, CA) and Alexa Fluor 555 goat anti-mouse (1:3000, Invitrogen), at room temperature in the dark. Slides were rinsed twice for 5 min each with PBS and then rinsed twice for 5 min each with deionized water. Staining procedures resulted in laminin staining green (muscle cell border), myosin heavy chain type I staining red, and myosin heavy chain type II remaining black (negative for myosin heavy chain type I, Fig. 1). Images for fiber typing were captured at 100× magnification using a fluorescence microscope (Axio Imager.M1m, Carl Zeiss, Toronto, Ontario, Canada) and AxioCam MRm camera (Carl Zeiss, Toronto, Ontario, Canada). Image processing and analysis was done using AxioVision 4.8.2 software. For each image, the number of muscle fibers for type I and II were counted, and cross sectional area (CSA) for type I and II fibers were measured. One hundred to two hundred muscle fibers were analyzed for fiber type distribution and CSA in biopsy samples collected at baseline.
Figure 1.

Immunohistochemical detection on a muscle cross section of a healthy younger male demonstrates sarcolemma by anti-laminin in green, myosin heavy chain type I positive muscle fibers in red, and myosin heavy chain type II muscle fibers are black (negative for myosin heavy chain type I)
For detection of SC in muscle cross sections, SC were visualized on 10 μm thick cross sections cut at -20°C using a cryostat. Specifically, sections were fixed using 4% paraformaldehyde for 5 min at room temperature followed by three 5 min rinses with PBS. Sections were blocked with 10% goat serum plus 0.5% triton-X 100 for 45 min. Sections were incubated overnight at 4°C with primary antibodies, mouse anti-Pax7 (1:2, Developmental Studies Hybridoma Bank, Iowa City, IA) and rabbit anti-laminin (1:400, Sigma-Aldrich). Sections were rinsed three times for 5 min each with PBS followed by 45 min incubation with secondary antibodies, Alexa Fluor 488 goat anti-rabbit (1:3000, Invitrogen) and Alexa Fluor 647 goat anti-mouse (1:3000, Invitrogen), at room temperature in the dark. Sections were rinsed twice for 5 min each with PBS and rinsed twice for 5 min each with deionized water. Total nuclei were visualized using Hoechst 33342 (1:10000, Invitrogen) nucleic acid stain. The staining protocol resulted in nuclei staining blue and Pax7+ cells identified as any nuclei localized to the membrane (laminin stained green) of a muscle fiber and stained red (Fig. 2). Images were captured at 200× magnification and analyzed using AxioVision 4.8.2 software. Pax7+ cells/myofiber, % SC, myonuclei per fiber, and myonuclear domain (fiber area per myonuclei) were determined from 100 - 200 cross sectional muscle fibers at baseline and at 6 and 24 h post-exercise, as Mackey et al.36 recommend that counting from a minimum of 125 muscle fibers is needed to obtain reliable data for satellite cell content.
Figure 2.

Immunohistochemical detection of skeletal muscle SC on a single cross section of a healthy older male at baseline. Nuclei were stained blue, laminin were stained green, and Pax7+ cells (denoting skeletal muscle SC) were identified as any nuclei localized to the sarcolemma and stained red.
Immunoblotting
Western blot analysis was performed as previously described.35 Immunoblot data were normalized to an internal standard that was loaded on every gel to allow comparisons across membranes. Antibodies used were the following: phospho cyclin dependent kinase 2Thr160 (CDK2; 1:500, Cell Signaling, Beverly, MA), CDK2 (1:1000, Cell Signaling), Cyclin D1 (1:1000, Cell Signaling), and p27Kip1 (1:1000, Cell Signaling).
Statistical Analysis
Data were analyzed using the MIXED procedure of SAS System for Windows Release 9.2 (SAS Inst. Inc., Cary, NC). Data for fiber type distribution and CSA were analyzed as a completely randomized design. The model contained the effects of gender, age, time, fiber type, and all possible interactions. Subject was modeled as a random blocking factor. Data for Pax7+ cells per fiber, % SC, myonuclei per fiber, myonuclear domain, and western analysis for phospho-CDK2Thr160, total CDK2, Cyclin D1, and p27Kip1 were analyzed as a completely randomized design. The model contained the effects of gender, age, time, and all possible interactions. Subject was included as a random blocking factor. Treatment means were computed using the LSMEANS option, and pair-wise t-tests were used to separate means using Bonferroni-adjusted criteria to assess significance at P < 0.05.
Results
Muscle Fiber Characteristics
Data for muscle fiber cross-sectional area (CSA) and muscle fiber type distributions (type I and II) are shown in Table 1. Muscle fiber type I and II CSA for men were 35% greater than women CSA (effect of gender, P = 0.001). Type II fiber CSA in young men was larger than in young women (P = 0.0001), older men (P = 0.012), and older women (P = 0.0004), and it was larger than type I fibers in all groups (P ≤ 0.041; gender × age × fiber type interaction, P = 0.059). For muscle fiber type distribution, the proportion of type II fibers in young subjects were greater than in older subjects (P = 0.046) and greater than type I fibers in the young (P < 0.0001) and older subjects (P = 0.0015; age × fiber type interaction, P = 0.006). The percentage of type I fibers in older subjects were similar to the percentage of II fibers in older subjects (P = 0.186), but both were greater than type I fibers in young subjects (P ≤ 0.046). The proportion of type II fibers in men was greater than type I fibers in men (P < 0.0001), whereas the distribution between type I and II fibers in women were similar (P = 0.116; gender × fiber type interaction, P = 0.019). For muscle fiber type distribution, a gender × age × fiber type interaction was not detected (P = 0.14). However, due to the magnitude of young men fiber type proportions, a post-hoc analysis was conducted, and means were separated for pair-wise comparisons (Table 1); since the p-values were close to significance (thus increasing the probability of Type II error), no interactions were removed from the final model before testing these comparisons. The proportion of type II fibers in young men was greater than in young women (P = 0.055), older men (P = 0.027), and older women (P = 0.011), and it was greater than the proportion of type I fibers in all groups (P ≤ 0.003).
Table 1.
Muscle fiber cross-sectional area (CSA) and fiber type distribution at baseline.
| Young Men | Young Women | Older Men | Older Women | |
|---|---|---|---|---|
| Muscle fiber CSA, μm2 * | ||||
| Type I | 3,964 ± 462a,b | 3,652 ± 499a,b | 4,725 ± 462b | 3,741 ± 499a,b |
| Type II | 6,098 ± 462c | 3,265 ± 499a | 4,389 ± 462a,b | 3,513 ± 499a,b |
| Fiber distribution, % † □ | ||||
| Type I | 33.9 ± 3.8x | 44.8 ± 4.1x,y | 46.1 ± 3.8y | 48.7 ± 4.1y |
| Type II | 66.1 ± 3.8z | 55.2 ± 4.1y | 53.9 ± 3.8y | 51.3 ± 4.1y |
Values are means ± SEM.
Means in rows for type I and type II CSA not bearing a common superscript differ, P< 0.05
Means in rows for type I and type II % not bearing a common superscript differ, P< 0.05
Main effect of gender, P< 0.05
Gender × fiber type interaction, P< 0.05
Age × fiber type interaction, P< 0.05
Data for myonuclei per muscle fiber and myonuclear domain are shown in Table 2. For myonuclei per fiber, no significant interactions were detected. Men displayed 12% more myonuclei per fiber than women (effect of gender, P = 0.019). For myonuclear domain, no significant interactions were detected. Myonuclear domain for men was 19% larger than women (effect of gender, P = 0.005) and was 15% larger for young compared to older subjects (effect of age, P = 0.023).
Table 2.
Myofiber characteristics before and after acute resistance exercise.
| Young Men | Young Women | Older Men | Older Women | |
|---|---|---|---|---|
| Myonuclei per fiber* | ||||
| Baseline | 1.51 ± 0.10 | 1.33 ± 0.10 | 1.28 ± 0.09 | 1.35 ± 0.11 |
| 6 h post | 1.51 ± 0.11 | 1.30 ± 0.10 | 1.47 ± 0.10 | 1.22 ± 0.10 |
| 24 h post | 1.37 ± 0.10 | 1.23 ± 0.11 | 1.55 ± 0.10 | 1.35 ± 0.13 |
| Myonuclear Domain*,† | Fiber area permyonucleus, μm2 | |||
| Baseline | 3,657 ± 213 | 2,666 ± 213 | 2,652 ± 195 | 2,382 ± 228 |
| 6 h post | 3,598 ± 231 | 2,841 ± 213 | 3,022 ± 208 | 2,607 ± 210 |
| 24 h post | 3,136 ± 213 | 2,951 ± 231 | 3,104 ± 208 | 2,625 ± 258 |
| % Satellite cells*,§,¶ | ||||
| Baseline | 4.20 ± 0.84a,b | 3.76 ± 0.84a,b | 4.49 ± 0.76a,b | 2.17 ± 0.92a |
| 6 h post | 3.64 ± 0.94a,b | 3.73 ± 0.84a,b | 4.81 ± 0.84b | 4.68 ± 0.83b |
| 24 h post | 10.4 ± 0.84c | 6.16 ± 0.94b | 5.46 ± 0.84b | 5.34 ± 1.1b |
Values are means ± SEM.
Main effect of gender, P < 0.05
Main effect of age, P < 0.05
Main effect of time, P < 0.05
Age × time interaction, P < 0.05
Means in rows for % satellite cells not bearing a common superscript differ, P < 0.05 % Satellite cell = [no. of satellite cells/(no. of satellite cells + no. of myonuclei)]
Satellite Cell Content
Data for Pax7+ SC are shown in Figure 3. Men displayed greater numbers of Pax7+ SC than women (0.085 ± 0.007 vs. 0.057 ± 0.007 SC/fiber; effect of gender, P = 0.007). The number of Pax7+ SC averaged across all groups increased from 6 to 24 h (0.06 ± 0.007 vs. 0.099 ± 0.008 SC/fiber, P = 0.0002) post-exercise and from baseline to 24 h (0.053 ± 0.007 vs. 0.099 ± 0.008 SC/fiber, P < 0.0001) post-exercise (effect of time, P < 0.0001). No significant gender × age × fiber type interaction was detected (P = 0.082). However, due to the magnitude of young men, a post-hoc analysis was conducted, and means were separated for pair-wise comparisons (Figure 3); since the p-values were close to significance (thus increasing the probability of Type II error), no interactions were removed from the final model before testing these comparisons. Young men displayed significantly greater Pax7+ cells at 24 h post-exercise than young women (P = 0.0003), older men (P = 0.0015), older women (P = 0.0052) at 24 h, and all groups at baseline and at 6 h post-exercise (P ≤ 0.0001). Data for % SC are shown in Table 2. Men displayed a greater % SC than women (5.5 ± 0.36 vs. 4.3 ± 0.39 %; effect of gender, P = 0.029). The % SC increased across all groups from 6 to 24 h (4.2 ± 0.43 vs. 6.8 ± 0.46 %, P = 0.0002) post-exercise and from baseline to 24 h (3.7 ± 0.42 vs. 6.8 ± 0.46 %, P < 0.0001) post-exercise (effect of time, P < 0.0001). Additionally, no significant differences in % SC were noted between young and older individuals at baseline (3.99 ± 0.58 vs 3.33 ± 0.59 %, P = 0.44) and at 6 h post-exercise (3.68 ± 0.62 vs. 4.74 ± 0.58 %, P = 0.22). However, young subjects had greater % SC at 24 h post-exercise compared to older subjects at 24 h (8.19 ± 0.62 vs. 5.39 ± 0.67 %, P = 0.0051) and young and older subjects at baseline (8.19 ± 0.62 vs. 3.99 ± 0.58 and 3.33 ± 0.59 %, P < 0.0001) and at 6 h post-exercise (8.19 ± 0.62 vs. 3.68 ± 0.62 and 4.74 ± 0.58 %, P ≤ 0.0004; age × time interaction, P = 0.013). Young men displayed a significantly greater % SC at 24 h post-exercise than young women (P < 0.0001), older men (P = 0.0002), and older women (P = 0.001) at 24 h and all groups at baseline (P < 0.0001) and 6 h post-exercise (P < 0.0001). Within older women, a significant increase in % SC from baseline to 6 h (P = 0.047) and from baseline to 24 h (P = 0.032) was detected (age × gender × time interaction, P = 0.044).
Figure 3.
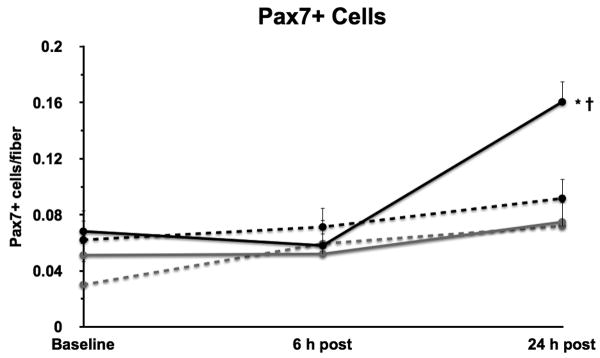
The number of Pax7+ cells at baseline and at 6 and 24 h post resistance exercise in young (black lines) and older (grey lines) men (solid lines) and women (dashed lines). *Different from baseline, P ≤ 0.006. †Different from all groups at 24 h, P ≤ 0.006.
Cell Cycle Regulators
Data for the phosphorylation status of cyclin dependent kinase 2 (CDK2), Cyclin D1, and p27Kip1 protein expression are shown in Table 3. No significant interactions were detected. Cyclin-dependent kinase 2 phosphorylation was reduced from baseline to 6 h (P = 0.002) and from 6 to 24 h (P = 0.014) post-exercise (effect of time, P < 0.0001). Cyclin D1 decreased from baseline to 6 h (P = 0.002) and from 6 to 24 h (P = 0.001) post-exercise (effect of time, P < 0.0001). Young subjects demonstrated greater cyclin D1 protein expression at baseline compared to 6 (P = 0.002) and 24 h post-exercise (P < 0.0001). Older subjects had greater cyclin D1 at baseline compared to 24 h post-exercise (P = 0.003). However, younger subjects had greater cyclin D1 compared to older subjects at baseline (P = 0.03; age × time interaction, P = 0.054). Protein expression of p27Kip1 was reduced from baseline to 6 h (P < 0.0001) and from baseline to 24 h (P = 0.0006) post-exercise (effect of time, P < 0.0001). Older subjects tended to have higher protein levels of p27Kip1 than young subjects (effect of age, P = 0.0699).
Table 3.
CDK2 phosphorylation and p27Kip1 protein expression before and after acute resistance exercise.
| Young Men | Young Women | Older Men | Older Women | |
|---|---|---|---|---|
| CDK2 phosphorylation* | Phospho/Total | |||
| Baseline | 1.49 ± 0.27 | 1.32 ± 0.27 | 1.05 ± 0.27 | 1.45 ± 0.27 |
| 6 h post | 0.73 ± 0.27 | 0.70 ± 0.27 | 1.03 ± 0.30 | 0.65 ± 0.27 |
| 24 h post | 0.40 ± 0.27 | 0.33 ± 0.27 | 0.26 ± 0.27 | 0.39 ± 0.27 |
| p27Kip1 *,† | Arbitrary units | |||
| Baseline | 5.15 ± 0.69 | 5.20 ± 0.69 | 7.13 ± 0.69 | 5.82 ± 0.69 |
| 6 h post | 2.98 ± 0.69 | 2.52 ± 0.69 | 3.73 ± 0.78 | 3.48 ± 0.69 |
| 24 h post | 3.66 ± 0.69 | 4.08 ± 0.69 | 3.66 ± 0.69 | 4.35 ± 0.69 |
| Cyclin D1*,□ | Arbitrary units | |||
| Baseline | 46.8 ± 5.8 | 43.1 ± 5.8 | 26.7 ± 5.8 | 37.0 ± 5.8 |
| 6 h post | 28.7 ± 5.8 | 24.1 ± 5.8 | 26.4 ± 6.4 | 22.1 ± 5.8 |
| 24 h post | 9.73 ± 5.8 | 6.69 ± 5.8 | 10.2 ± 5.8 | 18.7 ± 5.8 |
Values are means ± SEM.
Main effect of time, P< 0.05
Main effect of age, P = 0.069
Age × time interaction, P= 0.055
Discussion
This study was conducted to determine age and gender-related differences in SC content up to 24 h following a single bout of high-intensity resistance exercise. The main findings are that Pax7+ SC significantly increased in young men at 24 h following resistance exercise. Another interesting finding was that when the SC data are expressed as percent of total myonuclei, older women (and young men at 24 h) show an increase in the % SC at both 6 and 24 h following resistance exercise. To our knowledge, this is the first study to report changes in SC content within a 24 h time course using the myogenic marker, Pax7 following high-intensity resistance exercise in young and older men and women. Additionally, we report no change in SC content in young women and older men up to 24 h, indicating an impaired response of SC to acute resistance exercise in these groups.
The increase in Pax7+ cells at 24 h in young men in our study agrees with a recent study demonstrating a 36% increase in total Pax7 cells 24 h following muscle lengthening exercise.11 Similarly, the number of CD56+ (cell surface marker on differentiation committed cells) SC increase 24 h following muscle lengthening resistance exercise in young men (0.07 vs. 0.18 sc/fiber) and, to a lesser magnitude, in older men (0.07 vs. 0.10 sc/fiber).37 No changes in neural cell adhesion molecule (NCAM; an isoform of CD56)+ cells were reported at 4 h post muscle lengthening contraction exercise in young men, but increases were observed at 24, 72, and 120 h.38 Moreover, Pax7+ (0.07 vs. 0.14 sc/fiber)7 and NCAM+ (3.1 vs. 6.9 % SC)39 SC have been shown to be elevated 8 days following a single bout of resistance exercise in young men. Collectively, these data demonstrate the influence of resistance type-exercise on SC content in young men, and their prolonged responsiveness to a single bout of exercise.
The increase in percent SC in older women was surprising, as there have been no other reports of a change within 24 h of resistance exercise. Although the change in Pax7+ cells/fiber from baseline to 6 and 24 h was not significant in older women, a trend was detected at P = 0.075. In contrast, older men in this study did not increase in % SC in response to resistance exercise within a 24 h time course. Mackey et al.40 reported significant increases in NCAM+ cells (0.11 to 0.13 sc/fiber) and myonuclei per fiber (1.86 to 2.17 myonuclei/fiber) in older women following 12 weeks of resistance exercise training, which led to no change in % SC over time (5.75 to 5.65 %). In the same study, older men had increased NCAM+ cells (0.11 to 0.15 sc/fiber), but not in myonuclei per fiber (2.51 to 2.52 myonuclei/fiber), resulting in an increase in % SC (4.43 to 5.78 %) due to training. In contrast, Petrella et al.25 demonstrated no change in SC content in older men (0.12 to 0.149 sc/fiber) and women (0.108 to 0.136 sc/fiber) following 16 weeks of resistance exercise training. It is unknown at this point why older women responded and older men did not. However, it is possible that the increase in % SC in older women was not due to increased SC proliferation, but rather to up-regulation of Pax7 expression in cells which initially exhibited non-detectable levels of Pax7.13 Additionally, older men in our study may have been more physically active than the older women, which may have contributed to the SC response in the older women. Since the literature suggests that older men do have increased SC content due to training, it is conceivable that the 24 h ‘impaired’ response may actually be a delayed response, which occurs beyond 24 h post-exercise.
Satellite cell activation results in cell cycle re-entry. The cell cycle is regulated by proteins such as CDK2, cyclin D1, and p27Kip1. Cyclin D1 binds to CDK4 or CDK6,41 whereas CDK2 binds with cyclin A or cyclin E.42 Both complexes are required for phosphorylating retinoblastoma protein (Rb) and, thus increasing cell cycle progression. However, the CDK inhibitor, p27Kip1 can bind either complex to prevent Rb phosphorylation. Cyclin dependent kinase 2 activity is increased when it is phosphorylated at the Thr160 site, which increases G1 to S phase transition, whereas activity of cyclin D1 is maintained in the hypophosphorylated state. We found that p27Kip1 and cyclin D1 protein expression and CDK2 phosphorylation decreased at 6 h following exercise, whereas CDK2 phosphorylation and cyclin D1 further decreased at 24 h across all groups. Studies have shown similar decreases with p27Kip1 at the gene level following resistance exercise,43-45 which is consistent with cell cycle up-regulation. Interestingly, McKay et al.11 reported that, following a single bout of resistance exercise, the number of SC entering G0/G1, S-phase, and G2/M of the cell cycle increased by 32, 202, and 59%, respectively. In our study, the decrease in p27Kip1 protein expression following exercise is consistent with the significant increase in S-phase transition found in the latter study, as p27kip1 is suggested to inhibit G1 to S-phase transition via CDK2. On the other hand, the decrease in CDK2 phosphorylation and cyclin D1 in our study was surprising. Bamman et al.46 demonstrated no change in cyclin D1 protein expression in young and older men and women 24 h following resistance exercise. However, at the gene level, increases in cyclin D144 at 24 h and no change in CDK247 at 48 h post resistance exercise have been reported. Bickel et al.48 demonstrated that mRNA levels of cyclin D1 increase at 12 h following resistance exercise in humans but return to baseline values at 24 h. It is possible that, in our study, maximal expression and activity of cyclin D1 and CDK2 did not occur at 6 or 24 h. Instead, it occurred between 6 and 24 h and led to subsequent increases in SC content in younger men and older women. At this point, we can only speculate on the unsuspected changes in CDK2 and cyclin D1 following resistance exercise in all groups and suggest that other key regulators are involved. Additionally, involvement of these proteins in other pathways may result in changes that are not consistent with cell cycle regulation.49
There are disparities in the literature regarding whether myonuclear addition or myofiber protein expansion occurs first following mechanically-induced muscle growth. For example, Petrella et al.25 reported that a 2,000 μm2 increase in muscle fiber size is required before myonuclear addition occurs. On the contrary, Allen et al.50 and Kadi et al.51 reported a concomitant increase in muscle fiber size and myonuclei following a mechanical stimulus, which maintained myonuclear domain. The change in myonuclei per fiber is due to proliferative expansion and, subsequent fusion of resident SC with the adjacent muscle fiber. In particular, SC number increased by 17% three days following synergistic ablation in rat soleus.52 This led to a concomitant decrease in SC number and an increase in myonuclei at 2 weeks. Furthermore, Schiaffino et al.53 demonstrated increases in SC proliferation at 24 h following synergistic ablation in rat soleus, which resulted in myonuclear addition at 4 weeks. Even though we did not assess SC number beyond 24 h, our observation of an increase in SC number in young men at 24 h supports the latter study. However, in our study, the increase in SC content in young men did not lead to changes in myonuclear addition, as myonuclei per fiber and myonuclear domain were not changed at 24 h. This suggests that only SC expansion, but not terminal differentiation is increased 24 h following exercise. These data suggest that the increase in SC number in young men following resistance exercise may be an adaptive mechanism to facilitate repair or growth of the surrounding muscle fibers. Additionally, the increase in SC content in young men may serve other functions that do not lead to repair or hypertrophy.5
In contrast to young men, resistance exercise did not affect SC content in young women in our study. Furthermore, we observed smaller muscle fiber CSA at baseline and fewer myonuclei per fiber across all time points in young and old women which likely accounts for reductions in myonuclear domain. Research has shown increases in muscle fiber CSA (2958 vs. 4036 μm2), SC content (3.7 vs. 5.4% SC), and myonuclear addition (2.1 vs. 3.6 myonuclei/fiber) in women following 10 weeks of resistance exercise training.24 Although, Petrella et al.25 observed only an increase in muscle fiber CSA, but not SC content or myonuclear number in the vastus lateralis muscle after exercise training, which resulted in an increase in myonuclear domain. Research has demonstrated that women may have a higher resistance to muscle fatigue, which subsequently protects them from muscle damage.54 Other research has concluded that estrogen is responsible for the gender-related differences observed in response to exercise-induced muscle damage.55 It is not known why changes in SC content in young women were not detected in our study; however, young women may have a delayed response. This warrants future research to determine the anabolic effect of acute resistance exercise in women beyond 24 h.
Baseline SC content was not different between groups (0.068, 0.062, 0.051, and 0.032 SC/ fiber for young men, young women, older men and older women, respectively) suggesting that the number of SC associated with a given fiber do not decline with age, which is consistent with some reports.25,26 However, a number of studies have demonstrated an age-related reduction in the number of SC.56,10,57,58 Furthermore, research suggests that the reduction in SC numbers with age is fiber type specific. Verdijk et al.6 reported that not only does type II fiber CSA decrease in older subjects, but SC associated with type II muscle fibers decreases (0.08 vs. 0.044 for young vs. old, respectively), suggesting a potential mechanism for the fiber type specific atrophy seen in older individuals. In our study, similar decreases were noted with type II muscle CSA in older subjects, but differences in SC content were not observed, as we did not differentiate SC associated with each fiber type. Discrepancies between our study and others could be attributed to the muscle studied, physical activity of the subjects, selection of subject age, or the number of muscle fibers used for analysis. Regardless, older men and younger women do not respond within 24 h to an acute bout of unaccustomed resistance exercise with an increase in SC.
As previously mentioned, we observed a significant reduction in p27Kip1 and cyclin D1 protein expression and CDK2 phosphorylation following exercise in all groups. Despite that, older subjects showed an age-related increase in p27Kip1 and decrease in cyclin D1 at baseline with no change in phosphorylation status of CDK2. This suggests that, although CDK2 activity is maintained, p27Kip1 levels are elevated and cyclin D1 levels are suppressed to potentially down-regulate S phase transition of SC in older subjects. Interestingly, older women show a significant decrease in p27Kip1 protein expression with no change in cyclin D1 24 h following an acute bout of resistance exercise.46 The authors suggest that resistance exercise may provide a means to relieve the inhibitory actions of p27Kip1. However, Kim et al.44 reported no change in gene expression of p27kip1 in older subjects following exercise. Although the mechanisms responsible for the age-related differences in SC responsiveness are not entirely clear, some potential upstream regulators of SC activation have been proposed. Mechano-growth factor, which stimulates SC proliferation59, mRNA showed an attenuated response in older subjects, but not younger ones following resistance exercise.60 c-met expression in SC from aged rats is reduced and prevents hepatocyte growth factor binding and SC activation.61 Additionally, the expression of the Notch ligand, Delta, which is pertinent for SC activation, is reduced in SC from older rats following muscle injury.62 Although these data aid in our understanding of SC regulation, the exact mechanism(s) responsible for the age-related impaired responsiveness to exercise require further investigation.
We conclude that changes in SC content, determined by Pax7 immuno-detection, following acute resistance exercise are not evident until 24 h in young men, however, in older women an increase in % SC is detectable at 6 and 24 h. Although initial numbers of SC indicate no age or gender-related differences, young women and older men do not respond with an increase in SC within the first 24 h of post-exercise recovery. Future studies are needed to determine the mechanisms responsible for the time course of SC activation in young women and older men and to determine the precise role of SC in resistance exercise-induced muscle hypertrophy in both young and older adults.
Acknowledgments
We thank our subjects, nurses and staff at the ITS-CRC for their assistance in screening, admitting and assisting with the subjects and Shelley Medina and Junfung Hao for technical assistance. This study was supported by NIH grants R01AR049877, P30AG024832, NIH/NCRR UL1-RR029876, and T32HD07539.
Abbreviations
- CDK2
cyclin dependent kinase 2
- CSA
cross sectional area
- EDL
extensor digitorum longus
- DEXA
dual-energy x-ray absorptiometry
- HGF
hepatocyte growth factor
- MGF
mechano growth factor
- NCAM
neural cell adhesion molecule
- 1RM
one repetition maximum
- PBS
phosphate buffered saline
- Rb
retinoblastoma protein
- RE
resistance exercise
- SC
satellite cells
Bibliography
- 1.Moss FP, Leblond CP. Satellite cells as the source of nuclei in muscles of growing rats. Anat Rec. 1971;170(4):421–435. doi: 10.1002/ar.1091700405. [DOI] [PubMed] [Google Scholar]
- 2.Muir AR, Kanji AH, Allbrook D. The structure of the satellite cells in skeletal muscle. J Anat. 1965;99(Pt 3):435–444. [PMC free article] [PubMed] [Google Scholar]
- 3.Mauro A. Satellite cell of skeletal muscle fibers. J Biophys Biochem Cytol. 1961;9:493–495. doi: 10.1083/jcb.9.2.493. [DOI] [PMC free article] [PubMed] [Google Scholar]
- 4.Seale P, Sabourin LA, Girgis-Gabardo A, Mansouri A, Gruss P, Rudnicki MA. Pax7 is required for the specification of myogenic satellite cells. Cell. 2000;102(6):777–786. doi: 10.1016/s0092-8674(00)00066-0. [DOI] [PubMed] [Google Scholar]
- 5.Mackey AL, Andersen LL, Frandsen U, Suetta C, Sjogaard G. Distribution of myogenic progenitor cells and myonuclei is altered in women with vs. those without chronically painful trapezius muscle. J Appl Physiol. 2010;109(6):1920–1929. doi: 10.1152/japplphysiol.00789.2010. [DOI] [PubMed] [Google Scholar]
- 6.Verdijk LB, Koopman R, Schaart G, Meijer K, Savelberg HH, van Loon LJ. Satellite cell content is specifically reduced in type II skeletal muscle fibers in the elderly. Am J Physiol Endocrinol Metab. 2007;292(1):E151–157. doi: 10.1152/ajpendo.00278.2006. [DOI] [PubMed] [Google Scholar]
- 7.Mikkelsen UR, Langberg H, Helmark IC, Skovgaard D, Andersen LL, Kjaer M, Mackey AL. Local NSAID infusion inhibits satellite cell proliferation in human skeletal muscle after eccentric exercise. J Appl Physiol. 2009;107(5):1600–1611. doi: 10.1152/japplphysiol.00707.2009. [DOI] [PMC free article] [PubMed] [Google Scholar]
- 8.Mackey AL, Brandstetter S, Schjerling P, Bojsen-Moller J, Qvortrup K, Pedersen MM, Doessing S, Kjaer M, Magnusson SP, Langberg H. Sequenced response of extracellular matrix deadhesion and fibrotic regulators after muscle damage is involved in protection against future injury in human skeletal muscle. FASEB J. 2011;25(6):1943–1959. doi: 10.1096/fj.10-176487. [DOI] [PMC free article] [PubMed] [Google Scholar]
- 9.Toth KG, McKay BR, De Lisio M, Little JP, Tarnopolsky MA, Parise G. IL-6 induced STAT3 signalling is associated with the proliferation of human muscle satellite cells following acute muscle damage. PLoS One. 2011;6(3):e17392. doi: 10.1371/journal.pone.0017392. [DOI] [PMC free article] [PubMed] [Google Scholar]
- 10.Carlson ME, Suetta C, Conboy MJ, Aagaard P, Mackey A, Kjaer M, Conboy I. Molecular aging and rejuvenation of human muscle stem cells. EMBO Mol Med. 2009;1(8-9):381–391. doi: 10.1002/emmm.200900045. [DOI] [PMC free article] [PubMed] [Google Scholar]
- 11.McKay BR, Toth KG, Tarnopolsky MA, Parise G. Satellite cell number and cell cycle kinetics in response to acute myotrauma in humans: immunohistochemistry versus flow cytometry. J Physiol. 2010;588(Pt 17):3307–3320. doi: 10.1113/jphysiol.2010.190876. [DOI] [PMC free article] [PubMed] [Google Scholar]
- 12.Crameri RM, Aagaard P, Qvortrup K, Langberg H, Olesen J, Kjaer M. Myofibre damage in human skeletal muscle: effects of electrical stimulation versus voluntary contraction. J Physiol. 2007;583(Pt 1):365–380. doi: 10.1113/jphysiol.2007.128827. [DOI] [PMC free article] [PubMed] [Google Scholar]
- 13.Lindstrom M, Thornell LE. New multiple labelling method for improved satellite cell identification in human muscle: application to a cohort of power-lifters and sedentary men. Histochem Cell Biol. 2009;132(2):141–157. doi: 10.1007/s00418-009-0606-0. [DOI] [PubMed] [Google Scholar]
- 14.Lindstrom M, Pedrosa-Domellof F, Thornell LE. Satellite cell heterogeneity with respect to expression of MyoD, myogenin, Dlk1 and c-Met in human skeletal muscle: application to a cohort of power lifters and sedentary men. Histochem Cell Biol. 2010;134(4):371–385. doi: 10.1007/s00418-010-0743-5. [DOI] [PMC free article] [PubMed] [Google Scholar]
- 15.Mackey A, Andersen LL, Frandsen U, Sjogaard G. Strength training increases the size of the satellite cell pool in type I and II fibres of chronically painful female trapezius muscle. J Physiol. 2011 doi: 10.1113/jphysiol.2011.217885. In Press. [DOI] [PMC free article] [PubMed] [Google Scholar]
- 16.Winchester PK, Davis ME, Alway SE, Gonyea WJ. Satellite cell activation in the stretch-enlarged anterior latissimus dorsi muscle of the adult quail. Am J Physiol. 1991;260(2 Pt 1):C206–212. doi: 10.1152/ajpcell.1991.260.2.C206. [DOI] [PubMed] [Google Scholar]
- 17.Goetsch SC, Hawke TJ, Gallardo TD, Richardson JA, Garry DJ. Transcriptional profiling and regulation of the extracellular matrix during muscle regeneration. Physiol Genomics. 2003;14(3):261–271. doi: 10.1152/physiolgenomics.00056.2003. [DOI] [PubMed] [Google Scholar]
- 18.Schultz E, Jaryszak DL, Valliere CR. Response of satellite cells to focal skeletal muscle injury. Muscle Nerve. 1985;8(3):217–222. doi: 10.1002/mus.880080307. [DOI] [PubMed] [Google Scholar]
- 19.Rosenblatt JD, Yong D, Parry DJ. Satellite cell activity is required for hypertrophy of overloaded adult rat muscle. Muscle Nerve. 1994;17(6):608–613. doi: 10.1002/mus.880170607. [DOI] [PubMed] [Google Scholar]
- 20.Caiozzo VJ, Giedzinski E, Baker M, Suarez T, Izadi A, Lan M, Cho-Lim J, Tseng BP, Limoli CL. The radiosensitivity of satellite cells: cell cycle regulation, apoptosis and oxidative stress. Radiat Res. 2010;174(5):582–589. doi: 10.1667/RR2190.1. [DOI] [PMC free article] [PubMed] [Google Scholar]
- 21.McCarthy JJ, Mula J, Miyazaki M, Erfani R, Garrison K, Farooqui AB, Srikuea R, Lawson BA, Grimes B, Keller C, Van Zant G, Campbell KS, Esser KA, Dupont-Versteegden EE, Peterson CA. Effective fiber hypertrophy in satellite cell-depleted skeletal muscle. Development. 2011;138(17):3657–3666. doi: 10.1242/dev.068858. [DOI] [PMC free article] [PubMed] [Google Scholar]
- 22.Amthor H, Otto A, Vulin A, Rochat A, Dumonceaux J, Garcia L, Mouisel E, Hourde C, Macharia R, Friedrichs M, Relaix F, Zammit PS, Matsakas A, Patel K, Partridge T. Muscle hypertrophy driven by myostatin blockade does not require stem/precursor-cell activity. Proc Natl Acad Sci U S A. 2009;106(18):7479–7484. doi: 10.1073/pnas.0811129106. [DOI] [PMC free article] [PubMed] [Google Scholar]
- 23.Blaauw B, Canato M, Agatea L, Toniolo L, Mammucari C, Masiero E, Abraham R, Sandri M, Schiaffino S, Reggiani C. Inducible activation of Akt increases skeletal muscle mass and force without satellite cell activation. FASEB J. 2009;23(11):3896–3905. doi: 10.1096/fj.09-131870. [DOI] [PubMed] [Google Scholar]
- 24.Kadi F, Thornell LE. Concomitant increases in myonuclear and satellite cell content in female trapezius muscle following strength training. Histochem Cell Biol. 2000;113(2):99–103. doi: 10.1007/s004180050012. [DOI] [PubMed] [Google Scholar]
- 25.Petrella JK, Kim JS, Cross JM, Kosek DJ, Bamman MM. Efficacy of myonuclear addition may explain differential myofiber growth among resistance-trained young and older men and women. Am J Physiol Endocrinol Metab. 2006;291(5):E937–946. doi: 10.1152/ajpendo.00190.2006. [DOI] [PubMed] [Google Scholar]
- 26.Hikida RS, Eriksson A, Holmner S, Thornell LE. Is hypertrophy limited in elderly muscle fibers? A comparison of elderly and young strength-trained men. Basic and Applied Myology: BAM. 1998;8:419–427. [Google Scholar]
- 27.Kadi F, Schjerling P, Andersen LL, Charifi N, Madsen JL, Christensen LR, Andersen JL. The effects of heavy resistance training and detraining on satellite cells in human skeletal muscles. J Physiol. 2004;558(Pt 3):1005–1012. doi: 10.1113/jphysiol.2004.065904. [DOI] [PMC free article] [PubMed] [Google Scholar]
- 28.Ishimoto S, Goto I, Ohta M, Kuroiwa Y. A quantitative study of the muscle satellite cells in various neuromuscular disorders. J Neurol Sci. 1983;62(1-3):303–314. doi: 10.1016/0022-510x(83)90207-1. [DOI] [PubMed] [Google Scholar]
- 29.Schmalbruch H, Hellhammer U. The number of satellite cells in normal human muscle. Anat Rec. 1976;185(3):279–287. doi: 10.1002/ar.1091850303. [DOI] [PubMed] [Google Scholar]
- 30.Tome FM, Fardeau M. Nuclear changes in muscle disorders. Methods Achiev Exp Pathol. 1986;12:261–296. [PubMed] [Google Scholar]
- 31.Renault V, Thornell LE, Eriksson PO, Butler-Browne G, Mouly V. Regenerative potential of human skeletal muscle during aging. Aging Cell. 2002;1(2):132–139. doi: 10.1046/j.1474-9728.2002.00017.x. [DOI] [PubMed] [Google Scholar]
- 32.Decary S, Mouly V, Hamida CB, Sautet A, Barbet JP, Butler-Browne GS. Replicative potential and telomere length in human skeletal muscle: implications for satellite cell-mediated gene therapy. Hum Gene Ther. 1997;8(12):1429–1438. doi: 10.1089/hum.1997.8.12-1429. [DOI] [PubMed] [Google Scholar]
- 33.Corbu A, Scaramozza A, Badiali-DeGiorgi L, Tarantino L, Papa V, Rinaldi R, D'Alessandro R, Zavatta M, Laus M, Lattanzi G, Cenacchi G. Satellite cell characterization from aging human muscle. Neurol Res. 2010;32(1):63–72. doi: 10.1179/174313209X385725. [DOI] [PubMed] [Google Scholar]
- 34.Grounds MD. Age-associated changes in the response of skeletal muscle cells to exercise and regeneration. Ann N Y Acad Sci. 1998;854:78–91. doi: 10.1111/j.1749-6632.1998.tb09894.x. [DOI] [PubMed] [Google Scholar]
- 35.Fry CS, Drummond MJ, Glynn EL, Dickinson JM, Gundermann DM, Timmerman KL, Walker DK, Dhanani S, Volpi E, Rasmussen BB. Aging impairs contraction-induced human skeletal muscle mTORC1 signaling and protein synthesis. Skeletal Muscle. 2011;1:11. doi: 10.1186/2044-5040-1-11. [DOI] [PMC free article] [PubMed] [Google Scholar]
- 36.Mackey AL, Kjaer M, Charifi N, Henriksson J, Bojsen-Moller J, Holm L, Kadi F. Assessment of satellite cell number and activity status in human skeletal muscle biopsies. Muscle Nerve. 2009;40(3):455–465. doi: 10.1002/mus.21369. [DOI] [PubMed] [Google Scholar]
- 37.Dreyer HC, Blanco CE, Sattler FR, Schroeder ET, Wiswell RA. Satellite cell numbers in young and older men 24 hours after eccentric exercise. Muscle Nerve. 2006;33(2):242–253. doi: 10.1002/mus.20461. [DOI] [PubMed] [Google Scholar]
- 38.O'Reilly C, McKay B, Phillips S, Tarnopolsky M, Parise G. Hepatocyte growth factor (HGF) and the satellite cell response following muscle lengthening contractions in humans. Muscle Nerve. 2008;38(5):1434–1442. doi: 10.1002/mus.21146. [DOI] [PubMed] [Google Scholar]
- 39.Crameri RM, Langberg H, Magnusson P, Jensen CH, Schroder HD, Olesen JL, Suetta C, Teisner B, Kjaer M. Changes in satellite cells in human skeletal muscle after a single bout of high intensity exercise. J Physiol. 2004;558(Pt 1):333–340. doi: 10.1113/jphysiol.2004.061846. [DOI] [PMC free article] [PubMed] [Google Scholar]
- 40.Mackey AL, Esmarck B, Kadi F, Koskinen SO, Kongsgaard M, Sylvestersen A, Hansen JJ, Larsen G, Kjaer M. Enhanced satellite cell proliferation with resistance training in elderly men and women. Scand J Med Sci Sports. 2007;17(1):34–42. doi: 10.1111/j.1600-0838.2006.00534.x. [DOI] [PubMed] [Google Scholar]
- 41.Sherr CJ. Cancer cell cycles. Science. 1996;274(5293):1672–1677. doi: 10.1126/science.274.5293.1672. [DOI] [PubMed] [Google Scholar]
- 42.Cobrinik D. Pocket proteins and cell cycle control. Oncogene. 2005;24(17):2796–2809. doi: 10.1038/sj.onc.1208619. [DOI] [PubMed] [Google Scholar]
- 43.Roberts MD, Dalbo VJ, Hassell SE, Brown R, Kerksick CM. Effects of preexercise feeding on markers of satellite cell activation. Med Sci Sports Exerc. 2010;42(10):1861–1869. doi: 10.1249/MSS.0b013e3181da8a29. [DOI] [PubMed] [Google Scholar]
- 44.Kim JS, Cross JM, Bamman MM. Impact of resistance loading on myostatin expression and cell cycle regulation in young and older men and women. Am J Physiol Endocrinol Metab. 2005;288(6):E1110–1119. doi: 10.1152/ajpendo.00464.2004. [DOI] [PubMed] [Google Scholar]
- 45.Wilborn CD, Taylor LW, Greenwood M, Kreider RB, Willoughby DS. Effects of different intensities of resistance exercise on regulators of myogenesis. J Strength Cond Res. 2009;23(8):2179–2187. doi: 10.1519/JSC.0b013e3181bab493. [DOI] [PubMed] [Google Scholar]
- 46.Bamman MM, Ragan RC, Kim JS, Cross JM, Hill VJ, Tuggle SC, Allman RM. Myogenic protein expression before and after resistance loading in 26- and 64-yr-old men and women. J Appl Physiol. 2004;97(4):1329–1337. doi: 10.1152/japplphysiol.01387.2003. [DOI] [PubMed] [Google Scholar]
- 47.Hulmi JJ, Kovanen V, Selanne H, Kraemer WJ, Hakkinen K, Mero AA. Acute and long-term effects of resistance exercise with or without protein ingestion on muscle hypertrophy and gene expression. Amino Acids. 2009;37(2):297–308. doi: 10.1007/s00726-008-0150-6. [DOI] [PubMed] [Google Scholar]
- 48.Bickel CS, Slade J, Mahoney E, Haddad F, Dudley GA, Adams GR. Time course of molecular responses of human skeletal muscle to acute bouts of resistance exercise. J Appl Physiol. 2005;98(2):482–488. doi: 10.1152/japplphysiol.00895.2004. [DOI] [PubMed] [Google Scholar]
- 49.Golsteyn RM. Cdk1 and Cdk2 complexes (cyclin dependent kinases) in apoptosis: a role beyond the cell cycle. Cancer Lett. 2005;217(2):129–138. doi: 10.1016/j.canlet.2004.08.005. [DOI] [PubMed] [Google Scholar]
- 50.Allen DL, Monke SR, Talmadge RJ, Roy RR, Edgerton VR. Plasticity of myonuclear number in hypertrophied and atrophied mammalian skeletal muscle fibers. J Appl Physiol. 1995;78(5):1969–1976. doi: 10.1152/jappl.1995.78.5.1969. [DOI] [PubMed] [Google Scholar]
- 51.Kadi F, Eriksson A, Holmner S, Butler-Browne GS, Thornell LE. Cellular adaptation of the trapezius muscle in strength-trained athletes. Histochem Cell Biol. 1999;111(3):189–195. doi: 10.1007/s004180050348. [DOI] [PubMed] [Google Scholar]
- 52.Snow MH. Satellite cell response in rat soleus muscle undergoing hypertrophy due to surgical ablation of synergists. Anat Rec. 1990;227(4):437–446. doi: 10.1002/ar.1092270407. [DOI] [PubMed] [Google Scholar]
- 53.Schiaffino S, Bormioli SP, Aloisi M. Cell proliferation in rat skeletal muscle during early stages of compensatory hypertrophy. Virchows Arch B Cell Pathol. 1972;11(3):268–273. doi: 10.1007/BF02889406. [DOI] [PubMed] [Google Scholar]
- 54.Clark BC, Collier SR, Manini TM, Ploutz-Snyder LL. Sex differences in muscle fatigability and activation patterns of the human quadriceps femoris. Eur J Appl Physiol. 2005;94(1-2):196–206. doi: 10.1007/s00421-004-1293-0. [DOI] [PubMed] [Google Scholar]
- 55.Tiidus PM. Can oestrogen influence skeletal muscle damage, inflammation, and repair? Br J Sports Med. 2005;39(5):251–253. doi: 10.1136/bjsm.2005.016881. [DOI] [PMC free article] [PubMed] [Google Scholar]
- 56.Sajko S, Kubinova L, Cvetko E, Kreft M, Wernig A, Erzen I. Frequency of M-cadherin-stained satellite cells declines in human muscles during aging. J Histochem Cytochem. 2004;52(2):179–185. doi: 10.1177/002215540405200205. [DOI] [PubMed] [Google Scholar]
- 57.Verdijk LB, Snijders T, Beelen M, Savelberg HH, Meijer K, Kuipers H, Van Loon LJ. Characteristics of muscle fiber type are predictive of skeletal muscle mass and strength in elderly men. J Am Geriatr Soc. 2010;58(11):2069–2075. doi: 10.1111/j.1532-5415.2010.03150.x. [DOI] [PubMed] [Google Scholar]
- 58.Kadi F, Charifi N, Denis C, Lexell J. Satellite cells and myonuclei in young and elderly women and men. Muscle Nerve. 2004;29(1):120–127. doi: 10.1002/mus.10510. [DOI] [PubMed] [Google Scholar]
- 59.Philippou A, Papageorgiou E, Bogdanis G, Halapas A, Sourla A, Maridaki M, Pissimissis N, Koutsilieris M. Expression of IGF-1 isoforms after exercise-induced muscle damage in humans: characterization of the MGF E peptide actions in vitro. In Vivo. 2009;23(4):567–575. [PubMed] [Google Scholar]
- 60.Hameed M, Orrell RW, Cobbold M, Goldspink G, Harridge SD. Expression of IGF-I splice variants in young and old human skeletal muscle after high resistance exercise. J Physiol. 2003;547(Pt 1):247–254. doi: 10.1113/jphysiol.2002.032136. [DOI] [PMC free article] [PubMed] [Google Scholar]
- 61.Barani AE, Durieux AC, Sabido O, Freyssenet D. Age-related changes in the mitotic and metabolic characteristics of muscle-derived cells. J Appl Physiol. 2003;95(5):2089–2098. doi: 10.1152/japplphysiol.00437.2003. [DOI] [PubMed] [Google Scholar]
- 62.Conboy IM, Conboy MJ, Smythe GM, Rando TA. Notch-mediated restoration of regenerative potential to aged muscle. Science. 2003;302(5650):1575–1577. doi: 10.1126/science.1087573. [DOI] [PubMed] [Google Scholar]