Abstract
The relationship between fabric (a measure of structural anisotropy) and elastic properties of trabecular bone (TB) was examined by invoking morphology and homogenization theory on the basis of micro magnetic resonance images (μMRI) from the distal tibia in specimens (N=30) and human subjects (N=16) acquired at a 160×160×160 μm3 voxel size. The fabric tensor was mapped in 7.5×7.5×7.5 mm3 cubic subvolumes by a 3D mean-intercept-length method. Elastic constants (three Young’s and three shear moduli) were derived from linear micro finite-element (μFE) simulations of 3D grayscale bone volume fraction mapped images. In the specimen data, moduli fit power laws of bone volume fraction (BV/TV) for all three test directions and subvolumes (R2 0.92 – 0.98) with exponents ranging from 1.3 to 1.8. Weaker linear relationships were found for the in vivo data due to a narrower range in BV/TV. When pooling the data for all test directions and subvolumes, BV/TV predicted elastic moduli less well in the specimens (mean R2=0.74) and not at all in vivo. A model of BV/TV and fabric was highly predictive of μFE-derived Young’s moduli: mean R2s of 0.98 and 0.82 (in vivo). The results show that fabric, an important predictor of bone mechanical properties, can be assessed in the limited resolution and SNR regime of μMRI.
Keywords: micro magnetic resonance imaging, trabecular bone, finite element analysis, structural anisotropy, fabric tensor
Introduction
Osteoporotic fractures typically occur at sites rich in trabecular bone (TB). The contribution of TB to load bearing has been shown to exceed that of cortical bone in the distal radius and tibia (1). The mechanical competence of the TB network depends on a number of parameters, chief among which are bone volume fraction, trabecular architecture (topology, orientation), and degree of mineralization. The clinical measure of bone mineral density (BMD) expressed in terms of areal or volumetric density is a combination of both volume fraction and degree of mineralization. Experimental studies have revealed that approximately 60–80% of the variance in bone’s mechanical properties can be attributed to BMD (2–4). BMD, however, offers no information on trabecular architecture, and thus, provides an incomplete picture of osteoporotic fracture risk (5,6).
An important characteristic of the TB structure is its directional dependence (structural anisotropy), an attribute recognized early by Wolff (see, for example, (7)). Whitehouse (8) first quantified structural anisotropy by conceiving the line intercept method, which is based on a measurement of the number of line intercepts across marrow along a particular direction, typically obtained from optical micrographs of sections of trabecular bone. When plotted as a function of direction the mean intercept lengths trace an ellipse (also called rose plot). In three dimensions, angular sampling of mean intercept length yields an ellipsoid, which can be expressed as a second-rank tensor known as a fabric tensor (9). Fabric tensors provide compact descriptions of orthotropic structural anisotropy in the form of 3×3 matrices, where the eigenvectors w1, w2, w3 define the main directions of the ellipsoid’s axes and the eigenvalues λ1, λ2, λ3 the axes’ lengths.
Work by Goldstein et al (10) revealed, on the basis of 3D reconstructions of microcomputed tomography (μCT) images of specimens of trabecular bone, that in normal bone, more than 80% of the variance in mechanical behavior can be explained by measures of density and orientation. Cowin linked structural and mechanical anisotropy by establishing a theoretical framework under the assumption that trabecular bone possesses orthotropic symmetry and that bone can be modeled by assuming an isotropic tissue modulus (11). Invoking Cowin’s model, Turner et al subsequently showed that fabric measures could explain 72 to 94% of the variance in elastic constants (12) in TB samples from bovine femur and human proximal tibia. Van Rietbergen et al also demonstrated in 3D images obtained from serial sections of TB from a whale vertebral body that inclusion of fabric substantially improved bone volume fraction-based prediction of elastic constants (13). Additional evidence of the role of structural anisotropy as a contributor to bone mechanical properties was provided by Oden et al (14), showing that BMD was only moderately predictive of failure stress (R2=0.44, p=0.004) while the mean intercept length measured along the loading direction was much more strongly associated with this parameter (R2=0.85, p<0.001). Another study, conducted on the basis of μCT images of femoral neck surgical specimens, indicated that TB structural anisotropy was markedly greater in individuals with hip fracture than in those without fractures (15).
Advances in high-resolution peripheral quantitative computed tomography (HR-pQCT) (16,17) and micro magnetic resonance imaging (μMRI) (18,19) permit noninvasive assessment of bone architecture and measures of biomechanical competence by subjecting the resulting images to micro-finite element (μFE) analysis (20–22). However, the role of fabric and its relationship to bone mechanical properties has not previously been examined under conditions of limited signal-to-noise ratio (SNR) and resolution characteristic of in vivo imaging.
Micro-FE, performed on the basis of high-resolution μCT images, has previously demonstrated to yield excellent agreement with mechanical testing (see, for example, Kabel, et al, (23)). Further, some of the present work’s authors have shown recently that μFE derived mechanical constants based on in vivo resolution images, are highly correlated with those derived from high-resolution μCT images (21).
In this work we examined the contributions from fabric, derived from specimen and in vivo μMR images of the human distal tibia, to the elastic constants estimated from image-based μFE models of the same images. The relationship derived by Cowin linking fabric to elastic measures was then examined relative to the dependence of the elastic measures on bone volume fraction alone. We hypothesize that by including TB orientation in the model linking bone volume fraction and elastic properties, an improved prediction of the elastic properties can be achieved.
Methods
MR Imaging
High-resolution MR images of thirty left (15) and right (15) human distal tibia specimens of 25 mm axial length previously obtained at 1.5T field strength (21) were processed as described below. In addition, 3T MR images of the distal left tibia from sixteen subjects (seven healthy young and nine post-menopausal) were analyzed for the purpose of evaluating the method in images acquired in vivo at the same image voxel size. Images of the younger subjects (age range: 22–42 years, mean: 34 years) were taken from a recently completed reproducibility study in which two female and five male volunteers had been imaged repeatedly (24). Images of the older subjects represent a subset of an ongoing drug intervention trial in postmenopausal women (age range: 60–84 years, mean: 68 years) who were either osteoporotic or osteopenic, acquired at baseline. The study was approved by the University of Pennsylvania’s IRB and all subjects enrolled provided informed consent. Images of both subject groups were obtained with the same scan protocol as detailed in (24) to achieve an isotropic voxel size of 160μm in 16 minutes 40 seconds.
Image Processing and Structural Analysis
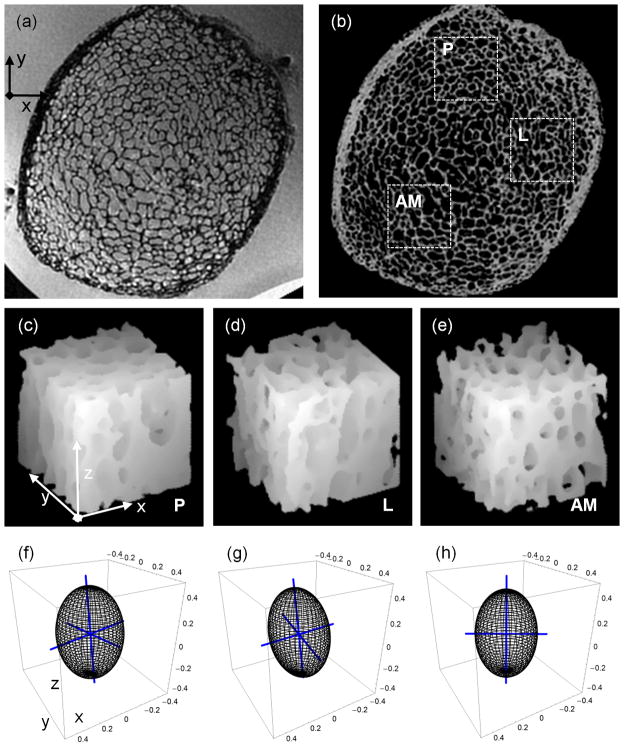
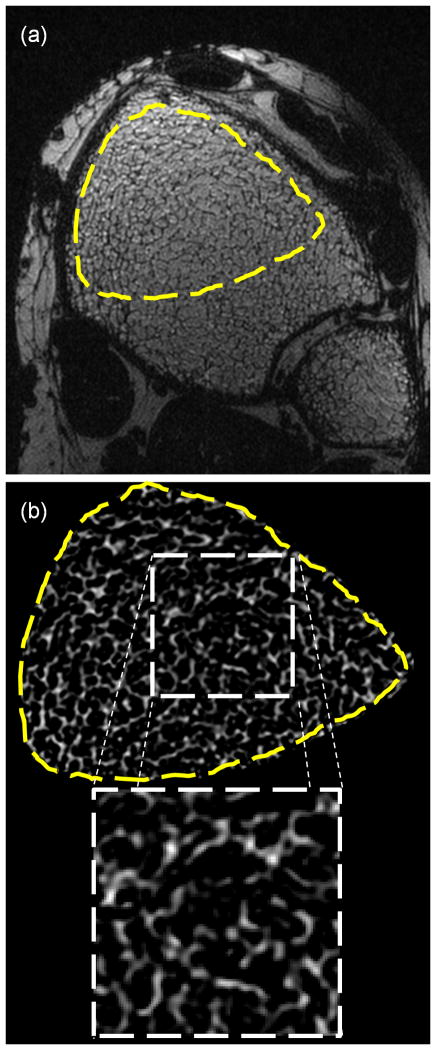
Each specimen image (Figure 1a) was bone volume fraction (BVF) processed to yield a grayscale image with pure bone and pure marrow corresponding to intensities of 100 and 0 (Figure 1b). The BVF-mapping procedure involves scaling of the image intensities relative to locally-calculated marrow intensity levels to remove intensity variations due to surface receive coils, as described by Vasilic et al (25). Bone volume divided by total volume (i.e. BV/TV) represents the average BVF of all voxels within a TB subvolume. The vertical trabecular plates in the tibia are approximately parallel to the endosteal cortical boundary (26,27), leading to substantially different structural anisotropies in anterior, posterior and lateral locations as visually apparent (Figure 1). Therefore, three 7.5×7.5×7.5 mm3 subvolumes of TB were selected at posterior (P), lateral (L), and anterior-medial (AM) locations (Figures 1c–e). To sample the heterogeneous TB architecture at this skeletal site, the three subvolumes were automatically positioned within the cortical boundary by moving away from the center of each tibia along the x (L), y (P), and −y, −x (AM) directions. The structural heterogeneity at this skeletal site is captured well by the 3D renditions of the three subvolumes (Figures 1c – e) and the resulting mean-intercept-length tensors (Figures 1f – h). Details on the computation of the mean-intercept-length tensor are provided below. A single 7.5×7.5×7.5mm3 subvolume of TB was then extracted from the anterior portion (where SNR was highest) of the BVF-mapped distal tibia within each of the in vivo images (Figure 2).
Figure 1.
(a) Image of distal tibia specimen acquired by isotropic FLASE pulse sequence; (b) BVF-map of (a) with three 7.5×7.5×7.5mm3 sub-volumes from posterior-P, lateral-L, and anterior-medial-AM portions of the tibia; (c, d, e) surface-renderings of three sub-volumes rotated CCW by 30° relative to plane of (b) show differences in TB’s in-plane directional dependence; (f, g, h) fabric ellipsoids and associated eigenvectors (blue axes of ellipsoids) capture in-plane orientation of TB in the three sub-volumes (i.e. c, d, and e), respectively.
Figure 2.
(a) In vivo isotropic FLASE image of distal tibia with high-SNR region indicated. (b) BVF-map of high-SNR region with zoom-in of 7.5×7.5×7.5mm3 sub-volume used in structural and mechanical analyses.
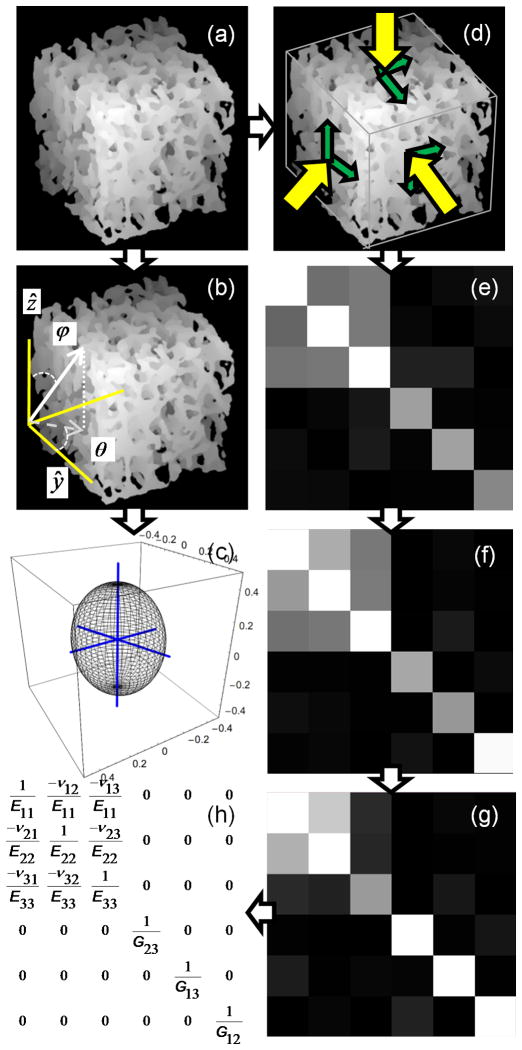
BV/TV and fabric tensor were calculated for each 7.5×7.5×7.5mm3 BVF-mapped subvolume (Figure 3a). MIL was sampled at 5° angular increments of polar angles ϕ and θ (Figure 3b), resulting in 905 MIL samples distributed evenly over the unit sphere. A threshold value of BVF ≥15% was used to identify the bone phase during intercept sampling. Each 3D Rose plot of the MIL sample points was then fit to an ellipsoid whose matrix representation denotes the MIL structural tensor M. The associated fabric tensor, denoted H, was calculated as the inverse square-root of M (28) so that the largest eigenvalue of H corresponded to the direction of largest MIL. An ellipsoid representation of H (after normalization of the radii) is shown in Figure 3c. Eigenvalues and eigenvectors of H were determined using spectral decomposition. The normalized eigenvalues (λ1, λ2, λ3) and their eigenvectors w1, w2, w3 were used to describe the TB orientation relative to the image coordinate system through the three angles θx, θy, θz defined in Figure 4a. The angle between the principal material axis w3 and z, (the direction of the imaging gradient, approximately parallel to the tibial axis, i.e. the infero-superior direction) was computed as θz = cos−1(w3•z). Angles θx and θy were defined similarly, but restricted to the transverse plane (i.e. xy plane, x and y corresponding to antero-posterior and medio-lateral directions, respectively) such that θy (θx) is the angle between the projection of w2 (w1) onto the xy plane and image y (x) axis.
Figure 3.
(a) Surface-rendering of 7.5×7.5×7.5mm3 sub-volume of TB from Figure 2b rotated CCW by 30°. (b) Uniform spherical sampling of mean-intercept-length in image coordinate system. (c) fabric ellipsoid with axes indicating TB’s principal material directions (axes are lengthened by 20% to extend outside of ellipsoid). (d–h) Steps in estimation of orthotropic mechanical constants (E11, E22, E33, G12, G13, G23, v12, v13, v23): (d) μFE simulation to compute S (e); (f) diagonalization (see text) of S leads to So; (g) compliance matrix C calculated as inverse of So; and (h) orthotropic compliance matrix Co used in determining mechanical constants.
Figure 4.
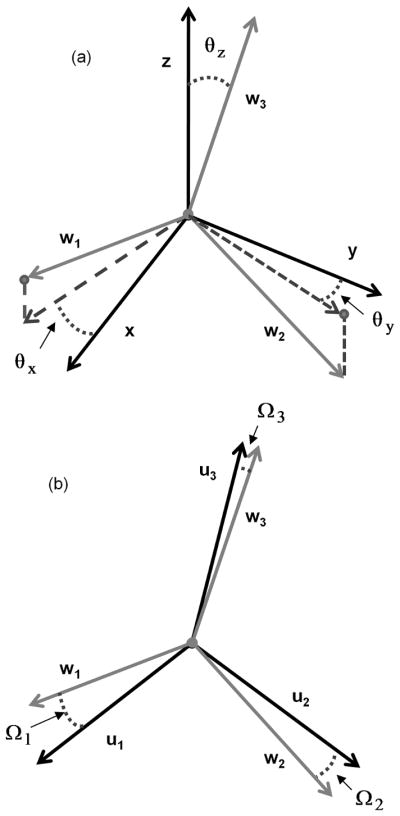
Relationships between image/scanner axes (x, y, and z) and fabric eigenvectors w1, w2, w3 (a) and fabric eigenvectors and mechanical axes u1, u2, u3 (b). (a) Angles θx, θy, θz indicate the deviation of the three fabric eigenvectors from the axes of the image coordinate system where x, y, and z axes corresponded to the antero-posterior, medial-lateral, and inferio-superior directions, respectively. (b) Angle Ωi=cos−1(wi•ui) between the orthotropic mechanical axes and the fabric eigenvectors.
Micro-finite element analysis
BVF-mapped cubic subvolumes were subjected to six stress/strain simulations via μFE analysis (Figure 3d). The μFE approach used in the present work (21) closely follows the algorithm described previously by van Rietbergen and others (see, for example, (29)). Briefly, image voxels were modeled as hexahedral elements with a Poisson’s ratio of 0.3 and tissue moduli (Etissue) proportional to BVF such that for pure bone voxels (BVF=100%), Etissue=15 GPa (30), values which have been used widely (see, for example, (31). Three compressive and three shear displacements were individually applied upon the faces of a subvolume while partially restricting the opposing face. Simulations resulted in a 6×6 stiffness matrix defined relative to the laboratory reference frame (i.e. image coordinate system):
| [1] |
Off-diagonal elements, denoted δij, are zero when the three loading directions (i.e. the measurement coordinate axes) parallel the normal vectors of the three planes of orthotropic symmetry. In practice, as shown in Figure 3e, values of δij are non-zero but small relative to the Sij terms. Through tensor rotation of S from the laboratory coordinate system to the coordinate system of approximate orthotropic symmetry, So= RTθ x,θ y,θ z S Rθ x,θ y,θ z, δijs of So will be minimized (zero if the structure were strictly orthotropic). Thus, an orthotropic stiffness matrix So (Figure 3f) can be estimated through transformation of S by minimizing the residual function (29),
| [2] |
The residual function was minimized relative to three rotation angles about x, y, and z axes of the image coordinate system, denoted θx, θy, θz, which were allowed to vary from −45° to 45° in 1° increments. Vectors u1, u2, u3 define the mechanical axes of approximate orthotropic symmetry, based on the rotation of the image coordinate system via Rθ x,θ y,θ z. The compliance matrix was then calculated by C = So−1 (Figure 3g).
The nine orthotropic elastic constants (three Young’s moduli, Eii (i=1, 2, 3), three shear moduli, Gij (i, j=1, 2, 3; i≠j), and three Poisson’s ratios, vij (i, j=1, 2, 3; i≠j)) were determined from the expressions in Figure 3h for the orthotropic compliance matrix Co (i.e. Co with all δij replaced by zeros). The error in the stress-strain relationship (29) caused by forcing orthotropic symmetry was calculated as:
| [3] |
where I is the 6×6 identity matrix and || ||is the matrix norm operator.
Association between Structural and Mechanical Anisotropy
Cowin’s model (11) expresses the nine coefficients of the orthotropic compliance tensor Co in terms of fabric eigenvalues λ1, λ2, λ3, the second invariant of the fabric tensor Π= λ1λ2+ λ1λ3+ λ2λ3, and nine functions of the bone volume fraction k1-k9 (12):
| [4a] |
| [4b] |
| [4c] |
| [4d] |
where i, j=1,2,3; i≠j. Eq. [4d] expresses the power-law dependence of the elastic modulus on the material volume fraction ρ where kam, kbm are eighteen empirically determined constants and m=1, 2, …, 9. Prior studies found that bone stiffness can be described as a power of material volume fraction with an exponent α in the interval of 0.5 to 3.0 (32–34).
The alignment between the fabric eigenvectors w1, w2, w3 and orthotropic mechanical axes u1, u2, u3 (as determined from minimization of Eq. 2) was evaluated and expressed in terms of offset angles Ω1, Ω2, Ω3 (Figure 4b). For simplicity, the average offset angle Ωavg was computed from Ω1, Ω2, Ω3. Assuming Ω1, Ω2, Ω3 are small per Cowin’s assumption, the fabric eigenvalues, BV/TV (in place of ρ), and the nine μFE-calculated compliance entries were input into the matrix formulation of Eq. [4]:
| [5] |
Here, A is a 9×9 matrix containing the fabric information and engineering strain conversion factors of Eq. [4]. The 18 unknown constants kαam, kαbm were found using a least-squares approximation for each exponent α, which was varied between 0.8 and 3 in increments of 0.1. Goodness-of-fit expressed in terms of R2 was calculated for each correlation and then adjusted, when necessary, to account for the degrees of freedom in multiple parameter-fits according to R2adj=1− (1− R2) (N−1)/(N−K−1), where N is the number of measurements and K is the number of unknowns (12). The joint fit of Eq. [4] relative to the pooled specimen or in vivo data involved N=90×9=810 (16×9=144) and K=18+1=19. The 18 unknown constants kαam, kαbm and exponent α were calculated using the joint fit. When considering regressions of specific elastic constants, e.g. the three Young’s moduli, E11, E22 and E33, N is 90×3=270 for the specimen, and 16×3=48 for the in vivo subset, while K = 19. For comparison, the nine μFE-derived elastic constants were also correlated to linear and power-law models of BV/TV.
Finally, analysis of variance (ANOVA) was performed to assess the ability of the best-fit orthotropic model to distinguish young, healthy subjects from the post-menopausal sub-group. Significance levels for structural measures, μFE-derived elastic constants, and model predicted elastic constants were compared.
Results
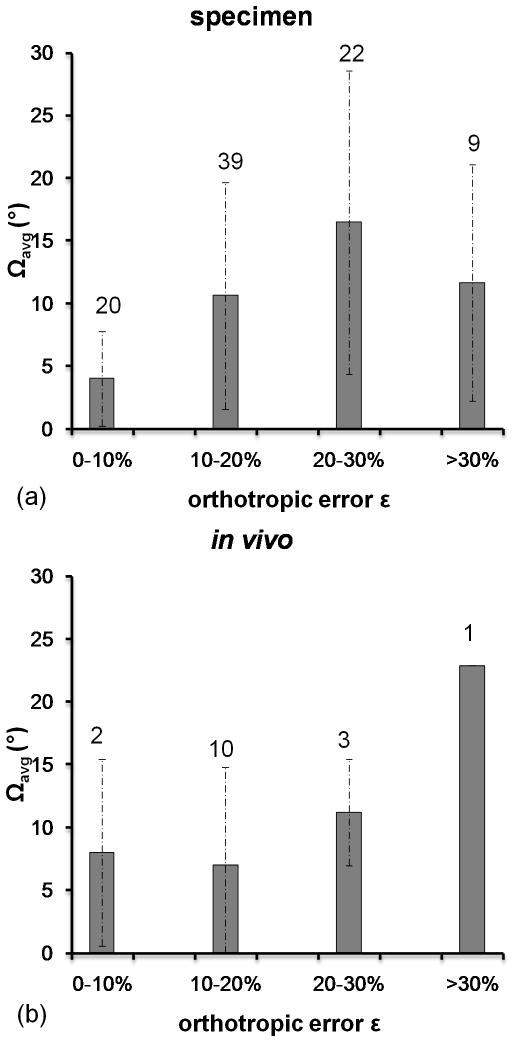
Means and standard deviations of structural measures for specimen and in vivo datasets are summarized in Table 1a. Fabric eigenvalues λ1, λ2, λ3 and orientation angles θx, θy, θz confirm the directional dependence visually apparent in the specimen subvolumes (Figure 1). Fabric ellipsoids indicate that the principal direction of trabeculae coincides with the longitudinal direction of the tibia (i.e. image z axis, parallel to the external field Bo). This is shown by λ3 being the largest eigenvalue and θz being small (i.e. w3 is closely aligned with z, Table 1a). The minor axes differ substantially between the three anatomical regions (labeled L, P, and AM in Figure 1). The average offset angle (Ωavg: mean of Ω1, Ω2, Ω3) indicates that the fabric axes and orthotropic mechanical axes are approximately 11.2° (specimen) and 9.2° (in vivo) offset from each another.
Table 1.
Tables 1a and b. Means and standard deviations for structural and mechanical parameters
| (a) | Structural | |||||||||
|---|---|---|---|---|---|---|---|---|---|---|
|
| ||||||||||
| BV/TV (%) | λ1 | λ2 | λ3 | θx | θy | θz | Ωavg | ε | ||
|
|
||||||||||
| Specimen | L | 20±7.3 | 0.28± 0.016 | 0.32± 0.013 | 0.40± 0.011 | 19± 18 | 19± 18 | 6.3± 3.1 | 12± 11 | 17± 8.5 |
| P | 22± 6.3 | 0.32± 0.021 | 0.28± 0.020 | 0.40± 0.014 | 76± 11 | 76± 11 | 6.9± 3.1 | 8.7± 9.1 | 16± 6.3 | |
| AM | 21± 7.3 | 0.29± 0.024 | 0.32± 0.028 | 0.39± 0.02 | 44± 21 | 44± 21 | 7.9± 3.8 | 13± 10 | 23± 10 | |
|
| ||||||||||
| In vivo | 11± 0.95 | 0.32± 0.020 | 0.30± 0.014 | 0.38± 0.012 | 28± 22 | 28± 22 | 12± 6.5 | 9.2± 7.4 | 16± 7.5 | |
| (b) | Mechanical | |||||||||
|
| ||||||||||
| E11 | E22 | E33 | G12 | G13 | G23 | ν12 | ν13 | ν23 | ||
|
|
||||||||||
| Specimen | L | 1.1± 0.66 | 1.4± 0.83 | 2.04± 1.11 | 0.58± 0.34 | 0.64± 0.37 | 0.73± 0.39 | 0.24± 0.041 | 0.14± 0.025 | 0.18± 0.037 |
| P | 1.6± 0.79 | 1.2± 0.62 | 2.27± 0.95 | 0.61± 0.28 | 0.78± 0.34 | 0.66± 0.29 | 0.31± 0.042 | 0.18± 0.022 | 0.14± 0.034 | |
| AM | 1.3± 0.76 | 1.3± 0.76 | 2.18± 1.00 | 0.59± 0.30 | 0.71± 0.35 | 0.72± 0.35 | 0.27± 0.029 | 0.16± 0.025 | 0.16± 0.036 | |
|
| ||||||||||
| In vivo | 0.58± 0.10 | 0.45± 0.082 | 0.82± 0.084 | 0.22± 0.022 | 0.25± 0.032 | 0.29± 0.042 | 0.22± 0.034 | 0.15± 0.018 | 0.18± 0.024 | |
Units: BV/TV and ε (%), θ and Ω (°), E and G (GPa)
Means and standard deviations of the orthotropic elastic constants and orthotropic errors for specimen and in vivo datasets are summarized in Table 1b. Orthotropic errors ε based on S are 30±17% and 24±11% for specimen and in vivo data, respectively. After calculation of So via minimization of Eq. 2 values are 18±9% (specimen) and 16±7% (in vivo), corresponding to a 40% and 33% reduction in orthotropic error.
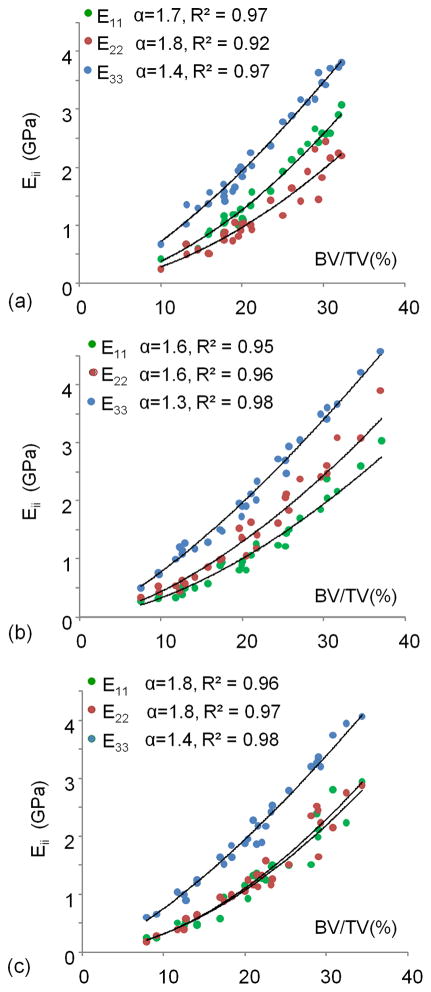
In Figure 5, elastic moduli are plotted as a function of BV/TV for the three sub-volumes in the specimen images. We note that the computed Young’s moduli fit power laws of bone volume fraction very well, with three distinct families of curves, each pertaining to a particular test direction (R2 = 0.92 – 0.98, exponent α = 1.3 – 1.8 where larger α values are found for transverse Young’s moduli). As expected, E33, the Young’s modulus approximately in the infero-superior loading direction, is largest, whereas medio-lateral and antero-posterior directions yield similar but lower stiffness values. The three distinct sets of curves are a direct manifestation of the structural arrangement of the trabecular structure, paralleling the results of the fabric calculations.
Figure 5.
Individual Young’s moduli (E11, E22, E33) relative to (BV/TV)α for posterior (a), lateral (b), and medial-anterior (c) sub-volumes from the specimen images (see Figure 1b for subvolume locations).
Table 2 lists coefficients of determination of all nine elastic constants (individually and pooled) from BV/TV in specimen and in vivo images. Linear models were used for fitting in vivo measures Eii and Gij to bone volume fraction because of the much smaller range in the in vivo TB sub-volumes, yielding generally weaker correlations than did the specimen data (Table 2). With the exception of shear moduli, pooled constants were not significantly predicted by BV/TV.
Table 2.
Dependence of μFE-derived elastic constants (GPa) on BV/TV (%)
| Specimen | In vivo | |||||||
|---|---|---|---|---|---|---|---|---|
| BV/TV | BV/TV Pooled | BV/TV | BV/TV Pooled | |||||
| Model | R2 | Model | R2 | Model | R2 | Model | R2 | |
| E11 | 0.0061x1.7 | 0.94* | 0.0115x1.6 | 0.74* | 0.022x+0.21 | 0.08 | 0.054x+0.037 | 0.08 |
| E22 | 0.0075x1.6 | 0.91* | 0.074x−0.22 | 0.54* | ||||
| E33 | 0.0322x1.4 | 0.98* | 0.065x+0.12 | 0.61* | ||||
|
| ||||||||
| G12 | 0.0051x1.5 | 0.96* | 0.0061x1.5 | 0.92* | 0.021x−0.0033 | 0.78* | 0.026x−0.024 | 0.32* |
| G13 | 0.0076x1.4 | 0.95* | 0.020x+0.035 | 0.36* | ||||
| G23 | 0.0077x1.5 | 0.95* | 0.036x−0.10 | 0.71* | ||||
|
| ||||||||
| ν12 | −0.0003x+0.28 | 0.002 | 0.0018+0.16 | 0.03* | −0.012x+0.35 | 0.11 | 0.0006x+0.19 | 0.00 |
| ν13 | 0.0029x+0.10 | 0.42* | 0.00046x+0.15 | 0.00 | ||||
| ν23 | 0.0027x+0.10 | 0.35* | 0.0096x+0.072 | 0.14 | ||||
indicates significance (p<0.05)
Goodness-of-fit (R2) for the models incorporating fabric is plotted in Figure 6 as a function of exponent α. An optimum R2 relative to the combined elastic constants was found for α=1.5. Table 3 summarizes the model predictions for the pooled μFE-computed elastic constants by (BV/TV)1.5 and fabric measures.
Figure 6.
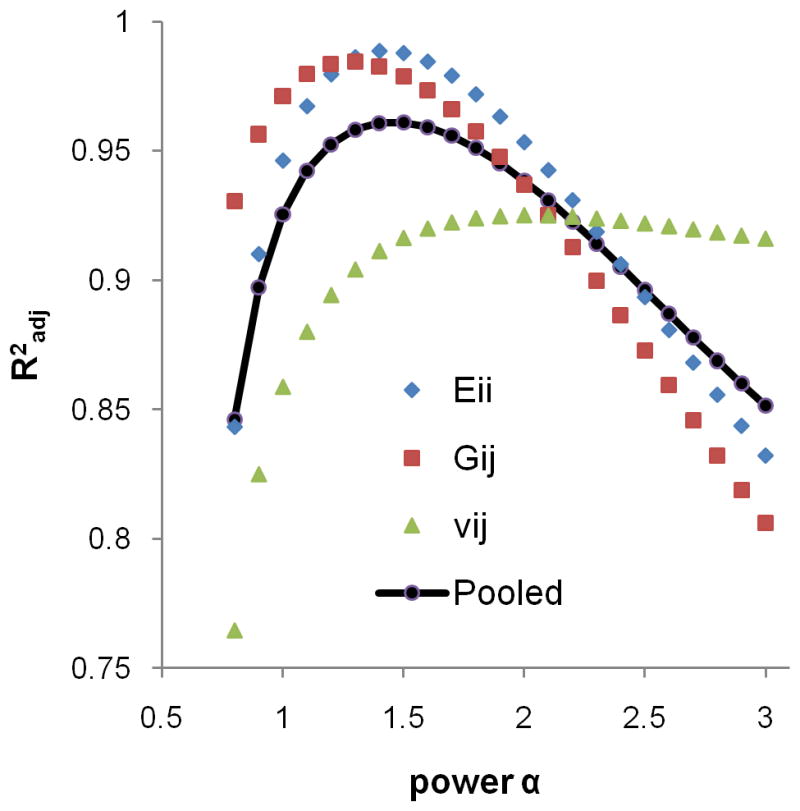
Dependence of goodness-of-fit parameter (R2adj) on α in Eq. [5] for Eii, Gij, vij, and all 9 mechanical constants pooled. Average R2 for the nine mechanical constants was maximum for α=1.5.
Table 3.
Correlations between μFE- and model-derived (BV/TV1.5 and H) mechanical constants (GPa)
| Specimen | In vivo | Specimen/In vivo | ||||
|---|---|---|---|---|---|---|
| Model | R2adj | Model | R2adj | Model | R2adj | |
| Eii | y=0.91x+0.118 | 0.975*† | y=1.01x−0.0593 | 0.928*† | y=1.05x+0.0371 | 0.884*† |
|
| ||||||
| Gij | y=0.86x+0.0528 | 0.957*† | y=0.96x+0.0148 | 0.810*† | y=0.91x+0.0434 | 0.706*† |
|
| ||||||
| νij | y=0.69x−0.0536 | 0.842*† | y=1.30x−0.0502 | 0.735*† | y=1.35x−0.00365 | 0.700*† |
indicates significance (p<0.05),
indicates R2 is significantly different from R2 of BV/TV-only model in Table 2
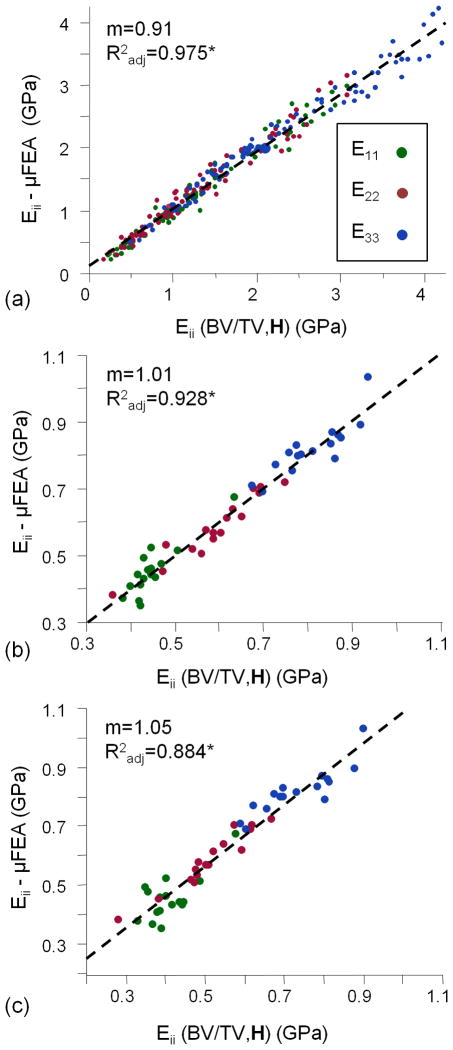
Figure 7 plots μFE-computed elastic moduli for both specimen and in vivo data versus those predicted on the basis of the model considering bone volume fraction and fabric (Eq. [5], using α=1.5). This model predicts the elastic moduli very well, regardless of loading direction for both the specimen and in vivo data sets (Radj2=0.975 and 0.928, respectively). In addition, in vivo μFE-derived elastic constants are well predicted (Radj2=0.884) by the model derived using the specimen data (see Figure 7c and far right column of Table 3).
Figure 7.
Pooled fits of μFE-derived and predicted Eii from Figure 3a (α=1.5) for specimen (a) and in vivo images (b&c). In (a), Eii(BV/TV, H) is derived using the specimen data while that of (b) is based solely on in vivo data. In (c), Eii(BV/TV, H) represents the model developed in (a) applied to measurements of BV/TV, H2 , and Eii - from the in vivo images. Slopes (m) and Radj correspond to dashed-line fits between μFE-derived and model-predicted Eii values.
Lastly, Table 4 lists compressive and shear moduli for the two in vivo sub-groups. Except for one (E11) all compressive and shear moduli were lower in the postmenopausal sub-group. These differences were significant for E22, G12 and G23 (p<0.05 to <0.0005) for both μFE and model-derived parameters. The difference in moduli was supported by lower BV/TV in the post-menopausal sub-group, 9.52±0.95 % versus 11.3±0.73 % (p<0.05), however, the mechanical parameters were stronger group differentiators.
Table 4.
Comparison of elastic constants derived from in vivo MR images in healthy young subjects and postmenopausal osteoporotic patients
| μFE | (BV/TV)1.5, H | |||
|---|---|---|---|---|
|
| ||||
| Y | PM | Y | PM | |
| E11 | 0.42±0.055 | 0.48±0.086 | 0.44±0.034 | 0.46±0.071 |
| E22 | 0.66±0.057** | 0.52±0.074 | 0.67±0.058** | 0.53±0.085 |
| E33 | 0.83±0.068 | 0.81±0.091 | 0.84±0.073 | 0.79±0.076 |
|
| ||||
| G12 | 0.24±0.21* | 0.21±0.019 | 0.23±0.014* | 0.20±0.018 |
| G13 | 0.25±0.036 | 0.25±0.033 | 0.26±0.020 | 0.25±0.031 |
| G23 | 0.33±0.20**** | 0.26±0.029 | 0.31±0.022*** | 0.27±0.022 |
p<0.05,
p<0.01,
p<0.005,
p<0.0005
Discussion
This study investigated the relationship between morphology and finite-element derived elastic moduli in μMR images of TB subvolumes from the distal tibia both in specimen images acquired under in vivo scanning conditions and in vivo in a small cohort of human subjects. Elastic constants derived from μMRI are comparable in magnitude to values reported by other investigators, including data obtained by direct mechanical testing of samples from the proximal tibia (elastic moduli range: 10–1500 MPa) (35) and elastic constants determined from μFE analysis of HR-pQCT images of the distal tibia (mean elastic modulus: 720±297 MPa) (1). Our results show that variations in μFE-derived elastic constants associated with anatomical location and test direction were not adequately explained by bone volume fraction in either the specimen or in vivo data, exhibiting a strong regional and test-direction dependence. These findings agree with previous studies conducted on the basis of high-resolution μCT imaging evaluating the relationship between morphological measures and elasticity (2–4,36).
When including the MIL-derived fabric tensor information via Cowin’s model of orthotropic materials, the nine orthotropic μFE-calculated elastic constants could be predicted with high coefficients of determination (mean R2adj: 0.92 in specimen, 0.82 in vivo) independent of sub-volume location and test direction. Additionally, the model-predicted elastic properties were found to distinguish post-menopausal women with reduced bone mass from younger healthy subjects with significance levels similar to those achieved by μFE modeling.
The dependence of the orthotropic elastic constants on volume fraction and fabric has previously been shown in high-resolution reconstructions of TB specimen image data (R2adj ranging from 0.88 to 0.99) (13,35,36). However, until now, the validity of Cowin’s model had not been demonstrated on the basis of in vivo images.
The 18 empirically determined model parameters did not appear to change substantially with input images from the same anatomical location, as evidenced by their ability to predict elastic constants derived from in vivo images using the specimen-derived model parameters. This result suggests the possibility of developing a model on the basis of a large set of specimen datasets, potentially in concert with mechanical experiments, and then applying the model to structural measures assessed from images acquired in vivo to predict bone mechanical properties in patients. This finding is of particular relevance considering the spread in BV/TV values and moduli between specimen and in vivo images.
The difference in mean bone volume fraction (and thereby elastic moduli) found between specimen and in vivo data is somewhat surprising and demands some scrutiny. One possible reason is that spin dephasing at trabecular bone boundaries caused by the susceptibility difference between the slightly paramagnetic fixing solution and diamagnetic bone is likely to inflate BV/TV values in the specimens relative to values obtained in vivo (37) (since the bone-fixing solution susceptibility difference is greater than that between bone and marrow).
The validity of Cowin’s model for the current data is particularly noteworthy. The degree to which TB complies with the notion of orthotropic symmetry was evaluated in terms of the orthotropic error ε (see Eq. [3]). Forcing orthotropic symmetry was associated with a ~17% error in the calculated elastic constants. This error is considerably larger than the 6% error found in μCT images of (4mm)3 TB specimens from seven distinct human metaphyseal locations by Zysset et al (35). One explanation for the relatively large mean error in the present work is the proximity of the TB subvolumes to the cortical boundary where the structural, and thus the mechanical environment, is expectedly more heterogeneous. Trabecular bone subvolumes used in Zysset et al’s work were likely extracted from more centrally located regions of the skeleton where the architecture is more homogeneous. Deviations from orthotropic symmetry also impact the degree of alignment between fabric and orthotropic symmetry axes. The average offset angles Ωavg were 11.2° (specimen) and 9.2° (in vivo), data that are in excellent agreement with those found by Zysset et al (~11°) (35). Increasing angular offsets Ωavg were associated with increasing orthotropic error for specimen and in vivo data (see Figure 8). Therefore, the error in the orthotropic elastic constants and the model prediction were augmented by the degree to which the TB sub-volume adhered to orthotropic symmetry. This source of error was minimized by excluding TB sub-volumes with orthotropic errors greater than 4% (12). As mean errors in the measured Young’s (Shear) moduli of 9.5% (1.1%) were found for offset angles of 10° (38), it would have been necessary to exclude a substantial number of datasets from this study, as it was in Turner’s study, if utilizing such an extreme cut-off value. Instead, all datasets were retained at the expense of lower accuracy in the model prediction.
Figure 8.
Mean offset angle Ωavg and standard deviations relative to range in orthotropic error ε (%) (see Eq. [3]) for specimen (a) and in vivo (b) datasets. Numbers indicate the number of datasets falling into the associated range of ε.
The spatial variations in architecture, notably in terms of structural orientation and trabecular density between the three subvolumes examined (Figure 1), is substantial. Thus, inclusion of a larger volume (> 1–2 cm in width) would likely violate the condition of orthotropy and the underlying theory would be inapplicable. For this reason, prediction of mechanical parameters in terms of structural orientation are limited to relatively small volumes (subvolumes with sides ranging from 0.4 to 1cm), which may not be representative of the bone’s overall mechanical properties. Moreover, larger volumes are now readily amenable to image-based FE analysis. However, the method provides insight into the regional structural and mechanical make-up of the trabecular network. By decomposing the mechanical behavior of TB into contributions from volume fraction and fabric, its underlying causes can be inferred. For example, it is understood that structural anisotropy increases with age and osteoporosis, thereby rendering the bone more likely to fail due to buckling (see, for example (15)). Further, it has previously been shown that Cowin’s model parameters do not substantially differ for normal and osteoporotic bone on the basis of micro-computed tomography (39). It would therefore be of interest to examine these structural alterations during disease progression and treatment.
This work is, to the authors’ knowledge, the first application of Cowin’s model to images of the distal tibia acquired either under conditions matching those in vivo or actual images obtained in human subjects by μMRI. The data emphasize the role of fabric in bone mechanical properties, and that the relationship between fabric and mechanical constants can be assessed in the regime of limited resolution and SNR of high-resolution magnetic resonance. The findings should be equally relevant to other imaging modalities, notably HR-pQCT, that have similar point-spread function limited resolution.
Acknowledgments
The authors would like to acknowledge support from the National Institute of Health through NIH R01-AR41443, NIH RO1-AR53156, NIH R01-AR55647, and NIH F31-EB74482. We would also like to recognize members of the Bone Bioengineering laboratory at Columbia University for providing the distal tibia specimens.
References
- 1.MacNeil JA, Boyd SK. Load distribution and the predictive power of morphological indices in the distal radius and tibia by high resolution peripheral quantitative computed tomography. Bone. 2007;41(1):129–137. doi: 10.1016/j.bone.2007.02.029. [DOI] [PubMed] [Google Scholar]
- 2.Goulet RW, Goldstein SA, Ciarelli MJ, Kuhn JL, Brown MB, Feldkamp LA. The relationship between the structural and orthogonal compressive properties of trabecular bone. J Biomech. 1994;27(4):375–389. doi: 10.1016/0021-9290(94)90014-0. [DOI] [PubMed] [Google Scholar]
- 3.Goldstein SA. The mechanical properties of trabecular bone: dependence on anatomic location and function. J Biomech. 1987;20(11–12):1055–1061. doi: 10.1016/0021-9290(87)90023-6. [DOI] [PubMed] [Google Scholar]
- 4.Ulrich D, Hildebrand T, Van Rietbergen B, Muller R, Ruegsegger P. The quality of trabecular bone evaluated with micro-computed tomography, FEA and mechanical testing. Studies in health technology and informatics. 1997;40:97–112. [PubMed] [Google Scholar]
- 5.Siris ES, Brenneman SK, Barrett-Connor E, Miller PD, Sajjan S, Berger ML, Chen YT. The effect of age and bone mineral density on the absolute, excess, and relative risk of fracture in postmenopausal women aged 50–99: results from the National Osteoporosis Risk Assessment (NORA) Osteoporos Int. 2006;17(4):565–574. doi: 10.1007/s00198-005-0027-4. [DOI] [PubMed] [Google Scholar]
- 6.Schuit SC, van der Klift M, Weel AE, de Laet CE, Burger H, Seeman E, Hofman A, Uitterlinden AG, van Leeuwen JP, Pols HA, editors. Fracture incidence and association with bone mineral density in elderly men and women: the Rotterdam Study. Vol. 34. United States: 2004. pp. 195–202. [DOI] [PubMed] [Google Scholar]
- 7.Lucas GL, Cooke FW, Friis EA. A primer on biomechanics. 1. Vol. 1. Springer; 1999. Stress Shielding of Bone; pp. 80–90. [Google Scholar]
- 8.Whitehouse WJ. The quantitative morphology of anisotropic trabecular bone. J Microsc. 1974;101(Pt 2):153–168. doi: 10.1111/j.1365-2818.1974.tb03878.x. [DOI] [PubMed] [Google Scholar]
- 9.Harrigan TP, Mann RW. Characterization of microstructural anisotropy in orthotropic materials using a second-rank tensor. J Material Science. 1984;19:761–767. [Google Scholar]
- 10.Goldstein SA, Goulet R, McCubbrey D. Measurement and significance of three-dimensional architecture to the mechanical integrity of trabecular bone. Calcif Tissue Int. 1993;53(Suppl 1):S127–132. doi: 10.1007/BF01673421. discussion S132–123. [DOI] [PubMed] [Google Scholar]
- 11.Cowin SC. The relationship between the elasticity tensor and the fabric tensor. Journal of Mech Mater. 1985;4:137–147. doi: 10.1016/j.mechmat.2012.07.004. [DOI] [PMC free article] [PubMed] [Google Scholar]
- 12.Turner CH, Cowin SC, Rho JY, Ashman RB, Rice JC. The fabric dependence of the orthotropic elastic constants of cancellous bone. J Biomech. 1990;23(6):549–561. doi: 10.1016/0021-9290(90)90048-8. [DOI] [PubMed] [Google Scholar]
- 13.Van Rietbergen B, Odgaard A, Kabel J, Huiskes R. Relationships between bone morphology and bone elastic properties can be accurately quantified using high-resolution computer reconstructions. J Orthop Res. 1998;16(1):23–28. doi: 10.1002/jor.1100160105. [DOI] [PubMed] [Google Scholar]
- 14.Oden ZM, Selvitelli DM, Hayes WC, Myers ER. The effect of trabecular structure on DXA-based predictions of bovine bone failure. Calcif Tissue Int. 1998;63(1):67–73. doi: 10.1007/s002239900491. [DOI] [PubMed] [Google Scholar]
- 15.Ciarelli TE, Fyhrie DP, Schaffler MB, Goldstein SA. Variations in three-dimensional cancellous bone architecture of the proximal femur in female hip fractures and in controls. J Bone Miner Res. 2000;15(1):32–40. doi: 10.1359/jbmr.2000.15.1.32. [DOI] [PubMed] [Google Scholar]
- 16.Boutroy S, Bouxsein ML, Munoz F, Delmas PD. In vivo assessment of trabecular bone microarchitecture by high-resolution peripheral quantitative computed tomography. J Clin Endocrinol Metab. 2005;90(12):6508–6515. doi: 10.1210/jc.2005-1258. [DOI] [PubMed] [Google Scholar]
- 17.Kazakia GJ, Hyun B, Burghardt AJ, Krug R, Newitt DC, de Papp AE, Link TM, Majumdar S. In vivo determination of bone structure in postmenopausal women: a comparison of HR-pQCT and high-field MR imaging. J Bone Miner Res. 2008;23(4):463–474. doi: 10.1359/jbmr.071116. [DOI] [PubMed] [Google Scholar]
- 18.Wehrli FW, Song HK, Saha PK, Wright AC. Quantitative MRI for the assessment of bone structure and function. NMR Biomed. 2006;19(7):731–764. doi: 10.1002/nbm.1066. [DOI] [PubMed] [Google Scholar]
- 19.Link TM. High-resolution magnetic resonance imaging to assess trabecular bone structure in patients after transplantation: a review. Topics in magnetic resonance imaging : TMRI. 2002;13(5):365–375. doi: 10.1097/00002142-200210000-00007. [DOI] [PubMed] [Google Scholar]
- 20.Zhang XH, Liu XS, Vasilic B, Wehrli FW, Benito M, Rajapakse CS, Snyder PJ, Guo XE. In vivo microMRI-based finite element and morphological analyses of tibial trabecular bone in eugonadal and hypogonadal men before and after testosterone treatment. J Bone Miner Res. 2008;23(9):1426–1434. doi: 10.1359/JBMR.080405. [DOI] [PMC free article] [PubMed] [Google Scholar]
- 21.Rajapakse CS, Magland JF, Wald MJ, Liu XS, Zhang XH, Guo XE, Wehrli FW. Computational biomechanics of the distal tibia from high-resolution MR and micro-CT images. Bone. 2010;47:556–563. doi: 10.1016/j.bone.2010.05.039. [DOI] [PMC free article] [PubMed] [Google Scholar]
- 22.Liu XS, Walker MD, McMahon DJ, Udesky J, Liu G, Bilezikian JP, Guo XE. Better skeletal microstructure confers greater mechanical advantages in Chinese-American women versus Caucasian women. Journal of bone and mineral research : the official journal of the American Society for Bone and Mineral Research. 2011 doi: 10.1002/jbmr.378. In Press (electronic available) [DOI] [PMC free article] [PubMed] [Google Scholar]
- 23.Kabel J, van Rietbergen B, Dalstra M, Odgaard A, Huiskes R. The role of an effective isotropic tissue modulus in the elastic properties of cancellous bone. J Biomech. 1999;32(7):673–680. doi: 10.1016/s0021-9290(99)00045-7. [DOI] [PubMed] [Google Scholar]
- 24.Wald MJ, Magland JF, Rajapakse CS, Wehrli FW. Structural and mechanical parameters of trabecular bone estimated from in vivo high-resolution magnetic resonance images at 3 tesla field strength. J Magn Reson Imaging. 2010;31(5):1157–1168. doi: 10.1002/jmri.22158. [DOI] [PMC free article] [PubMed] [Google Scholar]
- 25.Vasilic B, Wehrli FW. A novel local thresholding algorithm for trabecular bone volume fraction mapping in the limited spatial resolution regime of in vivo MRI. IEEE Trans Med Imaging. 2005;24(12):1574–1585. doi: 10.1109/TMI.2005.859192. [DOI] [PubMed] [Google Scholar]
- 26.Goldstein SA, Wilson DL, Sonstegard DA, Matthews LS. The mechanical properties of human tibial trabecular bone as a function of metaphyseal location. J Biomech. 1983;16(12):965–969. doi: 10.1016/0021-9290(83)90097-0. [DOI] [PubMed] [Google Scholar]
- 27.Saha PK, Wehrli FW. A robust method measuring trabecular bone orientation anisotropy at in vivo resolution by using tensor scale. Pattern Recognition. 2004;37:1935–1944. [Google Scholar]
- 28.Cowin SC. Wolff’s law of trabecular architecture at remodeling equilibrium. J Biomech Eng. 1986;108(1):83–88. doi: 10.1115/1.3138584. [DOI] [PubMed] [Google Scholar]
- 29.Van Rietbergen B, Odgaard A, Kabel J, Huiskes R. Direct mechanics assessment of elastic symmetries and properties of trabecular bone architecture. Journal of Biomechanics. 1996;29(12):1653–1657. doi: 10.1016/0021-9290(96)00093-0. [DOI] [PubMed] [Google Scholar]
- 30.Guo X, Goldstein S. Is trabecular bone tissue different from cortical bone. Forma. 1997;12:85–96. [Google Scholar]
- 31.Liu XS, Zhang XH, Sekhon KK, Adams MF, McMahon DJ, Bilezikian JP, Shane E, Guo XE. High-resolution peripheral quantitative computed tomography can assess microstructural and mechanical properties of human distal tibial bone. J Bone Miner Res. 2010;25(4):746–756. doi: 10.1359/jbmr.090822. [DOI] [PMC free article] [PubMed] [Google Scholar]
- 32.Carter DR, Hayes WC. The compressive behavior of bone as a two-phase porous structure. J Bone Joint Surg Am. 1977;59(7):954–962. [PubMed] [Google Scholar]
- 33.Currey JD. Power law models for the mechanical properties of cancellous bone. Eng Med. 1986;15(3):153–154. doi: 10.1243/emed_jour_1986_015_039_02. [DOI] [PubMed] [Google Scholar]
- 34.Keaveny TM, Borchers RE, Gibson LJ, Hayes WC. Theoretical analysis of the experimental artifact in trabecular bone compressive modulus. J Biomech. 1993;26(4–5):599–607. doi: 10.1016/0021-9290(93)90021-6. [DOI] [PubMed] [Google Scholar]
- 35.Zysset PK, Goulet RW, Hollister SJ. A global relationship between trabecular bone morphology and homogenized elastic properties. J Biomech Eng. 1998;120(5):640–646. doi: 10.1115/1.2834756. [DOI] [PubMed] [Google Scholar]
- 36.Kabel J, van Rietbergen B, Odgaard A, Huiskes R. Constitutive relationships of fabric, density, and elastic properties in cancellous bone architecture. Bone. 1999;25(4):481–486. doi: 10.1016/s8756-3282(99)00190-8. [DOI] [PubMed] [Google Scholar]
- 37.Techawiboonwong A, Song HK, Magland JF, Saha PK, Wehrli FW. Implications of pulse sequence in structural imaging of trabecular bone. J Magn Reson Imaging. 2005;22(5):647–655. doi: 10.1002/jmri.20432. [DOI] [PubMed] [Google Scholar]
- 38.Turner CH, Cowin SC. Errors induced by off-axis measurement of the elastic properties of bone. J Biomech Eng. 1988;110(3):213–215. doi: 10.1115/1.3108433. [DOI] [PubMed] [Google Scholar]
- 39.Homminga J, McCreadie BR, Weinans H, Huiskes R. The dependence of the elastic properties of osteoporotic cancellous bone on volume fraction and fabric. J Biomech. 2003;36(10):1461–1467. doi: 10.1016/s0021-9290(03)00125-8. [DOI] [PubMed] [Google Scholar]


