Abstract
The loopless antenna MRI detector is comprised of a tuned coaxial cable with an extended central conductor that can be fabricated at sub-millimeter diameters for inteventional use in guidewires, catheters or needles. Prior work up to 4.7T suggests a near-quadratic gain in signal-to-noise ratio (SNR) with field strength, and safe operation at 3T. Here for the first time, the SNR performance and RF safety of the loopless antenna is investigated both theoretically, using the electro-magnetic method-of-moments, and experimentally in a standard 7T human scanner. The results are compared with equivalent 3T devices. An absolute SNR gain of 5.7±1.5-fold was realized at 7T vs. 3T: more than 20-fold higher than at 1.5T. The effective field-of-view (FOV) area also increased approximately 10-fold compared to 3T. Testing in a saline gel phantom suggested safe operation is possible with maximum local 1-g average specific absorption rates of <12W/kg and temperature increases of <1.9°C, normalized to a 4W/kg RF field exposure at 7T. The antenna did not affect the power applied to the scanner's transmit coil. The SNR gain enabled MRI microscopy at 40-50μm resolution in diseased human arterial specimens, offering the potential of high-resolution large-FOV or endoscopic MRI for targeted intervention in focal disease.
Keywords: 7 Tesla, Interventional MRI, high-resolution, signal-to-noise ratio, MRI detectors
Introduction
Interventional magnetic resonance imaging (MRI) combines the multi-functionality and inherently high soft-tissue contrast of MRI, for targeting therapy and monitoring response without using ionizing radiation. The increasing availability of ultra high-field (UHF) whole-body MRI systems (B0>3T) that promise higher signal-to-noise ratios (SNR) (1,2), raises the question of whether interventional UHF MRI is advantageous, feasible, or even safe in these systems. Indeed, because the wavelength of the transverse radio frequency (RF) field is comparable to the body size, the problems of sample resonances, inhomogeneous excitation fields (3), highly localized specific absorption rates (SAR) and heating (4-6), are exacerbated when interventional devices are introduced. At 7T, the feasibility and safety of prostate imaging with receive-only (7) and transmit/receive endo-rectal loop coils modified from commercial 3T endo-rectal coils was only recently demonstrated in vivo in humans (7-9), and the relative SNR advantages compared to lower-field devices remain to be seen. Even so, with a 3.5 cm diameter these internal coils are not suitable for intra-vascular or interstitial use.
The “loopless antenna” MRI detector can be fabricated with sub-millimeter diameters, and therefore is suitable for intravascular use as a guidewire, catheter (10), or for incorporation into a biopsy or therapy-delivery needle (11). It consists of a thin coaxial cable with an inner conductor extended to form a resonant whip at the MRI frequency. It has a high sensitivity in the near-field, which may be improved by modifying the insulation (12,13), and which decreases with the inverse of radial distance (ρ) from the device (14). In the past, loopless antenna detectors working at B0≤1.5T have been used in angioplasty procedures (15-17), for atherosclerotic plaque characterization (18) and for tumor detection (19). Because the signal strength increases with B02 while the noise for miniaturized coils is dominated by the direct electric (E-)field which for the loopless antenna does not vary significantly with B0, the SNR of the loopless antenna increases approximately as B02 (20). This has been experimentally verified up to B0=4.7T (20). If this SNR response were sustained up to B0=7T, an SNR advantage of approximately 5.4-fold would accrue relative to 3T. Moreover, compared to the prior 1.5T work, a 7T SNR advantage of over 20-fold would be anticipated.
Here, the feasibility of performing MRI with the interventional loopless antenna detector at UHF is investigated at 7T and compared with the performance at 3T. Its theoretical SNR is determined by numerical electromagnetic (EM) method-of-moments (MoM) analysis at 7T and at 3T, and by direct experimental measurements on devices fabricated with the same geometry in an electrically bio-analogous phantom. Safety at 7T is investigated with numerical three-dimensional (3D) full-wave EM computations of the local specific absorption rate (SAR), and by direct temperature measurements in an RF shielded room with the transmit volume MRI coil driven from a directly monitored source. Finally, we present high-resolution (40-80 μm) 7T and 3T images of human carotid artery specimens loaded in a saline phantom, for SNR comparison. At these voxel sizes, the spatial resolution is about 10-fold higher than previous 3T intravascular MRI (20-22).
Materials and Methods
Theoretical SNR computation
Numerical EM analysis of SNR and SAR were performed using a 3D full-wave EM MoM simulator (FEKO EM analysis software, Stellenbosch, South Africa) similar to previous studies(23,24). The loopless antenna was modeled as a quarter wave-length (λc/4; 17cm at 7T, 40cm at 3T) coaxial cable terminating with its inner conductor extended to form a 33mm (7T) or 39mm (3T) resonant whip. The antenna was excited by a unit amplitude current source applied to the whip-cable junction at a frequency of 298MHz (7T) or 128MHz (3T). Conducting surfaces were modeled as perfect electric conductor (PEC). Saline was modeled as an infinite medium with conductivity σ=0.63S/m and dielectric constant ε=80, which are comparable to human muscle at 298 and 128 MHz. The RF magnetic field distribution was computed at 0.2mm intervals up to 10cm from the whip-cable junction in the transaxial plane, and 20cm along the long axis extending 8cm distally from the junction. The absolute SNR in ml-1Hz1/2, Ψs, under fully relaxed conditions was determined from:
| [1] |
where M0=3.2692×10⁻⁹ B0JT-1ml-1 is the equilibrium nuclear magnetization per unit volume for water at 22°C, |B+| is the magnitude of circularly polarized transverse magnetic field generated by the unit current applied to the antenna, K is Boltzmann's constant, T is the temperature at the whip in Kelvin. With the antenna aligned parallel to B0, where Bθ is the cylindrical polar RF field component. Rload, is the computed load resistance at the junction. At 7T, a cable loss of 0.32dB/m for the experimental UT-85C cable was added.
SAR analysis
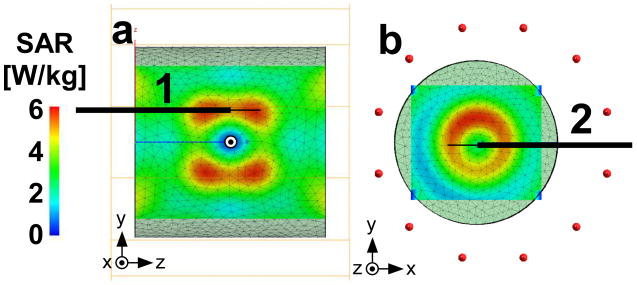
The SAR distribution in a 20-cm long by 20-cm diameter cylindrical head-sized phantom filled with homogenous saline (σ=0.63 S/m, ε=80), was determined from the induced electric fields with the sample at iso-center of a quadrature cylindrical 7T head transmit coil of the same geometry as a Nova Medical, Inc, (Wilmington, MA) head coil. The coil was modeled with twelve 25 cm-long equally spaced struts connected to two circular 29cm-diameter PEC end rings, and excited by unit current applied with 30° phase shifts to each adjacent strut to create the rotating field at the 7T MRI frequency. A reference SAR simulation was performed at 7T with the antenna removed to determine the locations of maximum SAR exposure (Fig. 1.a-b) for subsequent antenna placement. Accordingly the device was positioned with long axis 3 cm above and parallel to the phantom's cylindrical axis and the z-axis of the scanner (Geometry 1; Fig. 1), at insertion depths of 35 and 100 mm. A second trans-axial configuration with the lead intersecting two high SAR regions was also investigated (Geometry 2; Fig. 1). In Geometry 2, the lead was parallel to the x-axis, 3cm off-center, at an insertion depth 100mm. The phantom in this case was 2cm off iso-center to accommodate the proximal end of the device. For SAR, the loopless antenna was modeled the same as for the SNR computations, but with the current source removed from the junction and with the proximal end of the coaxial cable electrically shorted to simulate the effect of decoupling circuitry.
Figure 1.
(a) SAR distribution in a saline cylindrical phantom in sagittal (x=0cm), and (b) axial (z=3cm) plane with the horizontal solid line showing the placement of the device for safety testing in Geometries 1 and 2 respectively. The origin is the iso-center of the phantom in both geometries.
For numerical analysis, the triangular mesh size was 0.5mm in a 6-cm rectangular prism centered on the antenna. This was gradually coarsened away from the antenna to a maximum of 12mm near the edge of the phantom to conserve computation time. All mesh lengths were shorter than the maximum of λ/12 suggested by FEKO. Reference SAR simulations were performed at 7T and 3T with the antenna absent, using identical grid locations and the same power applied to the coil. The 3D volume E-field data was imported to MatLab (Mathworks, Inc, Natick, MA) and the SAR distribution at each point (x,y,z) calculated as:
| [2] |
where ρ (in kg/m3) is the density of the saline, and EX, EY, and EZ (in V/m), are the electric field components at (x,y,z). The sampling resolution or point size corresponds to 1.25×10⁻⁴g of saline. The 1-g average SAR data, was obtained by averaging all pixels within a 1×1×1cm3 cube centered at (x,y,z). The result was divided pixel-by-pixel with the reference simulation to obtain an SAR amplification factor. This was multiplied by 4 to provide a local SAR map at an applied SAR exposure of 4 W/kg.
Experimental Devices
Experimental 3T and 7T loopless antennae were fabricated from UT-85C semi-rigid coaxial cable (Micro-coax, Inc., Pottstown, PA) with a resonant whip length and λc/4 cable optimized in saline with a spectrum analyzer(20). At 7T, the cable length was 17cm and the whip length was 32mm, in agreement with the simulations. The end of the λc/4 cable was connected to a solenoidal balun to block common-mode signals(25), and an interface box for decoupling and matching. The decoupling circuit (Fig. 2) employs a diode shorted during RF transmission by a decoupling bias applied by the scanner to isolate the antenna from the receiver chain. During signal reception the bias is turned-off, and the MRI signal from the whip is conducted to the MRI scanner via an additional bazooka balun and λ/4 cable to further minimize currents on the outer conductor (Fig. 2). Antennae were matched to 50Ω in saline. The combined measured isolation of the common mode achieved by the baluns was 37dB at 7T and 43dB at 3T.
Figure 2.
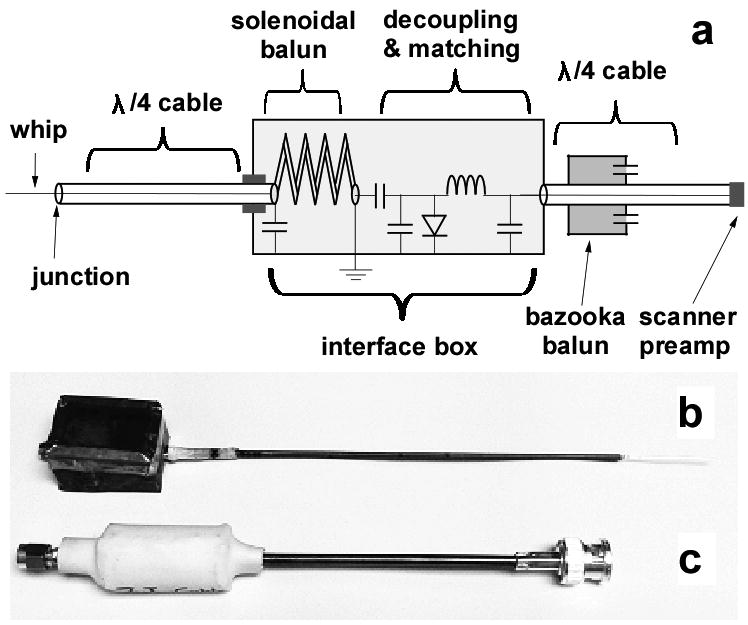
(a) Circuit diagram of the loopless antenna with baluns, decoupling and matching circuitry. (b) Pictures of the 7T loopless antenna, and (c) the quarter-wave length cable with balun (c).
Experimental SNR
A 20-cm long by 20-cm external diameter cylindrical saline phantom (wall thickness, 3.2mm) was prepared for SNR measurements using 3.35 g/l salt and 0.5 g/l CuS04 to achieve the requisite electrical properties (σ =0.63 S/m; ε =80) (26). The CuS04 reduced the spin-lattice relaxation time to ∼0.5s at both field strengths. 7T SNR measurements were done on a Philips Achieva 7T MRI scanner (Philips Medical Systems, Cleveland, OH), using the Nova Medical head coil for RF transmission and with the antenna connected to one of the 32 receiver channels and the other 31 channels terminated with 50Ω. The device was inserted in the saline phantom oriented parallel to the main magnetic field, and axial MRI performed at the antenna junction using a fully-relaxed gradient-echo sequence (echo-time, TE=11.5ms; repetition period, TR=2s; bandwidth, BW=125.4kHz; excitations per frame, NEX=1; field-of-view, FOV=20cm; slice thickness=3mm; acquisition matrix Nx×Ny =1000×1000; scan duration=33.3min). A “Spredrex” RF sinc-pulse with a high time-bandwidth product truncated after the main lobe was used to reduce errors in the calculated B1+ map (27), and the scan repeated with different excitation flip angles (α) to permit correction for RF field inhomogeneity. The 3T antenna was tested in the same saline phantom and orientation as at 7T, in a Philips 3T XMR Achieva system. The same location at the antenna junction was scanned with an equivalent gradient-echo sequence using the Philips 3T body coil for transmission.
The fully-relaxed gradient-echo signal from a pixel at location (x,y) in the plane of the junction is given by:
| [3] |
where S(x,y) is the sensitivity of the antenna at (x,y), RB (x,y) is ratio of the RF field distribution at (x,y) to the nominal RF field applied by the scanner (B1+) and α is the applied flip angle. The root-mean-square noise was measured from images acquired at 7T and 3T with the RF transmitter and MRI gradients turned-off. S(x,y) and RB (x,y) were determined at every pixel from the images acquired with different flip-angles using a least-squares fit. The absolute measured SNR in ml-1Hz1/2 was computed using (20):
| [4] |
where Vpixel is the pixel volume in ml and NF is the noise figure of the RF receiver chain measured by the cold 50Ω resistor method (28) in both systems (0.97dB @7T, 0.94dB @3T).
RF safety testing
The RF power provided by the 7T scanner failed to produce a sufficient temperature increase under either control or antenna-loaded conditions to enable reliable documentation of device safety. Therefore heat testing was performed inside an RF shielded room with the 7T Nova Medical quadrature transmit head coil driven by a continuous wave (CW) RF power amplifier (Tomco Inc, BT00250, Stepney SA, Australia) connected to a 298MHz frequency synthesizer. The experimental setup is shown in Fig. 3. The RF power was continuously monitored during experiments with a commercial RF power meter (LadyBug Technologies, Santa Rosa, CA). This bench setup allowed heat testing at higher RF power levels than provided by the scanner, and better experimental control and monitoring of input power, without occupying valuable scanner time for a non-imaging study.
Figure 3.
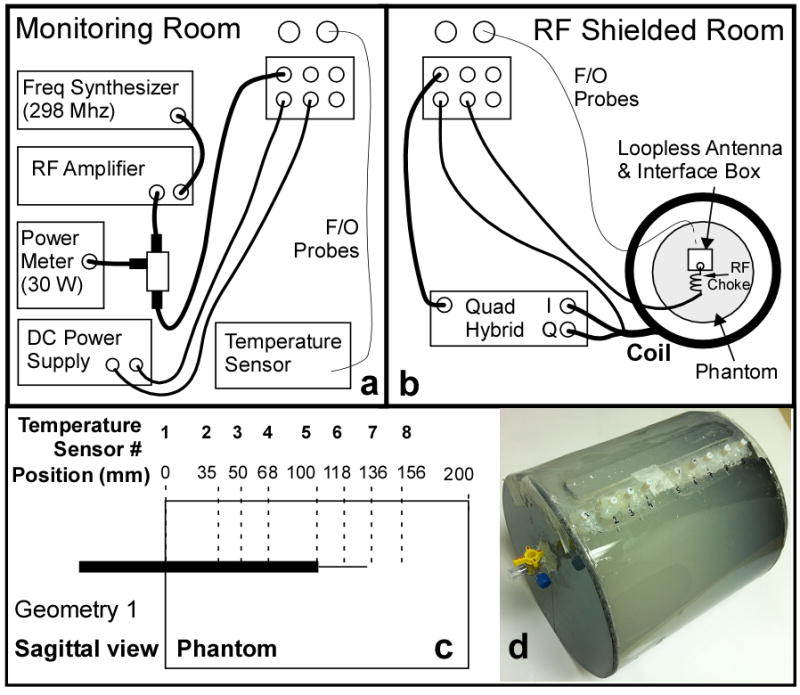
Schematic of the heat testing setup at 7T. (a) RF components and temperature recording devices are placed in the monitoring room. (b) The coil, the experimental phantom with the loopless antenna and fiber-optic temperature probes, and the transmit coil are located inside the RF shielded room. (c) Schematic of the heating phantom showing the locations of the thermal probes (dotted lines). Insertion depth of 100mm in Geometry 1 is shown. (d) Picture of the actual phantom.
Heat testing was performed on the 20cm cylindrical phantom filled with saline possessing similar electrical properties as in the SAR computations, but with slush added to limit convection (15g/l polyacrylic acid, 0.8g/l salt). Device heating in the same configurations (Geometries 1, 2; Fig. 1) as simulated, was measured with four fiber-optic temperature sensors (Neoptix, Inc, Quebec, Canada) placed next to the antenna inside the phantom. These were accessed via 8 holes on the face of the phantom (Fig. 3.c-d). Decoupling bias was provided via a DC power supply. The temperature was sampled at 1Hz for 31min: (i) with the RF power turned-off for the first minute, as baseline; (ii) with the RF turned-on for 15min at 30W; and (iii) with the RF turned-off for 15min during cool-down. Temperatures recorded at the 8 sensor locations in the absence of the antenna were used as a reference to define the local SAR exposure, assuming:
| [5] |
which neglects the effects of perfusion and diffusion. Here, Csaline=4180 J/kg/°C is the heat capacity of the saline, and ΔT (°C) is the temperature rise during Δt (sec).
We report reference ΔT, ΔT with the antenna present at both insertion depths, the reference local SAR from Eq. (5), and the local temperature in the presence of the antenna normalized for a 4W/kg exposure as scaled using the reference SAR measurement. Unlike the reference SAR distribution, local SAR in the vicinity of conducting leads can potentially be highly nonuniform (23,24). Because the precise spatial sensitivity of the thermal probes is uncertain, for purposes of comparing experimental thermally-derived local SAR with the computed 1-g local SAR, values are reported within a spatial ±0.5cm error cube.
Imaging vascular specimens
To compare the imaging performance of 7T and 3T loopless antennae, high resolution axial MRI was performed on human carotid artery specimens harvested from decedents in a study approved by this institution's Office of Human Subject Research Institutional Review Board. Specimens and detectors were positioned at the center of a 6cm diameter 12cm long phantom, and immersed in 3.5g/l saline. Comparable 10-slice 3D high-resolution (80×80μm×1mm) balanced steady-state free-precession (b-SSFP) pulse sequences were applied at both B0 values (7T: TR/TE=34/17ms, FOV=70×70 mm, scan duration=13.3min; 3T: TR/TE=38/19ms, FOV=30×30mm, scan duration=13.1min). Spin-spin relaxation (T2)-weighted MRI was performed with turbo spin-echo (TSE) sequences. For SNR comparisons, TSE images with 80×80μm ×1mm voxel sizes were acquired at 7T and 3T (1mm slices, TR/TE=1500/32ms, echo train length ETL=12, FOV=60×60 mm, BW=69.9 and 65.6Hz respectively). Higher resolution (40 and 53μm in-plane) TSE images were also acquired at 7T (1mm slices, TR=1.5s, TE=32 and 40 ms, FOV=60×60 mm, ETL = 14 and 12, BW = 66.7 and 88.3 kHz for 40 and 53μm resolution, respectively). For display, images are scaled by the radial distance ρ from the antenna, to compensate for the sensitivity of the device (14).
Results
Computed SNR and SAR
The computed SNR is represented by the solid black contours in Fig. 4(a-d). In the axial plane at the junction, the diameter of the 50,000 ml-1Hz1/2 SNR contour at 7T is 3.2-times larger than the same contour at 3T, representing a 10-fold increase in effective FOV area of the device. Along the long axis, the area enclosed by the 50,000 ml-1Hz1/2 contour is 4-times higher at 7T vs 3T, leading to a 13-fold increase in the total effective FOV volume. The new SNR calculations at 1cm from the junction are combined with prior data from lower fields (20) and plotted as a function of B0 in Fig. 5. The new data demonstrate that the quadratic B0 dependence of SNR observed at lower fields for the loopless antenna (20), extend to 7T.
Figure 4.
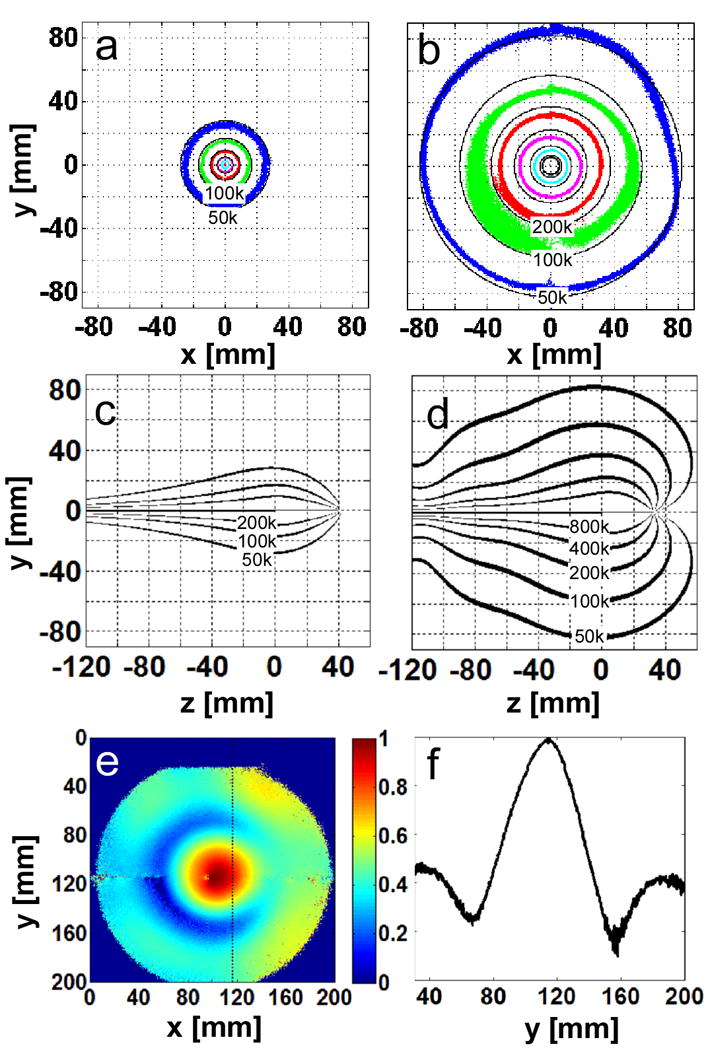
(a) Theoretical (solid, black) and experimental (colored) absolute SNR [ml-1 Hz1/2] on the axial whip junction plane of the λc/4 length loopless antennae in 0.35% saline at 3T, and (b) 7T. The experimental data are plotted with 10% tolerance. (blue, 50,000; green 100,000; red, 200,000; purple, 400,000; cyan, 800,000 ml-1 Hz1/2). Theoretical absolute SNR [ml-1 Hz1/2] along the long axis of the antenna is plotted in (c, 3T) and (d, 7T). (e) Axial B1+ map at the whip junction, and (f)B1+ profile along the dotted line in (e) at 7T. B1+ varies by ∼80%.
Figure 5.
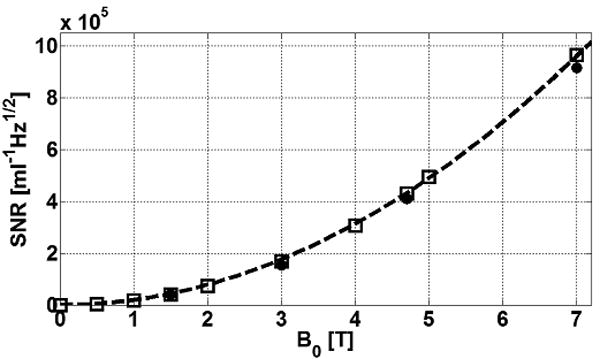
Absolute SNR (ml-1Hz1/2) computed by EM MoM (square points) at ρ=1cm from the junction of antennae made with λc/4 cable portions tuned at 0.5, 1, 1.5, 2, 3, 4, 4.7, 5 and 7T in 0.35% saline. Experimental values measured previously (20) at 1.5, 3 and 4.7 as well as our current 7T measurements are overlaid (solid circles). The data are fit to a quadratic curve (dotted line). Experimental data are corrected for system NF but include cable losses.
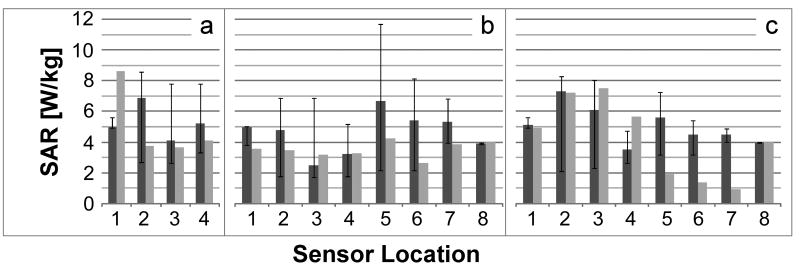
Fig. 6 shows the 1-g average SAR at 7T for the 2 geometries (Fig. 6a-c), and at 3T in Geometry 1 (Fig. 6d), normalized to a uniform 4W/kg applied RF exposure. The analysis predicts maximum local heating along the cable that, for Geometry 1, is at least no greater than 3T. The computed 1-g SAR at the same locations along the antenna where the temperature measurements were made, are plotted in Fig. 7. The maximum 1-g SAR is less than 12W/kg at 7T in all configurations.
Figure 6.
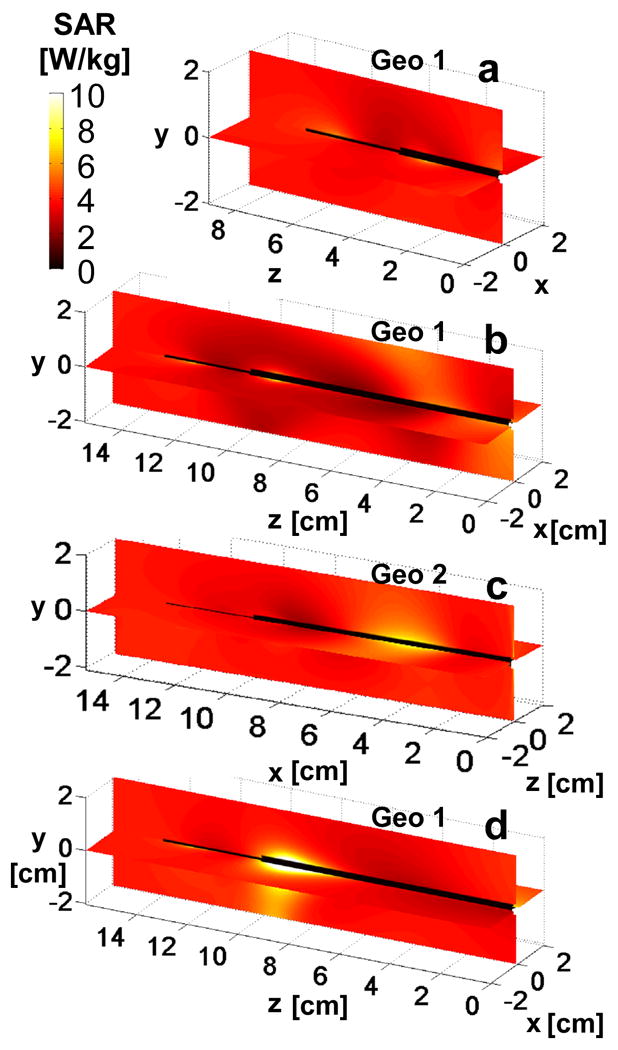
The computed 1-g average SAR normalized to 4W/kg applied local SAR is shown on the coronal and sagittal antenna planes at 7T for insertion depths of (a)35 mm, and (b,c)100 mm. Part (d) shows the SAR computation for 3T with a 100mm insertion depth. Part (c) is the distribution in geometry 2 and parts (a,b,d) are in geometry 1. Axes on (a-d) denote position in [cm].
Figure 7.
Computed (dark gray) and measured (light gray) local 1-g averaged SAR at 7T for geometry 1 at 35 (a), 100 (b) mm insertion depths, and for geometry 2 at 100mm insertion depth (c). Data are normalized to 4W/kg local reference SAR, with error bars denoting minimum and maximum within a ±0.5cm placement error cube.
Experimental SNR and safety testing
As shown in Fig. 4(e, f), the observed applied B1+ at 7T varies by ∼80% resulting in a 70% variation in measured signal over a ∼16cm diameter cylinder that approximates the effective FOV surrounding the antenna. This reduced the sensitivity of measurements at low-B1+ locations, even though images were acquired using 9 different flip-angles to compensate for the non-uniform B1+ via Eq. [3]. At 3T, the B1+-field variation was only ∼10% (∼1% variation in measured signal) over a 5cm diameter cylinder approximating this antenna's smaller FOV and imaging with multiple flip-angles did not compromise the sensitivity of the B1+-field measurements.
The B1-corrected experimental SNR data in the axial plane at the junction are plotted in Fig. 4(a,b). They overlap the theoretical contours. The effective antenna FOV defined by the area of the contours circumscribing the same SNR or higher in the axial plane, increases by a factor of 11.5 from 3T to 7T for regions with SNR >105 ml-1 Hz1/2 (green contours, Fig. 4a, b). The SNR improvement at 7T compared to 3T is 5.7±1.5 over the range 5 ≤ ρ ≤100 mm in the plane of the antenna junction, consistent with a quadratic (5.4-fold) SNR gain with B0. Scatter and deviations evident in the SNR data (Fig. 4b) are attributable to flip-angle variations that are not perfectly accounted for. The experimental SNR measurements at ρ=1cm for 3T and 7T are included in Fig. 5. These data are both consistent with, and extend empirically the prior SNR measurements at 1.5T, 3T and 4.7T that demonstrate a B02 dependence of SNR for the loopless antenna detector.
The raw experimental temperature measurements, and temperature change normalized for 4 W/kg exposure are listed in Table I. The observed temperature changes are all below 1°C, as recorded during the 15min RF exposure at an actual reference applied local SAR of 1.4-3.7W/kg. Normalization of the temperature change for a 4W/kg applied RF exposure, increases the projected temperature change to a maximum of 1.9°C at the insertion point. The experimental local 1-g average SAR determined from the temperature measurements is included in Fig. 7 for all configurations studied. The experimental and computed SAR are in reasonable agreement.
Table I.
Measured temperature increases (top), and temperature change normalized to 4W/kg local SAR exposure (bottom).
| Temperature Sensor Number | 1 | 2 | 3 | 4 | 5 | 6 | 7 | 8 |
|---|---|---|---|---|---|---|---|---|
| Temperature change (°C) during 15 min of RF exposure (raw measurements) | ||||||||
| Geometry 1, no probe | 0.2 | 0.6 | 0.7 | 0.7 | 0.5 | 0.7 | 0.5 | 0.4 |
| Geom. 1, 35 mm insertion | 0.5 | 0.6 | 0.7 | 0.7 | ||||
| Geom. 1, 100 mm insertion | 0.2 | 0.5 | 0.6 | 0.6 | 0.5 | 0.5 | 0.5 | 0.4 |
| Geometry 2, no probe | 0.3 | 0.3 | 0.2 | 0.2 | 0.5 | 0.3 | 0.4 | 0.4 |
| Geom. 2, 100 mm insertion | 0.3 | 0.5 | 0.5 | 0.3 | 0.3 | 0.1 | 0.1 | 0.4 |
| Temperature change (°C) in 15 min normalized to 4 W/kg reference (ΔT=0.86°C) | ||||||||
| Geom. 1, 35 mm insertion | 1.9 | 0.8 | 0.8 | 0.9 | ||||
| Geom. 1, 100 mm insertion | 0.8 | 0.8 | 0.7 | 0.7 | 0.9 | 0.6 | 0.8 | 0.9 |
| Geom. 2, 100 mm insertion | 1.1 | 1.6 | 1.6 | 1.2 | 0.4 | 0.3 | 0.2 | 0.9 |
High-resolution MRI
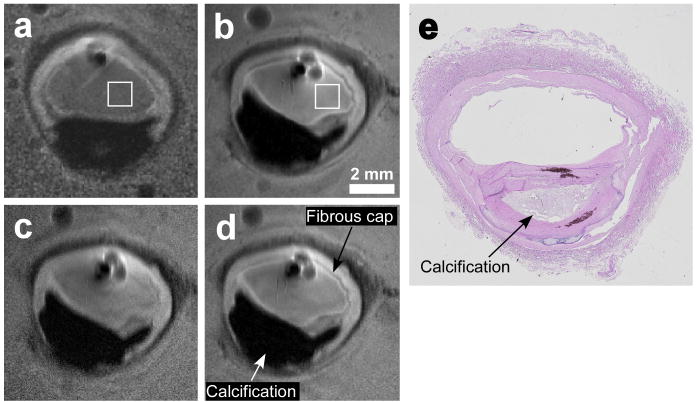
SSFP images of human carotid arteries are displayed in Fig. 8. Fine tissue structure is seen in both 3T and 7T images, but the superior SNR at 7T is evidenced by the lack of noise at the periphery. Banding artifacts due to B0 and B1+ inhomogenity (Fig. 8.a) limited the realization of better resolution at 7T using b-SSFP. This was not the case for TSE, where, as shown in Fig. 9, resolution was increased further to 40μm. Vessel wall, fibrous cap and calcifications confirmed by histology (Fig. 9.e), are seen in all images. In Fig. 9, the mean SNR advantage at 7T vs 3T for the 80μm images is 5.9 in the square annotated regions, and 5.0 at a radius of 1cm from the antenna junction, consistent with the theoretical and experimental analysis from the saline phantoms. The circular structures next to the antenna are bubbles in the media. Compared to the other 7T images, the contrast at 40μm resolution was limited by the longer TE of 40ms, the shortest allowed at this resolution by the scanner's maximum achievable gradient strength.
Figure 8.

(a) Full FOV, high-resolution SSFP image of a human carotid artery acquired at 7T with 80 μm in-plane resolution. (b) Same image with the central region expanded (dashed lines in Fig. 6.a) for comparison with (c), a 3T 80μm image from the same specimen using comparable acquisition parameters (position slightly shifted).
Figure 9.
High resolution TSE images of human carotid artery specimens in saline at 3T (a) and 7T (b-d). Slice thickness is 1 mm, in-plane resolution is 80 μm (a, b), 40 μm (c) and 53 μm (d). Histology result for the samples used at 7T images is shown in (e). 3T(a) and 7T(b) images are acquired with the same pulse sequence parameters except for a 6.5% increase in bandwidth at 7T due to system constraints. The mean SNR improvement inside the annotated squares in (b) is 5.85 compared to (a).
Discussion
We have for the first time, analyzed, built, safety-tested and demonstrated high-resolution MRI, from an interventional loopless MRI detector operating with a standard commercial 7T human MRI scanner. We have provided both analytical and experimental evaluations of its performance relative to an equivalent device at 3T, and moreover shown, both experimentally and theoretically, that its SNR performance increases quadratically up to 7T. This extends prior work showing a B02 dependence of SNR under optimal conditions on a 3T human scanner and a 4.7T animal system (20). This behavior is attributable to direct E-field losses which, unlike conventional head and body MRI, do not vary significantly with operating frequency (20). Thus, the noise level stays almost the same while the signal power increases as B02. The increase in SNR at 7T is accompanied by an approximately 10-fold gain in useful FOV area, defined here as the ratio of areas subtended by equal SNR contours at 7T and 3T. The SNR gain enabled–for the first time in a human-capable MRI system–the imaging of human vascular specimens at 40-50μm in-plane resolution. SSFP MRI sequences provided good contrast and high SNR at 3T, but at 7T, resolution below 80μm was compromised by banding artifacts. These may be ameliorated by increasing RF power–which in the present studies was well below regulatory guidelines–and bandwidth. Resolution with TSE is ultimately limited by the available gradient strength: about 40μm with TE=40ms in the present studies.
Comparisons of the experimental SNR performance of MRI detectors at different field strengths are often fraught with concerns of whether one is comparing best prototypes of a given design. This is addressed in conventional MRI with the concept of the “intrinsic SNR” (ISNR) which excludes E-field losses in the MRI coils (29). For the loopless antenna, the primary E-field losses are not in the conductor. This is evidenced by the agreement between the computed SNR which assumes that the antenna conductor has infinite conductivity, and the actual antenna which does not (Figs. 4,5). Instead, the E-field losses are primarily from conduction currents in the sample that extend between the whip and cable which effectively completes a “loop” circuit for the loopless antenna, and not those currents directly induced in the sample by the antenna's B1+. Except for the fact that the numerical computed SNR accounts fully for all of the E-field losses including these conduction losses in the sample, this theoretical SNR could be considered the ISNR because it is the maximum SNR that can be achieved for this specific antenna geometry and sample. To avoid confusion, we apply the term “design SNR” for this maximum computed SNR. The agreement between our experimental SNR measurements and the computed design SNR at both field strengths (Figs. 4, 5), supports the view that the quadratic SNR dependence is the best that can be done for this design, and moreover, that such performance is realizable.
With the higher SNR, our results suggest that the useful FOV of the loopless antenna can extend to ∼20 cm at 7T, which could potentially eliminate the need for additional coils for guiding or targeting the antenna, or indeed for performing MRI in general. Although the whip of the antenna is shorter at 7T, sensitivity of the antenna extends up to ∼1cm beyond the tip (Fig. 4d) and there is no reduction in the FOV area along the longitudinal direction of the antenna due to the shortened whip length, as compared to 3T. While the sensitivity of the antenna is inversely proportional to the radial distance (ρ) from the device and is therefore very nonuniform, B1+-inhomogeneity at 298MHz is a problem now shared by virtually all MRI detector designs (4) (Fig. 4e,f). For the loopless antenna, the profile does remain relatively immune to sample heterogeneity over a range of tissue electrical properties at 298 MHz. Use of the device for both transmit and receive would remove interactions between the transmitter and receiver, and any effect they might have on the SAR distribution. Recently, nonuniformity in the excitation field of internal transmit/receive prostate coils at 7T was successfully addressed using adiabatic pulses (9), and we have used adiabatic pulses with loopless antennae for MRI endoscopy at 3T using only a few Watts of power(21,22).
According to U.S. Food and Drug Administration (FDA) safety guidelines, whole body average exposure of ≤4W/kg for 15min, and/or local 1-g SAR ≤12W/kg are not considered a significant risk (30). We analyzed the RF safety of the 7T device both theoretically and experimentally and found that local 1-g SAR≤12W/kg at an applied RF exposure of 4W/kg (Fig. 6-7, Table I). Moreover, heating did not exceed 1.9°C after 15min exposure normalized to this SAR level in the configurations tested, suggesting that the device could potentially be safely operated at 7T.
The presence of local “hot spots” could pose additional risks, however, to the safety of internal devices at 7T. Here we theoretically determined the location of the maximum local SAR or hot spot, by EM analysis in the absence of the antenna, then performed safety testing of the device at this location. In the absence of the antenna, peak local 1-g SAR was about 3-times the average SAR at 7T. The numerical SAR analysis indicates that the effect on the 1-g SAR distribution of introducing the device remains relatively local. Compared to having no antenna present, neither the total power applied to the transmit coil to achieve unit current, nor the whole sample average SAR changed when the antenna was introduced in all of the configurations studied. By conservation of energy, this means that the antenna does not represent a significant increase in load or power loss to the head coil, and that any local increases in SAR with the antenna present, must be offset by reductions elsewhere, as is also evident in the experimental data (Table I: readings with ΔT<0.8°C vs reference exposure of 0.86°C). In situations where the antenna is not at a local SAR hot spot, the antenna's presence should not pose significant additional risks, assuming that it is properly decoupled. If, on the other hand, the antenna is located at an SAR hot-spot, the presence of the antenna could result in a local SAR that exceeds the FDA guideline, although this did not occur in the present studies. Note also that an inadequately decoupled device will have induced currents which, via Lenz's law, will counter the field near the antenna, deleteriously affecting performance by generating “decoupling artifacts”. These are absent from the images in Figs. 8 and 9.
Insertion depth did not much affect the computed 1-g SAR or the measured heating, although both were slightly higher at the shallower (35mm) depth where the entry point is essentially at the antenna junction. The heating of unprotected wire leads can be exacerbated when insertion lengths approach λ/4 in the medium (23,24), and in the present case the whip is in fact tuned to λ/4. Thus, the data in Table I illustrate the efficacy of the decoupling circuitry as a potential solution to the problem of heating of ∼λ/4 leads. The antenna length from both simulations and experiments at 7T was only about 17cm. While the lengths and insertion depths investigated may not be suitable for whole-body interventional studies, they are appropriate for this commercial 7T brain MRI scanner, with potential applications that could include intra-cranial MRI-guided remote targeting of diseased structures in the brain, or the remote placement of electrodes for deep brain stimulation(31-33).
In conclusion, these new results from interventional loopless antennae demonstrate a quadratic SNR improvement with B0 that extends to 7T to provide an over 20-fold SNR improvement and 100-fold increase in FOV area compared to the equivalent device at 1.5 T. These advances can translate to ∼50μm in-plane resolution and new opportunities for potentially safe, high-resolution MRI in humans at 7T, but additional work is needed.
Acknowledgments
We thank Joseph Gillen for help with 7T Philips scanner and Michael Schär of Philips Medical Systems for help with pulse sequence, Ye Qiao for useful discussions on in vitro imaging, and Di Qian for obtaining the vessel specimens and histology results. This work was supported by NIH Grant R01 EB007829.
References
- 1.Michaeli S, Garwood M, Zhu XH, DelaBarre L, Andersen P, Adriany G, Merkle H, Ugurbil K, Chen W. Proton T-2 relaxation study of water, N-acetylaspartate, and creatine in human brain using Hahn and Carr-Purcell spin echoes at 4T and 7T. Magnetic Resonance in Medicine. 2002;47(4):629–633. doi: 10.1002/mrm.10135. [DOI] [PubMed] [Google Scholar]
- 2.Vaughan TT, Snyder CJ, DelaBarre LJ, Bolan PJ, Tian J, Bolinger L, Adriany G, Andersen P, Strupp J, Ugurbil K. Whole-Body Imaging at 7T: Preliminary Results. Magnetic Resonance in Medicine. 2009;61(1):244–248. doi: 10.1002/mrm.21751. [DOI] [PMC free article] [PubMed] [Google Scholar]
- 3.Ibrahim TS, Lee R, Abduljalil AM, Baertlein BA, Robitaille PML. Dielectric resonances and B-1 field inhomogeneity in UHFMRI: computational analysis and experimental findings. Magnetic Resonance Imaging. 2001;19(2):219–226. doi: 10.1016/s0730-725x(01)00300-9. [DOI] [PubMed] [Google Scholar]
- 4.Hoult DI. Sensitivity and power deposition in a high-field imaging experiment. Journal of Magnetic Resonance Imaging. 2000;12(1):46–67. doi: 10.1002/1522-2586(200007)12:1<46::aid-jmri6>3.0.co;2-d. [DOI] [PubMed] [Google Scholar]
- 5.Collins CM, Smith MB. Calculations of B-1 distribution, SNR, and SAR for a surface coil adjacent to an anatomically-accurate human body model. Magnetic Resonance in Medicine. 2001;45(4):692–699. doi: 10.1002/mrm.1092. [DOI] [PubMed] [Google Scholar]
- 6.Zelinski AC, Angelone LM, Goyal VK, Bonmassar G, Adalsteinsson E, Wald LL. Specific absorption rate studies of the parallel transmission of inner-volume excitations at 7T. Journal of Magnetic Resonance Imaging. 2008;28(4):1005–1018. doi: 10.1002/jmri.21548. [DOI] [PMC free article] [PubMed] [Google Scholar]
- 7.Metzger GJ, van de Moortele PF, Akgun C, Snyder CJ, Moeller S, Strupp J, Andersen P, Shrivastava D, Vaughan T, Ugurbil K, Adriany G. Performance of External and Internal Coil Configurations for Prostate Investigations at 7 T. Magnetic Resonance in Medicine. 2010;64(6):1625–1639. doi: 10.1002/mrm.22552. [DOI] [PMC free article] [PubMed] [Google Scholar]
- 8.Klomp DWJ, Bitz AK, Heerschap A, Scheenen TWJ. Proton spectroscopic imaging of the human prostate at 7 T. Nmr in Biomedicine. 2009;22(5):495–501. doi: 10.1002/nbm.1360. [DOI] [PubMed] [Google Scholar]
- 9.van den Bergen B, Klomp DW, Raaijmakers AJ, de Castro CA, Boer VO, Kroeze H, Luijten PR, Lagendijk JJ, van den Berg CAT. Uniform prostate imaging and spectroscopy at 7 T: comparison between a microstrip array and an endorectal coil. Nmr Biomed online. 2010 doi: 10.1002/nbm.1599. [DOI] [PubMed] [Google Scholar]
- 10.Qiu BS, Karmarkar P, Brushett C, Gao FB, Kon R, Kar S, Atalar E, Yang XM. Development of a 0.014-inch magnetic resonance imaging guidewire. Magnetic Resonance in Medicine. 2005;53(4):986–990. doi: 10.1002/mrm.20384. [DOI] [PubMed] [Google Scholar]
- 11.Kumar A, Atalar E. MR imaging with a biopsy needle. Proceedings of the 9th Annual Meeting of ISMRM Glasgow; Scotland. 2001. p. 2148. [Google Scholar]
- 12.Susil RC, Yeung CJ, Atalar E. Intravascular extended sensitivity (IVES) MRI antennas. Magnetic Resonance in Medicine. 2003;50(2):383–390. doi: 10.1002/mrm.10506. [DOI] [PubMed] [Google Scholar]
- 13.Qian D, El-Sharkawy AMM, Atalar E, Bottomley PA. Interventional MRI: Tapering Improves the Distal Sensitivity of the Loopless Antenna. Magnetic Resonance in Medicine. 2010;63(3):797–802. doi: 10.1002/mrm.22152. [DOI] [PMC free article] [PubMed] [Google Scholar]
- 14.Ocali O, Atalar E. Intravascular magnetic resonance imaging using a loopless catheter antenna. Magnetic Resonance in Medicine. 1997;37(1):112–118. doi: 10.1002/mrm.1910370116. [DOI] [PubMed] [Google Scholar]
- 15.Serfaty J, Yang X, Aksit P, Solaiyappan M, Atalar E. Toward MR-guided coronary interventions. Radiology. 2000;217:422–422. [Google Scholar]
- 16.Serfaty JM, Yang XM, Foo TK, Kumar A, Derbyshire A, Atalar E. MRI-guided coronary catheterization and PTCA: A feasibility study on a dog model. Magnetic Resonance in Medicine. 2003;49(2):258–263. doi: 10.1002/mrm.10393. [DOI] [PubMed] [Google Scholar]
- 17.Yang XM, Atalar E. Intravascular MR imaging-guided balloon angioplasty with an MR imaging guide wire: Feasibility study in rabbits. Radiology. 2000;217(2):501–506. doi: 10.1148/radiology.217.2.r00oc17501. [DOI] [PubMed] [Google Scholar]
- 18.Shunk KA, Garot J, Atalar E, Lima JAC. Transesophageal magnetic resonance imaging of the aortic arch and descending thoracic aorta in patients with aortic atherosclerosis. Journal of the American College of Cardiology. 2001;37(8):2031–2035. doi: 10.1016/s0735-1097(01)01340-7. [DOI] [PubMed] [Google Scholar]
- 19.Weiss CR, Georgiades C, Hofmann LV, Schulick R, Choti M, Thuluvath P, Bluemke DA, Arepally A. Intrabiliary MR imaging: Assessment of biliary obstruction with use of an intraluminal MR receiver coil. Journal of Vascular and Interventional Radiology. 2006;17(5):845–853. doi: 10.1016/s1051-0443(07)60823-9. [DOI] [PubMed] [Google Scholar]
- 20.El-Sharkawy AM, Qian D, Bottomley PA. The performance of interventional loopless MRI antennae at higher magnetic field strengths. Medical Physics. 2008;35(5):1995–2006. doi: 10.1118/1.2905027. [DOI] [PMC free article] [PubMed] [Google Scholar]
- 21.Sathyanarayana S, Bottomley PA. MRI endoscopy using intrinsically localized probes. Medical Physics. 2009;36(3):908–919. doi: 10.1118/1.3077125. [DOI] [PMC free article] [PubMed] [Google Scholar]
- 22.Sathyanarayana S, Schar M, Kraitchman DL, Bottomley PA. Towards Real-Time Intravascular Endoscopic Magnetic Resonance Imaging. Jacc-Cardiovascular Imaging. 2010;3(11):1158–1165. doi: 10.1016/j.jcmg.2010.08.014. [DOI] [PMC free article] [PubMed] [Google Scholar]
- 23.Yeung CJ, Karmarkar P, McVeigh ER. Minimizing RF heating of conducting wires in MRI. Magnetic Resonance in Medicine. 2007;58(5):1028–1034. doi: 10.1002/mrm.21410. [DOI] [PubMed] [Google Scholar]
- 24.Bottomley PA, Kumar A, Edelstein WA, Allen JM, Karmarkar PV. Designing passive MRI-safe implantable conducting leads with electrodes. Medical Physics. 2010;37(7):3828–3843. doi: 10.1118/1.3439590. [DOI] [PubMed] [Google Scholar]
- 25.Weiss S, Vernickel P, Schaeffter T, Schulz V, Gleichl B. Transmission line for improved RF safety of interventional devices. Magnetic Resonance in Medicine. 2005;54(1):182–189. doi: 10.1002/mrm.20543. [DOI] [PubMed] [Google Scholar]
- 26.International A. Revision of F2182-09. Standard test method for measurement of radio frequency induced heating on or near passive implants during magnetic resonance imaging. West Conshohocken, PA 19428: Nov 15, 2009. [Google Scholar]
- 27.Schar M, Vonken EJ, Stuber M. Simultaneous B-0- and B-1+-Map Acquisition for Fast Localized Shim, Frequency, and RF Power Determination in the Heart at 3 T. Magnetic Resonance in Medicine. 2010;63(2):419–426. doi: 10.1002/mrm.22234. [DOI] [PMC free article] [PubMed] [Google Scholar]
- 28.Bottomley PA. A practical guide to getting NMR spectra in viva. Medical Magnetic Resonance Imaging and Spectroscopy. A Primer. 1986:81–95. [Google Scholar]
- 29.Edelstein WA, Glover GH, Hardy CJ, Redington RW. The Intrinsic Signal-to-Noise Ratio in Nmr Imaging. Magnetic Resonance in Medicine. 1986;3(4):604–618. doi: 10.1002/mrm.1910030413. [DOI] [PubMed] [Google Scholar]
- 30.States Food and Drug Administration (FDA) CfDaRH. Guidance for industry and FDA staff. Criteria for significant risk investigations of magnetic resonance diagnostic devices. FDA; Rockville MD: Jul 14, 2003. [Google Scholar]
- 31.Vayssiere N, Hemm S, Zanca M, Picot MC, Bonafe A, Cif L, Frerebeau P, Coubes P. Magnetic resonance imaging stereotactic target localization for deep brain stimulation in dystonic children. J Neurosurg. 2000;93(5):784–790. doi: 10.3171/jns.2000.93.5.0784. [DOI] [PubMed] [Google Scholar]
- 32.Martin AJ, Larson PS, Ostrem FL, Sootsman WK, Talke P, Weber OM, Levesque N, Myers J, Starr PA. Placement of deep brain stimulator electrodes using real-time high-field interventional magnetic resonance imaging. Magnetic Resonance in Medicine. 2005;54(5):1107–1114. doi: 10.1002/mrm.20675. [DOI] [PubMed] [Google Scholar]
- 33.Karmarkar PV, Baker KB, Lowe MJ, Phillips M, Steiner C, Viohl I, Nyenhuis JA, Bottomley PA, Rezai AR. An Active Microelectrode System for Experimental MRI-Guided Intracranial Intervention. Proc Intl Soc Mag Reson Med. 2005;13:2162. [Google Scholar]


