

Abstract
Purpose
The claim that speech perception abilities are impaired in dyslexia was investigated in a group of 62 dyslexic children and 51 average readers matched in age.
Method
To test whether there was robust evidence of speech perception deficits in children with dyslexia, speech perception in noise and quiet was measured using eight different tasks involving the identification and discrimination of a complex and highly natural synthetic ‘pea’-‘bee’ contrast (copy synthesised from natural models) and the perception of naturally-produced words.
Results
Children with dyslexia, on average, performed more poorly than average readers in the synthetic syllables identification task in quiet and in across-category discrimination (but not when tested using an adaptive procedure). They did not differ from average readers on two tasks of word recognition in noise or identification of synthetic syllables in noise. For all tasks, a majority of individual children with dyslexia performed within norms. Finally, speech perception generally did not correlate with pseudo-word reading or phonological processing, the core skills related to dyslexia.
Conclusions
On the tasks and speech stimuli we used, most children with dyslexia do not appear to show a consistent deficit in speech perception.
Keywords: Dyslexia, Speech perception, Noise, Reading, Categorical perception
Introduction
Reading impairment in dyslexia (DYS) is characterized by severe difficulties in phonological (letter-sound) decoding as well as in written word identification despite conventional instruction and adequate intelligence. It is widely accepted in the literature that individuals with dyslexia are impaired in the processing of phonological information which is crucial to learn to read in an alphabetic script. The origin of those phonological processing difficulties is hotly debated (Ramus et al., 2003; Ramus, White, & Frith, 2006; White et al., 2006) and a growing number of theories posit that deficits in speech processing are involved in disordered reading acquisition (Serniclaes, Van Heghe, Mousty, Carre, & Sprenger-Charolles, 2004; Ziegler, Pech-Georgel, George, & Lorenzi, 2009). On the other hand, speech perception deficits are not seen in all individuals with dyslexia (Adlard & Hazan, 1998; Manis et al., 1997) and in a recent study we conducted with adults with dyslexia, individuals did not perform consistently well or badly across a range of related speech perception tasks (Hazan, Messaoud-Galusi, Rosen, Nouwens, & Shakespeare, 2009). Here we examined a key aspect of speech perceptual processing in children’s phoneme categorization. We used both fixed and adaptive tasks of phoneme identification and discrimination which place varying task demands on listeners. We also investigated whether children with dyslexia are disproportionally affected by the addition of background noise in phoneme categorization and real word identification. Finally, we attempted to relate performance on speech perception tasks to broader phonological processing skills at the group as well as the individual level.
The difficulties that DYS individuals have in analyzing, memorizing and accessing the sound structure of language are well documented. These difficulties have been shown using tasks tapping phonological short term memory and rapid lexical retrieval (McBrideChang, 2006; Sprenger-Charolles, Serniclaes, & Cole, 2006). In addition, a compelling body of evidence has shown that DYS individuals have poor phonological awareness, as shown via tasks involving the segmentation, identification, discrimination or blending of sub-lexical units (Goswami, 2003; Liberman, Shankweiler, Liberman, Fowler, & Fischer, 1977; Swan & Goswami, 1997; Windfuhr & Snowling, 2001). DYS individuals also have problems with phonological tasks that involve finding and retrieving phonological codes of known names, and common reading errors involve phonologically-similar letter sounds (Liberman et al., 1977; Swan et al., 1997). Such pervasive difficulties in phonological processing led several influential theorists to suggest that specific reading impairment was due to inaccurate phonological representations in the mental lexicon (Goswami, 2003; Snowling, 2000), which would lead to impaired meta-linguistic processing, storage, access or retrieval of oral speech information. Reading acquisition would be affected because grapheme-phoneme correspondences cannot be reliably established if phonological representations are inaccurate.
It has also been suggested that DYS individuals show poorer speech perception abilities than aged-matched controls (Bogliotti, Serniclaes, Messaoud-Galusi, & Sprenger-Charolles, 2008; de Gelder & Vroomen, 1998; Goswami et al., 2002; Mody, Studdert-Kennedy, & Brady, 1997; Serniclaes, Sprenger-Charolles, Carre, & Demonet, 2001). While some researchers have argued that speech perceptual deficits in dyslexia are a result of weak phonological representations (Liberman, 1983; Morehead & Ingram, 1973; Vellutino1979), others suggest that problems with the processing of speech sounds may in fact be the cause of phonological difficulties, and may be linked to atypical development of phonetic categorization early in infancy (Bogliotti et al., 2008; Serniclaes et al., 2004). According to this view, the speech perceptual deficit affecting DYS individuals would be subtle and may go unnoticed in normal oral communication that provides multiple redundant and contextual cues. However, when limited acoustic information is provided or when speech is ambiguous (as in tests of categorical perception and in background noise), DYS individuals would fare less well than average readers.
Godfrey, Syrdal-Lasky, Millay and Knox (1981) first suggested that speech perception was less categorical in DYS children than in age-matched average readers. Stimulus identification was less consistent, and thus slopes of the identification more gradual, which was interpreted as indicative of overlapping or imprecise phoneme categories(Blomert, Mitterer, & Paffen, 2004; Hazan & Barrett, 2000). Also, discrimination in the phoneme boundary region was typically poorer in DYS individuals than average readers, suggesting that phonemic categories are more confusable. Similar patterns were found in further studies of categorical perception with DYS children (Boada& Pennington, 2006; Bogliotti et al., 2008; Brandt & Rosen, 1980; Chiappe, Chiappe, & Siegel, 2001; de Gelder et al., 1998; Mody et al., 1997; Nittrouer, 1999; Rosen & Manganari, 2001; Werker & Tees, 1987). Poor phoneme categorization would have important implications for access to abstract phonological representations, as it would make it more difficult to extract invariant phonological representation from the speech signal. This would in turn impact on word identification when limited acoustic information is available and would have even more deleterious consequences for conscious access to phonemes and for the acquisition of reading.
Some researchers have argued that the speech perception difficulties of DYS individuals may also come from the fact that they perceive within-category variants as distinct units. Serniclaes et al (2004) showed that, in addition to poorer discrimination across phonemic categories, DYS children showed enhanced within-category discrimination abilities relative to average readers. They concluded that phoneme inventories of DYS children and adults are overcrowded, with more categories than necessary to perceive their native language. This “allophonic mode of speech perception” affects reading acquisition by inflating the number of possible spelling-to-sound correspondences.
The finding of group deficits in phoneme categorization tasks, however, is not universal and some studies have failed to find significant differences in identification between DYS and AR groups in studies with children (e.g., Mody, Studdert-Kennedy & Brady, 1997; Adlard and Hazan, 1998; Joanisse, Manis, Keating & Seidenberg, 2000; Maassen, Groenen, Crul, Assman-Hulsmans & Gabreels, 2001; Blomert, Mitterer and Paffen, 2004; Robertson, Joanisse, Desroche and Ng, in press) and adults (Ramus et al., 2003).Also, studies that have presented individual data have found that group data can obscure a more complex picture. Adlard & Hazan (1998) tested DYS children and reading- and chronological-age controls and found that only 30% (4 out of 13) of the DYS children had poor speech perceptual abilities, while the remaining 70% performed within norms. A comparable proportion of poor perceivers was reported by Manis and colleagues (Manis et al., 1997), and using a more stringent criterion, McArthur, Ellis, Atkinson, and Coltheart(2008) observed that only 16% of DYS children had difficulties with consonant-vowel discrimination (/ba/-/da/) and 21% with vowel discrimination (/e/-/a/ continuum). These studies suggest that categorical perception deficits are less prevalent than phonological processing difficulties and might in fact affect only a subgroup of dyslexic children.
Ziegler et al (2009) argued that inconsistent findings in terms of the perceptual abilities of DYS individuals may be due to the fact that most studies have presented stimuli in quiet conditions. They observed speech perception deficits in DYS children for the identification of naturally produced vowel-consonant-vowel stimuli when presented in various background noise conditions, but not when the same material was presented in quiet. Difficulties in processing speech in noise were also found in other studies (Boets, Ghesquiere, van Wieringen, & Wouters, 2007; Brady, Schankweiler, & Mann, 1983). Ziegler et al (2009) suggested that perceptual deficits may not be seen in quiet as the speech signal contains much redundant acoustic cue information, but that further stressing the perceptual system with additional background noise or by using simplified synthesized tokens might reveal subtle deficits in perception.
To summarize, studies in support of a speech perceptual deficit in DYS individuals suggest that the difficulties that DYS children and adults experience are subtle and only emerge when incoming acoustic information is limited or ambiguous. In addition to difficulties in performing operations involving oral and written phonological units, speech perceptual deficits would also compromise the access to lexical information, particularly under difficult listening conditions. Further support for a link between phonological processing and speech perception is provided by the moderate correlations reported (Manis et al., 1997; Mayo, Scobbie, Hewlett, & Waters, 2003) and also by structural equation modelling on a large sample of children indicating that the effect of speech perception on reading was mediated by its relation to phonological processing abilities (McBrideChang, 1996)
In a recent study, we sought to address the issue of prevalence and reliability of speech perceptual deficits in DYS adults, tested on a wide range of tasks (Hazan et al., 2009). Most involved the identification and discrimination of stimuli from a synthetic plosive voicing continuum (“bee”-“pea”) presented in both quiet and noise. The discrimination tests were presented using both adaptive and fixed-step procedures with the rationale that if an individual’s difficulties were due to a speech perceptual deficit this would be consistent whatever the task procedure used. Significant group differences were found for across- and within-category discrimination when tested using a fixed-step procedure but not when using adaptive procedures. No group differences were obtained for identification, also tested adaptively nor for separate tests of natural words in noise. Individuals did not show consistent poor performance across related tasks. These results were interpreted as providing weak support for a speech perception deficit in dyslexia. It was suggested that some individuals with dyslexia have speech perceptual acuity that is at the lower end of the normal range and exacerbated by nonsensory factors such as attention or other task-related factors.
However, dyslexia is a developmental disorder which implies that the profile of individuals affected is not static and changes under the influence of developmental and environmental factors (Karmiloff-Smith, 1998; Karmiloff-Smith, Scerif, & Ansari, 2003; Robertson, Joanisse, Desroches, & Ng, 2009). Therefore, findings of studies with DYS adults may not be generalisable to DYS children. In addition, even if speech perception in DYS children is atypical, it may still improve with age and be on par with average readers at a later stage of their language development. Therefore, it is informative to test DYS children and age-matched average readers that span a large age range.
The overall goal of the present study was therefore to further test the speech perceptual explanation of dyslexia in childhood, where such deficits are less likely to have been compensated for. The DYS children recruited were assessed using the same range of categorical perception and speech in noise tasks as in Hazan et al. (2009). More particularly the present study aimed at answering five research questions:
Is there evidence of a consistent deficit in speech perception in dyslexic children? We hypothesized there would be support for the speech perceptual account of dyslexia if children showing such a deficit performed poorly on the discrimination of a given speech continuum (e.g., a ‘pea’-‘bee’ voicing contrast) regardless of whether this was assessed using a fixed or adaptive test procedure. Also, performance was expected to be consistently poor or good across both tests of natural words in noise.
Is there evidence for better within-category discrimination in DYS than AR children? We wished to investigate claims put forward by the allophonic model of speech perception of better within-category discrimination abilities in DYS children. Discrimination of within-category discrimination was assessed using both fixed and adaptive test procedures.
Do the speech perception abilities of DYS children worsen in noise? Consistent with the speech perceptual explanation of dyslexia, we hypothesized that if poor performance on identification or discrimination tasks was indicative of subtle speech perceptual impairments, then performance should be worsened by the addition of noise. To test this hypothesis, identification and discrimination tests for the ‘pea’-‘bee’ voicing contrast were carried out both in quiet and in noise. Two additional tests of natural words in noise were also presented.
What is the prevalence of speech perceptual deficit in dyslexic children? To assess this, we compared the proportion of children within and without dyslexia who performed below norm for each task.
Is there a link between speech perception abilities, phonological processing and reading abilities? To assess this, we looked at correlations across the different kinds of tasks in the test battery.
Method
Participants
The 113 participants included in the study were aged between 6:6 and 13:7 years; 62 children were dyslexic (DYS) and 51 children were average readers (AR). All participants were monolingual English speakers. DYS children were recruited from specialist schools as well as mainstream schools with a dyslexia unit. Average readers (AR) were mainly recruited from the same mainstream schools as DYS participants and through personal contacts.
To be included in the study, all participants had to pass a pure-tone hearing screening test at 0.5, 1.0, 2.0 and 4.0 kHz presented at 30 dB HL. They were also required to score 85 or better in standardized scores for non-verbal IQ, verbal IQ and receptive grammar tests. Non-verbal IQ was measured using the block design of the WISC IV (Wechsler, 2004), verbal IQ with the British Picture Vocabulary Scale (Dunn, Dunn, Whetton, & Burley, 1998) and receptive grammar, using the Test of Receptive Grammar (Bishop, 2005), see Table 1. Between groups comparisons were carried out using the Kolmogorow-Smirnov Z test due to the data being not normally distributed and because of the high proportion of tied scores. Scores on the WISC did not differ significantly between the DYS and AR (Z=1.198, p.113). Receptive grammar (TROG) and vocabulary (BPVS) were significantly poorer in DYS than in AR (Z=2.47 and Z = 2.44 respectively, both p < 0.01) and effect sizes moderate (both r = 0.46). This pattern of result is well documented in DYS children as reading problems impact negatively on vocabulary and syntactic acquisition (for a review, see Vellutino, Fletcher, Snowling, & Scanlon, 2004).
Table 1.
Mean and standard deviation (in brackets) for the group matching measures, presented separately for the average reader and the dyslexic groups. Standardized scores are provided for the tests and age is expressed in months
| Average Reader | Dyslexic | ||
|---|---|---|---|
| Non verbal IQ | 103 (10) | 99 (10) | |
| Verbal IQ | 115 (11) | 104 (11) | |
| TROG | 108 (8) | 100 (8) | |
| Age at first visit | 124 (21) | 132 (17) | |
| Age at second visit | 128 (23) | 139 (17) | |
| Gender (n) | Boy | 19 | 40 |
| Girl | 32 | 22 |
DYS children had to have been provided with an official diagnosis of dyslexia by a chartered educational psychologist and were excluded from the study if additionally diagnosed with a co-morbid disorder (SLI, autism, ADHD, dyspraxia). AR children were included in the study if they scored above a standard score of 1001 on the TOWRE reading test (Torgesen, Wagner, & Rashotte, 1999) and if they were free of any learning disability (reported by the school). One child declined consent, 69 volunteers were excluded as they failed to fulfil the criteria set out above and 3 participants withdrew from the study at a later stage.
Test battery
For a more detailed description of the experimental procedures, see Hazan et al (2009).
Phonological Awareness
Phonological Awareness was assessed using the rhyme and the spoonerism subtest of the PhAB (Frederickson, Frith, & Reason, 1997).
Phonological Short Term Memory
The CNRep (Gathercole, Willis, Baddeley, &Emslie, 1994) a nonword repetition task, was used as a measure of phonological short term memory.
Reading
The participants’ reading level was assessed using the word and pseudo-word reading lists of the TOWRE - Form A (Torgesen et al., 1999).
Experimental tests
The synthetic continuum
The same synthesized ‘pea’-‘bee’ continuum was used in all categorical perception tasks2, so as to preclude the possibility that inconsistencies in performance across tasks could be due to stimulus differences. Stimuli were generated by copy synthesis of a natural [bi] token recorded from a female native British English speaker, using the cascade branch of the Klatt (1980) synthesizer. The continuum was generated by delaying the onset of voicing while concurrently increasing the aspiration duration, to obtain stimuli differing in Voice Onset Time (VOT) ranging from 0 ms for the /bi/ end to 60 ms at the /pi/ end of the continuum(for a full description see Hazan et al., 2009). In the noise conditions, a20-speaker babble was played simultaneously with the synthetic syllables at a signal-to-noise ratio (SNR) of +6 dB. Stimuli were pre-tested with 5 adults and 5 children who showed a typical categorical perception pattern in both the identification and discrimination tasks, i.e., a phoneme boundary located at around 22 ms VOT, as expected for an English stop voicing contrast (Lisker & Abramson, 1970)and enhanced discrimination of stimuli straddling the phoneme boundary.
Identification tasks
A one-interval two-alternative adaptive forced-choice task was used to assess labeling ability. Two independent adaptive tracks were used. Each operated under identical rules but started at opposite ends of the continuum, were designed to track 71% and 29% of “bee” responses using a 2-down/1-up rule(Levitt, 1971).On any particular trial, the choice of track was made at random. The task ended after 7 reversals on each track (with step-sizes decreasing over the first 3 reversals), or a maximum of 50 trials. Catch trials (continuum endpoints) were randomly interspersed 20% of the time so that participants would not hear an uninterrupted sequence of ambiguous stimuli. The interspersed endpoints also provided a measure of response consistency throughout the task. Given that catch trials were accurately identified at the start of the task by every listener, we reasoned that a reduction in correct identifications of catch trials as the test proceeded would be a good indication of lapses in attention. The task was presented in quiet (ID-Q) and in a background of 20-talker babble at +6 dB SNR (ID-N) in two different blocks.
Logistic regression was used to fit a sigmoid curve to the data for each participant. Two measures were extracted: the phoneme boundary which indicates the point along the VOT continuum that is equally labelled as /b/ or /p/, and the slope of the identification function which provides information on labeling consistency. By design, the adaptive procedure concentrated responses to stimuli in the fastest changing part of the identification function, leading to more accurate estimates of the slope and phoneme boundary. The catch trials were included in the data for the calculation of slope values but were also analyzed separately along with test trials presenting endpoint stimuli and used as a measure of the level of attention maintained through the task, as described above. This allowed us to determine whether poor and good perceivers differed in terms of their attention level throughout the task rather than in their categorization ability per se.
Discrimination tasks
Three different discrimination tasks were presented to each participant, using the same /pi/-/bi/ continuum: two adaptive discrimination tasks and a fixed-procedure discrimination task. A three-interval three-alternative forced-choice oddity procedure was used for all three tasks.
In the adaptive discrimination task testing within-category discrimination, the standard stimulus for every test trial was the /pi/ endpoint of the continuum. The test started with the /bi/ endpoint as the comparison stimulus. A 3-down/1-up adaptive procedure (Levitt, 1971)was used to choose the comparison stimulus to estimate the stimulus that could be discriminated from the standard 79.4% of the time. The test continued until 7 reversals, or a maximum of 50 trials. This test was done both in quiet (AdaptWC-Q) and in the same background of babble noise used in the identification task (AdaptWC-N). The jndVOT (just noticeable difference in VOT) was calculated by taking the mean of the final 4 reversals (i.e., when the minimum step size had been reached). A jndVOT less than 38 ms VOT (in quiet) indicated that the listener was able to discriminate differences within the /pi/ category. This is because the jnd was with reference to the ‘pea’ endpoint (VOT=60 ms) and the mean phoneme boundary was at 22 ms VOT (60 ms – 22 ms= 38 ms VOT). Not all listeners reached this level of performance.
The adaptive discrimination task testing across-category discrimination (AdaptAC-Q) was essentially identical except that here, both the comparison and standard stimuli changed as the adaptive track proceeded so as to remain centred at 22.5 ms VOT, near the phoneme boundary. Therefore, the standard /bi/ was initially set at 0 ms VOT and the comparison /pi/ at 45 ms VOT, resulting in jndVOTs that were always across-category and could lie between 1 and 45 ms. For both these tasks, larger jndVOTs indicate poorer discrimination abilities.
In order to look for consistency of good or poor discrimination across related tasks, a non-adaptive discrimination task using a fixed presentation was also presented using tokens from the same stimulus continuum. This included a number of within-category stimulus pairs (5-20 ms, 35-50 ms, 40-60 ms and 50-35 ms) and across-category pairs (20-35ms and 15-35 ms) each presented 18 times in random order3. The proportion of correct response was calculated over the across-category pairs (FixedAC-Q) and within-category pairs (FixedWC-Q), with chance level performance at 33%. This task was presented in quiet only.
Identification of highly-frequent words and words in context with background noise
The aim of these tasks was to assess the identification of a set of familiar and naturally-uttered words with noise in the background.
Words in Noise (WiN)
Twenty-five highly frequent monosyllabic words (e.g.: “girl”, “blade”) with an objective age of acquisition of no more than 4 years old were selected (De Cara & Goswami, 2002). Items were presented in random order with the same babble in the background as in other tasks, presented at a fixed level of 65 dB SPL (measured over a frequency range of 0.1-10 kHz). The SNR varied by altering the level of the word4. The procedure started with an SNR of 12 dB and tracked 50% correct adaptively with a one-up one-down rule. The test ended after 10 reversals or 25 trials, with the Speech Reception Threshold (SRT: the SNR that leads to approximately 50% correct) calculated from the mean of the reversals.
Words in Noise in Connected Speech (WiNiCS)
This test was modeled after the Coordinate Response Measure (Bolia, Nelson, Ericson, & Simpson, 2000), modified to be particularly appropriate for children. On each trial, participants heard the carrier phrase: “show the dog where the [colour] [number] is” with the same babble in the background used in other tasks. Displayed on the computer screen was a picture of a dog and six identical digits, matching the one uttered in the target sentence and differing only in colour. Participants were instructed to click on the digit in the colour that they heard. All the digits from 1-9 were used (except the bisyllabic 7) and the six colours were black, white, pink, blue, green, and red. A three-up one-down adaptive procedure was used to vary SNR, tracking the threshold for a 79.4% correct level from the mean of the reversals excluding the first two. Unlike the WiN task described above, the total level of the output was fixed at 65 dB SPL. The first sentence was presented at an SNR of +20 dB, with an initial step size of 10 dB which decreased linearly to 5 dB over the first 2 reversals. The test ended after a total of eight reversals or after 30 trials.
Procedure
Testing took place individually in a quiet room at the child’s school for all the participants except the 15 AR children recruited through personal contacts who were tested at home. Participants were visited a first time over a week during which 6 testing sessions lasting approximately 30 minutes each were organized. The screening tasks were presented in sessions 1 and 2 (hearing threshold, non-verbal IQ, phonological awareness - rhyme subtest, reading, test of receptive grammar). The remaining tasks that did not involve speech perception, were given in a random order over sessions 3, 4, 5 and 6, depending on different factors such as the time allocated by a school for testing during a given session. All the speech perception tasks, apart from the WiN and the WiNiCS, were presented in a fixed order: categorical perception in quiet (ID-Q and AdaptWC-Q), categorical perception in noise (ID-N and AdaptWC-N) were presented consecutively, over 2 sessions taking place 24 hours apart at least. A small number of children missed a session, leading to missing data: one AR child for AdaptWC-Q, one for AdaptWC-N and two others for the WiN test.
The non-adaptive (FixedAC-Q and FixedWC-Q pairs) and AdaptAC-Q tasks were presented at a second occasion, within a single session carried out between a month and a year later. At that stage, 44 AR children and 58 DYS children were present and available to take the tests. Testing had to be interrupted for one of the AR children who was not administered the AdaptAC-Q task.
Fifteen AR children who were tested at home were administered the entire assessment over 2 sessions: the testing order differed only in that all categorical perception tasks in quiet were played during the first session and tests in noise were presented in the second session. Sessions were discontinued if a child showed signs of tiredness. For all the tests, instructions and test items were recorded by a native female English speaker and played via a Sony-VAIO VGN-TX2XP computer using Sennheiser PC 150 combined stereo headset–noise cancelling microphone. The experimenter provided encouragement during breaks and answered any questions.
Results
Group comparison
All outcome measures described are raw scores, hence not standardized by age. Therefore, we typically expect to see improvements in performance with age, as children tend to improve in most tasks as they get older. Results were analyzed using similar techniques to those in Thomas et al. (2009) which ensure that potential differences between groups are not concealed by developmental trends.
Our goal was to compare dyslexic children to age-matched AR children on all the experimental tasks while systematically accounting for the continuous effect of age. The data were analyzed using a General Linear Model (GLM) with the score on a particular task as the outcome variable and two predictor variables: group and age. The GLM incorporates aspects of both ANOVA using categorical predictors and regression using continuous predictors.
Five models were fitted to each outcome variable. The more parsimonious was determined using an F statistic comparing models on the basis of their residual sums of squares and degrees of freedom following the method in Cook & Weisberg (Cook & Weisberg, 1999).
Model 1 is the most general and complex model, in which the intercept and slope parameters for each group are different, indicating a significant interaction between age and group. A model such as this means that differences between the two groups changes with age.
Model 2 is the second most complex model, with both main effects significant but no interaction. Thus the regression lines have equal slope but the intercepts differ. Here, developmental trends are the same in the two groups but the groups differ overall.
In model 3, the slope and intercept are the same for both groups, but with a main effect of age, indicating performance improving over age but otherwise no difference between the groups.
In model 4, neither age nor its interaction with group is significant, but there is a simple main effect of group. Therefore performance does not change with age but still differs overall between the two groups.
Finally, in the degenerate model 5, neither age nor group significantly predict performance
The significance level was set at the traditional p<.05 level which typically minimizes the risk of a false positive to 5% or less. Only statistically significant predictor variables (p<0.05) are mentioned. In cases where p>.05, the power of the group comparison has also been provided as support to negative results can be granted in cases where the risk of a false negative is low (Cohen, 1988). Power was calculated using G*Power (Erdfelder, Faul, & Buchner, 1996) and was computed as a function of the significance level, the sample size of each group and the population effect size (Cohen, 1988).
Reading and Phonological Processing
There was a significant effect of group and age for the raw word reading scores (p < 0.001) and a significant interaction between age and group for the pseudo-word reading scores (p < 0.001), owing to the fact that AR children improved with age while DYS children, whose scores were poorer at all ages, performed similarly across age. The DYS group scored significantly lower than the AR group on all phonological processing tasks: rhyme, spoonerisms and nonword repetition (all p<.001 - Table 2). The main effect of age was also significant for nonword repetition, with scores improving with age in both groups. For the spoonerism subtask, the group by age interaction was significant (p<.05) due to AR children improving with age (p< .001) while DYS children of all ages performed below the level of the youngest AR children. As expected, the DYS participants were therefore impaired in their reading of words and pseudo-words and in the processing of phonological information relative to AR children of the same age.
Table 2.
Summaries of performance on all tasks for the two groups of participants. For each experimental measure, the number of participants (n), mean scores, and standard deviation (in brackets) is given for the two groups separately. ‘Sig’ indicates the extent to which the mean scores statistically differ between the average readers and the participants with dyslexia
| MEASURE | Average Reader |
Dyslexic | Siga | |||
|---|---|---|---|---|---|---|
| n | score | n | score | |||
| Reading (standard scores) | Words | 51 | 108.78 (11.68) |
62 | 84.81 (9.40) |
*** |
| Pseudo-Words | 51 | 119.31 (10.81) |
62 | 82.95 (10.68) |
*** | |
| Sum | 51 | 116.73 (11.86) |
62 | 81.15 (11.58) |
*** | |
|
| ||||||
| Phonological processing |
Phonological Awareness Rhyme |
51 | 18.88 (1.61) |
62 | 16.15 (2.96) |
*** |
|
Phonological Awareness Spoonerism |
51 | 15.51 (3.09) |
62 | 10.82 (3.37) |
*** | |
|
Short Term Memory (Non- Word repetition) |
51 | 36.39 (2.64) |
62 | 31.92 (4.74) |
*** | |
|
| ||||||
| ID-Q slope | all items | 51 | 0.43 (0.25) |
62 | 0.24 (0.18) |
*** |
| test items only | 51 | 0.44 (0.24) |
62 | 0.33 (0.22) |
* | |
| Items 11-49 ms VOT only | 51 | 0.44 (0.24) |
62 | 0.33 (0.22) |
* | |
|
| ||||||
|
Proportion correct catch trials for ID-Q |
Total | 51 | 0.98 (0.08) |
62 | 0.93 (0.09) |
*** |
|
| ||||||
| ID-N slope | all items | 51 | 0.21 (0.22) |
62 | 0.23 (0.25) |
NS |
| test items only | 51 | 0.23 (0.23) |
62 | 0.26 (0.25) |
NS | |
| Items 11-49 ms VOT only | 51 | 0.26 (0.24) |
61b | 0.26 (0.25) |
NS | |
|
| ||||||
|
Proportion correct catch trials for ID-N |
Total | 51 | 0.95 (0.10) |
62 | 0.91 (0.11) |
- |
|
| ||||||
| AdaptAC-Q | jndVOT | 43 | 19.03 (11.51) |
58 | 16.92 (9.59) |
NS |
|
| ||||||
| AdaptWC-Q | jndVOT | 50 | 28.83 (7.49) |
62 | 34.58 (7.77) |
* |
|
| ||||||
| AdaptWC-N | jndVOT | 50 | 33.65 (14.19) |
62 | 40.62 (12.71) |
* |
|
Fixed across and within discrimination in Quiet |
Pair 65-50 ms VOT | 44 | 36% (11) | 58 | 33% (11) | NS |
| Pair 60-40 ms VOT | 44 | 39% (11) | 58 | 37% (10) | NS | |
| Pair 50-35 ms VOT | 44 | 40% (10) | 58 | 34% (10) | *** | |
| Pair 35-20 ms VOT | 44 | 64% (15) | 58 | 51% (17) | *** | |
| Pair 35-15 ms VOT | 44 | 73% (14) | 58 | 61% (16) | *** | |
| Pair 20-5 ms VOT | 44 | 48% (16) | 58 | 43% (14) | NS | |
|
| ||||||
|
FixedWC-Q (average 65- 50, 60-40, 50-35, 20-5) |
44 | 41% (6) | 58 | 36% (6) | *** | |
|
FixedAC-Q (average 35-20, 35-15) |
44 | 68% (13) | 58 | 56% (15) | *** | |
|
| ||||||
| WiN | Threshold SNR | 49 | −4.11 (1.43) |
62 | −4.30 (1.68) |
NS |
|
| ||||||
| WiNiCS | Threshold SNR | 51 | −5.96 (2.04) |
62 | −6.31 (1.76) |
NS |
Significance levels provided are for the effect of group (with AR group > DYS group), except for pseudo-words reading, catch trial ID-N and AdaptWC-Q where significance levels are for the age X group interaction (with scores significantly improving with age for the AR group, not for the DYS group). NS = non-significant; * = p<0.05; ** = p<0.01; *** = p<0.001.
One participant was not presented with intermediary items 11 to 49 ms by the adaptive procedure because his/her performance was so poor.
Identification of the /pi/-/bi/ continuum in quiet and in noise
Differences in identification between the DYS and AR groups were observed when comparing the slopes derived from their identification functions in quiet but not in noise. The distribution of the individual slopes was highly skewed, so each slope was log transformed for further analysis.
An initial analysis was done to confirm that the presence of noise had a substantial effect on categorization performance. Two 2 × 2 mixed-design ANOVAs were conducted on the log-transformed slope of the identification functions and on the phoneme boundary (calculated when both test items and catch trials were included), with noise (quiet vs. noise) as a within-subject factor and group (DYS vs. AR) as a between-subject factor. The two groups did not differ in phoneme boundary, with noise as the only significant factor [F (1, 111) = 82.46; p<.001].When the slopes of the identification functions were examined, the noise by group interaction was significant [F (1, 111) = 9.21; p<.001], due to a greater effect of noise on the slope of the identification functions for the AR than for the DYS group. Given that the identification tasks presented stimuli adaptively, this lack of group differences in noise cannot be explained by a floor effect in the performance of the DYS children. For this reason, along with poorer performance in identification in quiet, we would expect DYS children to perform less well than their AR peers in noise if their speech perception skills were weaker and more prone to be disrupted by interfering noise than AR children.
Results of the stepwise GLM analysis conducted on the slope of the identification function in quiet indicated that the effects of age and group were significant (p = .003 and p<.001 respectively, effect size r = .47) with no interaction. The slopes increased as a function of age and were shallower in the DYS group (Figure 1 left panel).
Figure 1.

Individual scores and regression line of the slope of the identification function for ID-Q (left panel) and ID-N (right panel) for the AR (full triangles and line) and the DYS (open circles, dotted line) groups as a function of age (in months). A larger value corresponds to a steeper slope. ID-Q = identification task presented in quiet; ID-N = identification task presented in noise; AR = average readers group; DYS = group with dyslexia.
Responses to endpoint stimuli (whether catch or test trials) are of particular interest given the strong evidence that such errors reflect inattention rather than an inability to categorize stimuli (in particular, errors were very rare at the beginning of test sessions). The vast majority of AR listeners (86%) made no errors whereas nearly half of the DYS group made at least one (48%). DYS participants mislabelled, on average, 5.7% of the endpoint stimuli presented, in comparison to only 1.9% of endpoint stimuli mislabeled by AR participants. In order to more fully characterize errors made to endpoint stimuli, a logistic regression was used to model endpoint errors as a function of age (in months), group (AR or DYS) and trial(1-50), and all their interactions. Both age and trial were treated as continuous variables. By examining changes in deviance as predictors were eliminated from the model, it was found that no interactions were significant (p = .16 in comparing a model with all interactions and one with none) but all the main effects were (p<0.001 for all). Thus inattention increases through a testing session, is higher for younger listeners, and is higher for DYS participants than average readers. Figure 2 compares the original endpoint error data as a function of trial number with the prediction of the logistic regression in the two participant groups (without accounting for the effect of age). A comparison of the size of the obtained regressions coefficients shows that being dyslexic is equivalent to a 4-year delay in attentional capabilities as compared to average readers.
Figure 2.

Proportion of times the endpoint stimuli were correctly labeled as a function of trial number shown separately for the AR and DYS children. The smooth dashed lines result from a logistic regression using trial number as a continuous predictor but not accounting for the effects of the child’s age.
Errors to endpoint stimuli are also important because it is well known that performance in the endpoint regions of the identification function can greatly influence the slope values obtained when fitting psychometric functions by logistic regression (Wichmann & Hill, 2001). This means that a shallow slope may reflect an inconsistent pattern of identification in these endpoint regions rather than be related to responses around the phoneme boundary region. Therefore, individual slopes were recalculated on the basis of test trials only (excluding catch trials). Despite an increase in slope values for the DYS group (Table 2), the group and age effects remained significant (p = .016and p = .002 respectively, effect size r = .33). The effect of endpoint stimuli on the slope estimate was further assessed by excluding from the calculation of the slope stimuli outside of the 11 to 49 ms VOT range, corresponding to the plateaux of the identification function. Here again, the group and age effects remained significant (p = .045 and p = .003 respectively, effect size r = .3). Paired t-tests indicated that the mean slope that included all trials was significantly shallower than the slope excluding catch trials (t(112) = −5.14 p<.001) and the slope including mid-range stimuli only (t(112) = −5.07 p<.001), while the latter two slope measurements did not differ. When the same analysis was run separately for each group, none of the measures differed in the AR group, while for the DYS group, the ‘all trials’ slope differed from the ‘no catch trial’ slope and the slope for mid-range stimuli only (t(61)=−5.12 p<.001, t(61)=−5.11 p<.001, respectively). This suggests that DYS children are being less consistent in their labeling of ‘easy’ regions of the continuum throughout the test, probably indicating lapses in attention as the test progresses, and that this is affecting the statistic used to assess the degree of categorical labeling. Of course, lapses in attention would affect responses to all steps of the continuum but can only be readily quantified for the regions of the continuum where consistent labeling is expected (i.e. the endpoint regions) as we have done here. Therefore, although it is clear that accounting for inattention in the ways described above reduces the group differences in the slope measure, it is still an open question whether any differences in slope would remain once all differences in attention were accounted for.
When slopes derived from the identification task in noise5 were considered (see Figure 1 right panel and Figure 3 bottom panel), neither the effect of age nor group was significant but the power of the group comparison was low (0.52). As can be expected, slopes were shallower in noise and the continuum’s endpoint could not be identified with 100% accuracy. Therefore we could not assume perfect categorization at the continuum endpoints’ and derive children’s level of attention using the catch trials. However, it should be noted that all individual slopes were different from 0, so that the lack of a group effect was unlikely to be due to a floor effect (see Figure 3 bottom panel).
Figure 3.

Identification functions for the “bee”–“pea” continuum for the AR group (at left) and the DYS group (at right) in quiet (top) and in noise (bottom). The circles indicate the proportion of “bee” responses along the voice onset time (VOT) continuum in ms for the data aggregated across all participants within the group. The size of each circle is proportional to the number of presentations at a given VOT. The solid lines result from a logistic regression on each set of aggregated data. Note that all endpoint stimuli were labeled correctly at least 89% of the time, even in noise.
Across-category discrimination
This was examined using both adaptive (AdaptAC-Q) and fixed-step (FixedAC-Q) procedures. For the AdaptAC-Q (in quiet) task scores were log-transforned because of skewed distribution. Neither group nor age significantly predicted log-transformed jndVOT (just-noticeable difference in VOT), even though the power of the group comparison was high (0.82). However, when a fixed-step procedure was used (FixedAC-Q), better performance was obtained for the AR than the DYS group. A two-way repeated-measures ANOVA with stimulus-pair as within-subject factor and participant group as between-subject factor revealed that the interaction between group and stimulus pair was significant [F(5,500) = 430.64, p<.001)]: independent sample t-tests indicated that the across-category pairs 20-35 and 15-35ms VOT were discriminated significantly better in the AR than in the DYS group (t(100) = 3.64 p<.001; t(100) = 3.79 p<.001 respectively).Age trends were examined by calculating a mean discrimination score for the FixedAC-Q pairs for each participant (Figure 4). Across-category, older children scored significantly better than younger children, and AR children discriminated better than DYS children (p = .023, p<.001 respectively). This is not consistent with the results obtained using an adaptive procedure as the effect of group was not significant in AdaptAC-Q.
Figure 4.

Box plot of the proportion of correct discrimination scores for each pair of stimuli presented using the fixed procedure (FixedAC-Q and FixedWC-Q). The DYS children are represented in white boxes, and the AR children are represented in gray boxes. The horizontal line represents chance level of performance, which is set at .33 proportion correct in this task. FixedAC-Q = fixed presentation discrimination task: across-category stimulus pairs; Fixed WC-Q = fixed presentation discrimination task: within-category stimulus pairs.
Within-Category Discrimination
This was again examined using both adaptive (AdaptWC-Q) and fixed-step (FixedWC-Q) procedures. For AdaptWC-Q, the age by group interaction was significant (p<.05). When the effect of age was analyzed separately for each group, it was significant for the AR group (p<.001) but not for the DYS group. Figure 5 indicates that the discrimination threshold for the AR group improves with age, and is well within-category at all ages for most individuals (< 37 ms VOT), while the mean discrimination threshold for the DYS group is at boundary values (Table 2), with a smaller proportion of individuals discriminating within-category. When the same adaptive task was presented in noise (AdaptWC-N), the main effects of group and age were significant (p = .002, p = .016 respectively) due to the improvement in discrimination threshold with age and a lower threshold (better performance) in the AR relative to the DYS group (Figure 5). As mentioned above, a significant interaction between group and stimulus pair was obtained in the fixed-step procedure task: independent sample t-tests indicated that the within-category 35-50 ms VOT pair was discriminated significantly better in the AR than in the DYS group (t(100) = 3.65 p<.001, Figure 4). Again, age trends were examined by calculating a mean discrimination score for FixedWC-Q pair. Better within-category discrimination scores were found for AR than for DYS participants (p<.001).
Figure 5.

Just noticeable difference in ms VOT (jndVOT) relative to a fixed reference stimulus of 60-ms VOT for Adapt WC-Q (left panel) and Adapt WC-N (right panel) for the AR group (full triangles and line) and DYS group (open circles, dotted line) as a function of age (in months). A discrimination threshold of < 37 ms VOT (marked on the y axis by a notch) is within category.
WiN and WiNiCS
For the identification of highly-predictable words in isolation (WiN) and in context (WiNiCS) presented in noise, neither the effect of group nor the effect of age were significant for either of the two tasks (see Table 2). In addition, the power of the group comparison was medium to high for WiN (0.63) as well as for WiNiCS (0.69).
In summary, significant differences in performance between the AR and DYS groups were found for the identification task in quiet, for within-category discrimination in quiet whether tested adaptively or using a fixed-level procedure, for the discrimination task in noise and for across-category discrimination when assessed using a fixed-level procedure. For all these tests, better performance was obtained for the AR than the DYS group, therefore countering the findings of Serniclaes et al. (2001; 2004) of better within-category discrimination in DYS children. The AR and DYS groups did not differ when across-category discrimination was evaluated adaptively, or for the two tests of word perception in noise.
Prevalence of poor perceivers
As some studies have found that only a subset of DYS children show perceptual deficits (e.g. Adlard et al., 1998; Manis et al., 1997; McArthur, Ellis, Atkinson, & Coltheart, 2008), it is important to look at individual performance, in order to evaluate how many of the DYS children were performing below norm. Therefore, the proportion of participants in each group performing poorly relative to age-matched peers was determined, and the prevalence of poor perceivers in the DYS group compared to that in the AR group. To do this, age-corrected z-scores were calculated for each task and listener in the AR group by taking the residual of the linear fits to the AR data and then dividing by the standard deviation of the raw residuals. Data were mostly normally distributed in the AR group and appropriate transforms were made when necessary. This results in a measure of auditory performance with no correlation with age, and a mean and standard deviation close to 0 and 1 respectively. When age was not a significant factor, a simple z-score based only on the mean and standard deviation of the scores of the AR, ignoring age, was used. Z-scores for the DYS participants were calculated in the same way using values derived from the AR group.
As in Ramus et al. (2003), poor perceivers were defined as scoring at least 1.65 standard deviations below the AR mean on each test (theoretically below the 5th percentile). The overall proportion of poor perceivers in each group and task are presented in Table 3.
Table 3.
Proportion of “poor perceivers” in the average reader and the dyslexic groups (calculated over participants who took the test only). For each task, this is defined as the percentage of individuals scoring 1.65 standard deviation below the mean for the AR group
| Average Reader | Dyslexic | ||
|---|---|---|---|
|
Discrimination in quiet |
FixedAC-Q | 7% | 40% |
| AdaptAC-Q | 0% | 0% | |
|
| |||
| FixedWC-Q | 5% | 14% | |
| AdaptWC-Q | 6% | 32% | |
|
| |||
| Identification | ID-Q | 8% | 18% |
| ID-N | 6% | 5% | |
|
| |||
| Discrimination | AdaptWC-N | 6% | 11% |
| Speech | WiN | 6% | 8% |
| In noise | WiniCS | 8% | 2% |
There was a relatively small difference in the proportion of poor perceivers in the DYS and AR groups, except for two tasks. More than five times as many DYS as AR children were classified as poor perceivers for the FixedAC-Q (40% vs. 7%) and for the AdaptWC-Q (32% vs. 6%). It is also notable that more than twice as many DYS as AR were classified as poor perceivers for the ID-Q test (18% vs. 8%) and for the FixedWC-Q (14% vs. 5%). Nevertheless, it is noteworthy that, for each of the speech perception tasks, the majority of the DYS children scored within the normal range for their age.
Table 4 provides an overview of individual performances and allows us to identify those who performed below norm on a task. As can be seen, a much higher proportion of AR children performed within norm for all tests relative to the DYS group. Therefore a child will be more likely to perform below norm on a task across a range of speech perception tests if dyslexic. However, in order to conclude that this is due to a deficit in speech processing abilities, poor performances would be expected across several tasks testing the same speech perceptual ability. Therefore, individual performance was also examined within each ability tested. Evidence of consistent difficulty of both groups across four perceptual abilities was considered: categorical labeling (ID-n, ID-Q), discrimination across category (AdaptAC-Q, FixedAC-Q), discrimination within category (AdaptWC-Q, FixedWC-Q), and perception of naturally-produced words in noise (WiN, WiNiCS).
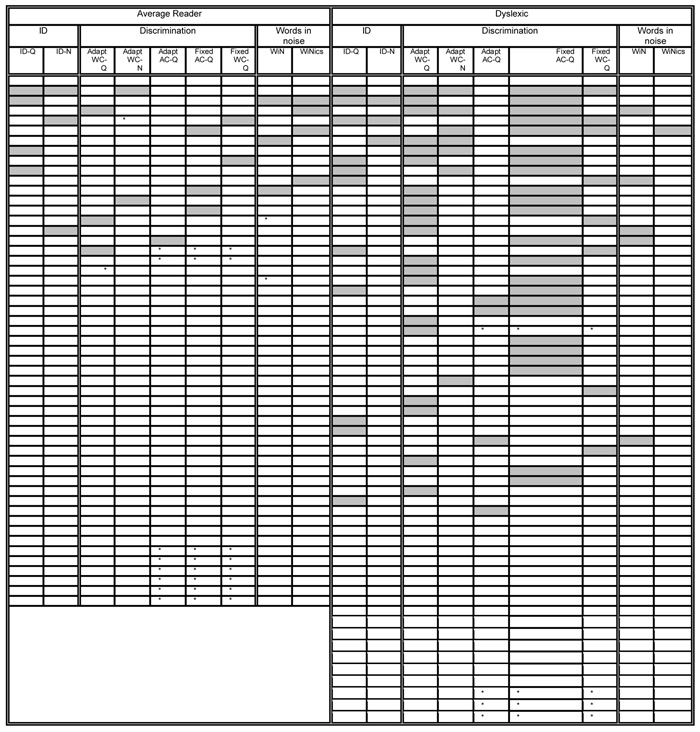
Table 4.
Poor and good perceivers in each task presented individually for the 51 average reading children and the 62 children with dyslexia: each row represent a listener, grey cells represent scores within the ‘below norm’ range, empty cells represent score within the normal range, * represents scores that could not be collected.
|
In categorical labelling, a child having problems identifying speech in quiet should also be expected to experience difficulties in more difficult noisy conditions. Within the AR group, 4 children are below norm for ID-Q but only one of those is also below norm for ID-N. In the DYS group, 11 children are below norm in quiet and only two of those are also below norm in noise. For the discrimination tasks, one would expect that if poor performance is linked to weak perceptual skills, rather than to task-related difficulties, it should be evident whether an adaptive or fixed-step procedure was used. 23 DYS and 3 AR individuals performed below norm when across-category discrimination was tested using a fixed-step procedure, but only 2 DYS and none of the AR individuals amongst those performed below norm in the adaptive condition. A similar trend was observed for within-category discrimination: 2 DYS children and none of AR performed below norm in both the fixed and adaptive tasks. Finally, as WiN and WiNiCS both tested the perception of lexical items in background noise, consistent performance across both of these tasks could be expected. However, none of the 5 DYS children and 1 out of the 3 children who performed below norm on WiN also performed poorly on WiNiCs.
Are measures of speech perception related to reading, phonological processing, nonverbal IQ and/or language?
Significant group differences in some speech perception tasks cannot, of course, be taken as direct evidence that deficits in those tasks are causal to (or caused by) a reading (or any other cognitive) deficit. Such claims would be much strengthened if correlations between those skills were significant. We therefore calculated correlations for all 9 speech perceptual measures against the two reading scores (words and pseudo-words), non-verbal IQ, the two measures of language (TROG and BPVS) and the three measures of phonological processing (rhyme, spoonerisms and CNRep). All measures were normalized for age either using published norms (TROG, BPVS, TOWRE, non-verbal IQ) or results from the AR group. With these 72 comparisons, we would expect about 4 significant correlations at the 0.05 level simply by chance in the absence of any genuine relationships. Instead of using the exceedingly conservative Bonferroni correction, we thus reduced the significance threshold to 0.01, so that the expected number of significant correlations due solely to chance was less than 1. One-tailed tests were used because of our prior expectations of how these variables should be related. Rosen (2003) has argued that if auditory deficits are the prime cause of dyslexia (or reading abilities more generally), strong correlations would be expected between auditory processing and reading skills not only across the entire population, but also within groups of controls and dyslexics. Correlations were therefore calculated within groups. Only one correlation was significant in the AR group: that between non-verbal IQ and FixedAC-Q. As this was the only speech perception measure to correlate with non-verbal IQ (even at the 0.05 level), little can be inferred from it. Quite different results were obtained in the DYS group. AdaptAC-Q was correlated with rhyme, but much more strikingly, FixedAC-Q was correlated at p<0.005 with four of the reading-related tasks (words, pseudo-words, rhyme and spoonerisms, r=0.32-0.37). We focus only on the relationship of this speech perception measure to pseudo-word reading because deficits in the latter are a central feature of dyslexia, but consideration of the other reading-related abilities leads to the same general conclusions.
Figure 6 shows the relationship between these two abilities. Regression analyses like the ones used above show that both group and FixedAC-Q performance are significant predictors of pseudo-word reading ability, with an insignificant interaction. Therefore, the relationship between these two skills appears to be the same in children with and without dyslexia. However, although FixedAC-Q has some predictive value, it is very weak. Group membership alone accounts for 75% of the variance in pseudo-word reading, and once this is entered into the regression, FixedAC-Q accounts for only 2% more of the variance (see Rosen, 2003 for other examples of this kind of analysis). This weak predictive power of FixedAC-Q is apparent in Figure 6, which shows a very small degree of overlap between the two groups in pseudo-word reading (as would be expected) but a great degree of overlap in performance for the perceptual measure (although very low performance on this task, with z<-2, appears to be restricted to children with dyslexia). In other words, knowing a child’s performance on FixedAC-Q would not allow a reliable inference about the reading ability of that child.
Figure 6.

Scatterplot showing the relationship between standardized scores in pseudoword reading and standardized scores in FixedAC-Q.
To summarize, there appears to be only one speech perception measure with any significant degree of correlation with reading-related abilities, and this is not very informative about them.
Discussion
The results of the present study suggest that the claim that children with dyslexia show deficits in speech perception should be tempered. Significant group differences were certainly observed in 4 out of 9 speech perception tasks, mirroring significant group effects in many previous studies. However, in order to claim that individual children show a deficit in speech perception, one would like to see evidence of consistent poor performance across different speech perception tasks that tap the same processing ability. Children within the DYS group who were poor performers in one task type did not show consistent weakness across similar tasks, when the ability to categorize, to discriminate within and across-category and to perceive words in noise was examined. It was also the case that numerous AR children performed below norm in at least one type of task. In addition, DYS children who performed poorly in quiet only rarely performed poorly on the same task in more difficult noisy conditions; if poor performance in quiet was due to poorly established phonological representations, one would expect the addition of noise to further stress speech processing abilities. There was also little evidence of any correlation between performance on speech perception tasks and performance on reading or phonological processing abilities, except for a moderate link between reading-related skills and the fixed across-category discrimination task in quiet.
Participants spanned a wide age range so that we could observe the effect of age on differences between DYS and AR children. Consistent with other studies (Hazan & Barrett, 2000; Parnell & Amerman, 1978), the experimental design was sufficiently powerful to signal significant improvements with age in several experimental tasks. However, no age by group interactions were noted for any of the experimental tasks except for the AdaptWC-Q task, where jnds decreased with age in the AR but not in the DYS children who were less rather than better able to discriminate within-category relative to AR children. Except for this task, developmental trends were evident in the speech perception tasks administered but were similar in DYS and AR children. In addition, there was no evidence that below-norm performance correlated with age in DYS participants, indicating that whenever a deficit was found, the size of it did not change with age.
Modest evidence of speech perception deficits in DYS children
Previous evidence of speech perception deficits in DYS children had been found for categorical identification tasks, with less consistent identification in DYS children (Godfrey, Syrdal-Lasky, Millay, & Knox, 1981; Serniclaes et al., 2001; Werker et al., 1987). As in previous studies, which all derived the slope of the identification function from all the items presented, the DYS group showed significantly shallower slopes relative to AR when stimuli were presented in quiet. However, identification slopes for the DYS group increased significantly when catch trials were excluded and further improved when only the steepest portion of the function corresponding to responses to ambiguous stimuli was fitted. A separate analysis of the interspersed catch trials indicated that DYS children more often mislabelled these clear exemplars (5.6% averaged over all trials) than did AR children (just under 2%). Although it could be argued that these errors are simply another reflection of the less robust phonological categories claimed to characterize the DYS children (as promulgated, for example, by Ziegler and colleagues, 2009), the fact that errors in identifying clear exemplars increased significantly over the course of the task (Figure 2) makes it more likely they result from inattention caused by fatigue. These lapses in attention would affect the labeling of all stimuli, of course, but they would only be clearly identifiable for ‘easy’ regions of the continuum, where consistent labelling is expected. In short, at least part of the group differences in identification performance may result from a greater susceptibility to lapses in attention in the DYS group (Moore, Ferguson, Halliday, & Riley, 2008).
Other evidence of a speech perception deficit in DYS individuals had come from poorer across-category discrimination abilities relative to age-matched controls, using paradigms involving fixed (Godfrey et al., 1981; Serniclaes et al., 2001; Werker et al., 1987) or adaptive modes of presentation. Poorer discrimination was observed in the DYS group for the across-category pairs in the fixed-interval task presented in quiet, which correlated with a number of reading-related skills in the dyslexic group. However, when across-category discrimination was tested adaptively no group difference was obtained, despite the high power of the test. Differences in performance across the fixed and adaptive tasks could be explained by a number of factors. The adaptive procedure starts by presenting clear ‘pea’ and ‘bee’ stimuli and progresses towards the phoneme boundary, presenting more ambiguous items, until a certain threshold of correct discrimination is reached. On the other hand, the fixed procedure presented 108 trials, which included 72 trials that were phonemically-identical (i.e. within-category) and 32 cross-category trials where stimuli could potentially be discriminated. The higher proportion of ‘difficult’ stimulus pairs in the fixed procedure could have lowered some listeners’ expectation to perceive a difference, while the consistent cross-category presentations in the adaptive procedure might have kept up their level of interest, thus leading to a more genuine reflection of their speech perception abilities. It could also be the case that the shorter adaptive procedure relies less heavily on extraneous factors such as attention than the fixed discrimination procedure, which was twice as long. In addition, it should be noted that AR children out-performed DYS children in the discrimination of within-category differences, which does not require the processing of phonologically-distinct information and relies more on general perceptual acuity. This further supports the argument that discrimination is more demanding for DYS than for AR children because of task-related factors rather than poor discrimination of the phonological properties of the stimuli.
Our study also allowed us to assess the hypothesis that speech perception difficulties in DYS children are due to the fact that they perceive allophones rather than the phonemes of their native language (Bogliotti et al., 2008; Serniclaes et al., 2004). The allophonic theory of dyslexia claims that ‘phonetic features that are not relevant for native language phonology remains discriminable’ (Bogliotti et al., 2008, p. 140), and relies on evidence that DYS children show increased within-category discrimination relative to chronological-age matched AR children (Godfrey et al., 1981; Serniclaes et al., 2004; Werker et al., 1987). This allophonic perception is claimed to be ‘a consequence of a deviant perceptual development during early childhood’ as evidenced by a secondary non-native discrimination peak in DYS but not in AR children, located at boundaries discriminated by infants. The type of evidence supporting an allophonic mode of perception is therefore twofold: one involves within-category variation of phonemic contrasts of a given language and is a consequence of the other, which entails within-category variations that only infants are predisposed to perceiving. Our data, along with others (Ramus & Szenkovits, 2008; van Beinum, Schwippert, Been, van Leeuwen, & Kuijpers, 2005), tested the first kind of evidence and failed to show any enhanced sensitivity to within-category variation in DYS children in either of the test procedures used. If anything, AR children were better able to discriminate within-category than DYS children. Nevertheless, we should be cautious about concluding that this result completely invalidates the allophonic mode of speech perception. Indeed, it could be the case that DYS children would have been more sensitive to within-category variation in the negative VOT range that infants discriminate (Lasky, Syrdal-Lasky, & Klein, 1975) rather than in the positive VOT range tested here. However, this result questions the link between the two types of evidence and whether allophonic perception can lead to difficulties in phoneme-to-grapheme correspondences if it only occurs for a very small number of phoneme contrasts.
The DYS group did not experience greater difficulty for the identification of the ‘pea’-‘bee’ stimuli in noise which is at odds with a speech perception account of their impairment. In addition, no group differences were noticeable between DYS and AR children in other ‘speech in noise’ tasks that did not rely on the presentation of the ‘pea’-‘bee’ continuum such as the WiN and WiNiCS tasks. The WiN and the WiNiCS tasks involved independent sets of highly-familiar words that had an age of acquisition suitable for the present population in order to counter the effect of vocabulary knowledge. If the phonological processing difficulty of the DYS group was mediated by poor speech processing in quiet or in noise, the access to phonological representations when retrieving frequent words from the lexicon should be disrupted in noisy conditions, and this disruption should lead to higher speech reception thresholds for such words in noise. However, in neither task were the DYS children more prone to the disruptive effect of noise than AR. Snowling et al. (1986) also failed to observe any differential effect of noise on the identification of highly-frequent words in DYS children.
Individual results
Relative to AR, a larger proportion of DYS children experienced difficulty with at least one task of the battery of tests presented. However, amongst poor DYS perceivers, difficulty in one task did not reflect consistent and general difficulties in processing speech. For the large majority of DYS listeners who performed below norm, poor performance in one task was only rarely associated with similar difficulties in a different task tapping the same speech perceptual ability. Therefore, poor speech perception scores in the majority of the DYS children could be more related to difficulties with task demand. Other studies have also concluded that speech perception is unlikely to play a significant role in reading development in children and adults (Hazan et al., 2009; Ramus et al., 2008; Robertson, Joanisse, Desroches, & Stella, ; Watson & Kidd, 2008). Robertson, Joanisse, Desroches and Stella (2009) also failed to find speech perception deficits in DYS children using similar categorical perception tasks in quiet and in noise. However, DYS children who had additional Speech and Language Impairment (SLI) experienced speech perception difficulties consistent with previous findings by Joanisse, Manis, Keating and Seidenberg (2000), more particularly when noise was presented in the background. Note that our study specifically excluded children with additional SLI or ADHD while not all studies have used such strict selection criteria.
It is interesting to consider how our child data compare to those obtained when the same test battery was presented to a group of DYS and AR adults. Hazan et al. (2009)reported few significant group differences, with the exception of within- and across-category discrimination when tested using a fixed-level procedure. For the fixed-level procedure task, AR outperformed DYS adults, while no group differences were obtained when the same speech stimuli were used in adaptive tasks. However, as with the children tested in this study, a very small minority of DYS adults experienced consistent difficulties across tasks, and poor performance in quiet did not lead to poor performance in noise. Hazan et al. (2009) had concluded that their data gave weak support for a speech perception deficit in dyslexia, and suggested that some individuals with dyslexia have speech perceptual acuity that is at the lower end of the normal range and exacerbated by non-sensory factors. The results obtained here with DYS and AR children are consistent with this view.
Future studies investigating perception in children with dyslexia would benefit from including a comprehensive assessment of attention abilities in order to tease apart the role of extraneous factors from that of perception. Further investigations on the role of speech perception abilities on impaired phonological development would also gain from investigating individual variability and the contribution of non-sensory factors on the performances of children with dyslexia with co-morbid SLI.
Acknowledgements
This study was supported by the Wellcome Trust (076499/Z/05/Z). The authors thank Mike Coleman who designed the testing software used in this study and Steve Nevard for technical support. Many thanks are also due to Christian Ritz for his generous assistance in providing advice concerning the use of his statistical package ‘drc’.
Finally, the authors would like to thank the participants and their family for their help as well as the following schools and their staff: Ellesmere College, Northease Manor School, Abingdon House School, Hazlegrove Preparatory School, Hurst Lodge, Mayville High School, Prior Park College, Trinity School, Sidcot School, Appleford School, Knowl Hill School, Calder House School, Edington & Shapwick School, Thomas’ Battersea, St Christopher’s School, Riddlesworth Hall school.
Footnotes
3 AR participants had a standard score of 93, 96 and 97 when tested on the Form A of the TOWRE reading test, but discussion with parents and teachers indicated that they were excellent pupils and avid readers. This was confirmed in a second testing session 7 months later, when their reading scores were 100, 117 and 117 respectively on the Form B of the same test. Therefore, it was judged that they were average to good readers who might have underperformed the first time they were assessed.
Given the greater decay in memory trace in tasks relying on non lexical items (Hulme, Newton, Cowan, Stuart, & Brown, 1999; Hulme et al., 1997), we intentionally used highly familiar words in all experimental tests to assess more directly speech perception abilities and circumvent the detrimental effect of memory which could obscure the interpretation of group differences.
Pre-testing of the fixed procedure amongst 20 university students without dyslexia indicated that the /bi/ endpoint of the continuum with 0 ms VOT was unusually discriminable from other stimuli located in the /bi/ portion of the continuum. Examination of its spectrogram indicated that the first 5 ms of transition were rising sharply, making this stimulus acoustically discriminable from the remaining /bi/ exemplars with flatter transitions trajectory. /bi/ stimuli with VOT less than 5 ms were excluded and an extra /pi/ stimulus of 65 ms VOT was created to reproduce a 60 ms VOT range similar to that used in the other discrimination tasks.
As individual lexical items are differently affected by noise, some being much more robust than others and so able to be identified at lower SNRs we performed a preliminary calibration study which allowed the determination of a ‘correction factor’, uniquely specified for each word, to lead to similar levels of performance across words. This manipulation makes the adaptive track behave better resulting in more accurate estimates of thresholds.
Slopes in noise of one dyslexic participant with a negative value were not transformable using a logarithmic scale and was instead given the lowest log-transformed slope observed in the sample
References
- Adlard A, Hazan V. Speech perception in children with specific reading difficulties (dyslexia) Quarterly Journal of Experimental Psychology. 1998;51:153–177. doi: 10.1080/713755750. [DOI] [PubMed] [Google Scholar]
- Bishop DVM. Test for the reception of grammar - Electronic (TROG-E) Harcourt Assessment; 2005. [Google Scholar]
- Blomert L, Mitterer H, Paffen C. In search of the auditory, phonetic, and/or phonological problems in dyslexia: Context effects in speech perception. Journal of Speech Language and Hearing Research. 2004;47:1030–1047. doi: 10.1044/1092-4388(2004/077). [DOI] [PubMed] [Google Scholar]
- Boada R, Pennington BF. Deficient implicit phonological representations in children with dyslexia. Journal of Experimental Child Psychology. 2006;95:153–193. doi: 10.1016/j.jecp.2006.04.003. [DOI] [PubMed] [Google Scholar]
- Boets B, Ghesquiere P, van Wieringen A, Wouters J. Speech perception in preschoolers at family risk for dyslexia: Relations with low-level auditory processing and phonological ability. Brain and Language. 2007;101:19–30. doi: 10.1016/j.bandl.2006.06.009. [DOI] [PubMed] [Google Scholar]
- Bogliotti C, Serniclaes W, Messaoud-Galusi S, Sprenger-Charolles L. Discrimination of speech sounds by children with dyslexia: Comparisons with chronological age and reading level controls. Journal of Experimental Child Psychology. 2008;101:137–155. doi: 10.1016/j.jecp.2008.03.006. [DOI] [PubMed] [Google Scholar]
- Bolia RS, Nelson WT, Ericson MA, Simpson BD. A speech corpus for multitalker communications research. Journal of the Acoustical Society of America. 2000;107:1065–1066. doi: 10.1121/1.428288. [DOI] [PubMed] [Google Scholar]
- Brady S, Schankweiler D, Mann V. Speech perception and memory coding in relation to reading ability. Journal of Experimental Child Psychology. 1983;35:345–367. doi: 10.1016/0022-0965(83)90087-5. [DOI] [PubMed] [Google Scholar]
- Brandt J, Rosen JJ. Auditory phonemic perception in dyslexia - Categorical identification and discrimination of stop consonants. Brain and Language. 1980;9:324–337. doi: 10.1016/0093-934x(80)90152-2. [DOI] [PubMed] [Google Scholar]
- Chiappe P, Chiappe DL, Siegel LS. Speech perception, lexicality, and reading skill. Journal of Experimental Child Psychology. 2001;80:58–74. doi: 10.1006/jecp.2000.2624. [DOI] [PubMed] [Google Scholar]
- Cohen J. Statistical power analysis for the behavioral sciences. Erlbaum; Hillsdale, NJ: 1988. [Google Scholar]
- Cook D, Weisberg S. Applied Regression Including Computing and Graphics. John Wiley & Sons; 1999. [Google Scholar]
- De Cara B, Goswami U. Similarity relations among spoken words: The special status of rimes in English. Behavior Research Methods Instruments & Computers. 2002;34:416–423. doi: 10.3758/bf03195470. [DOI] [PubMed] [Google Scholar]
- de Gelder B, Vroomen J. Impaired speech perception in poor readers: Evidence from hearing and speech reading. Brain and Language. 1998;64:269–281. doi: 10.1006/brln.1998.1973. [DOI] [PubMed] [Google Scholar]
- Dunn L, Dunn L, Whetton C, Burley J. British Picture Vocabulary Scale II. NFER-Nelson; Windsor: 1998. [Google Scholar]
- Erdfelder E, Faul F, Buchner A. GPOWER: A general power analysis program. Behavior Research Methods Instruments & Computers. 1996;28:1–11. [Google Scholar]
- Frederickson N, Frith U, Reason R. PHonological Assessment Battery. NFER-Nelson; Windsor: 1997. [Google Scholar]
- Gathercole SE, Willis CS, Baddeley AD, Emslie H. The Children’s test of Nonword Repetition: a test of phonological working memory. Memory. 1994;2:103–127. doi: 10.1080/09658219408258940. [DOI] [PubMed] [Google Scholar]
- Godfrey JJ, Syrdal-Lasky AK, Millay KK, Knox CM. Performance of dyslexic children on speech perception tests. Journal of Experimental Child Psychology. 1981;32:401–424. doi: 10.1016/0022-0965(81)90105-3. [DOI] [PubMed] [Google Scholar]
- Goswami U. Why theories about developmental dyslexia require developmental designs. Trends in Cognitive Sciences. 2003;7:534–540. doi: 10.1016/j.tics.2003.10.003. [DOI] [PubMed] [Google Scholar]
- Goswami U, Thomson J, Richardson U, Stainthorp R, Hughes D, Rosen S, et al. Amplitude envelope onsets and developmental dyslexia: A new hypothesis. Proceedings of the National Academy of Sciences of the United States of America. 2002;99:10911–10916. doi: 10.1073/pnas.122368599. [DOI] [PMC free article] [PubMed] [Google Scholar]
- Hazan V, Barrett S. The development of phonemic categorization in children aged 6-12. Journal of Phonetics. 2000;28:377–396. [Google Scholar]
- Hazan V, Messaoud-Galusi S, Rosen S, Nouwens S, Shakespeare B. Speech Perception Abilities of Adults With Dyslexia: Is There Any Evidence for a True Deficit? Journal of Speech Language and Hearing Research. 2009;52:1510–1529. doi: 10.1044/1092-4388(2009/08-0220). [DOI] [PubMed] [Google Scholar]
- Hulme C, Newton P, Cowan N, Stuart G, Brown G. Think before you speak: Pauses, memory search, and trace redintegration processes in verbal memory span. Journal of Experimental Psychology-Learning Memory and Cognition. 1999;25:447–463. doi: 10.1037//0278-7393.25.2.447. [DOI] [PubMed] [Google Scholar]
- Hulme C, Roodenrys S, Schweickert R, Brown GDA, Martin S, Stuart G. Word-frequency effects on short-term memory tasks: Evidence for a redintegration process in immediate serial recall. Journal of Experimental Psychology-Learning Memory and Cognition. 1997;23:1217–1232. doi: 10.1037//0278-7393.23.5.1217. [DOI] [PubMed] [Google Scholar]
- Joanisse MF, Manis FR, Keating P, Seidenberg MS. Language deficits in dyslexic children: Speech perception, phonology, and morphology. Journal of Experimental Child Psychology. 2000;77:30–60. doi: 10.1006/jecp.1999.2553. [DOI] [PubMed] [Google Scholar]
- Karmiloff-Smith A. Development itself is the key to understanding developmental disorders. Trends in Cognitive Sciences. 1998;2:389–398. doi: 10.1016/s1364-6613(98)01230-3. [DOI] [PubMed] [Google Scholar]
- Karmiloff-Smith A, Scerif G, Ansari D. Double dissociations in developmental disorders? Theoretically misconceived, empirically dubious. Cortex. 2003;39:161–163. doi: 10.1016/s0010-9452(08)70091-1. [DOI] [PubMed] [Google Scholar]
- Klatt DH. Software for a cascade-parallel formant synthesizer. Journal of the Acoustical Society of America. 1980;67:971–995. [Google Scholar]
- Lasky RE, Syrdal-Lasky AK, Klein RE. VOT discrimination by 4 to 6 1/2 month-old infants from spanish environments. Journal of Experimental Child Psychology. 1975;20:215–225. doi: 10.1016/0022-0965(75)90099-5. [DOI] [PubMed] [Google Scholar]
- Levitt H. Transformed up-down methods in psychoacoustics. Journal of the Acoustical Society of America. 1971;49:467. [PubMed] [Google Scholar]
- Liberman IY, Shankweiler D, Liberman M, Fowler C, Fischer FW. Phonetic segmentation and recoding in the beginning readers. In: Reber AS, Scarborough DL, editors. Toward a Psychology of Reading The Proceeding of the CUNY Conferences. N J Erlbaum; Hillsdale: 1977. pp. 207–226. [Google Scholar]
- Lisker L, Abramson A. The voicing dimension: some experiments in comparative phonetics; Proceedings of the Sixth International Congress of Phonetic Sciences, Prague, 1967; 1970. [Google Scholar]
- Manis FR, McBrideChang C, Seidenberg MS, Keating P, Doi LM, Munson B, et al. Are speech perception deficits associated with developmental dyslexia? Journal of Experimental Child Psychology. 1997;66:211–235. doi: 10.1006/jecp.1997.2383. [DOI] [PubMed] [Google Scholar]
- Mayo C, Scobbie JM, Hewlett N, Waters D. The influence of phonemic awareness development on acoustic cue weighting strategies in children’s speech perception. Journal of Speech Language and Hearing Research. 2003;46:1184–1196. doi: 10.1044/1092-4388(2003/092). [DOI] [PubMed] [Google Scholar]
- McArthur GM, Ellis D, Atkinson CM, Coltheart M. Auditory processing deficits in children with reading and language impairments: Can they (and should they) be treated? Cognition. 2008;107:946–977. doi: 10.1016/j.cognition.2007.12.005. [DOI] [PubMed] [Google Scholar]
- McBrideChang C. Models of speech perception and phonological processing in reading. Child Development. 1996;67:1836–1856. [PubMed] [Google Scholar]
- McBrideChang C. Children’s literacy development. Oxford Press; London: 2006. [Google Scholar]
- Mody M, Studdert-Kennedy M, Brady S. Speech perception deficits in poor readers: Auditory processing or phonological coding? Journal of Experimental Child Psychology. 1997;64:199–231. doi: 10.1006/jecp.1996.2343. [DOI] [PubMed] [Google Scholar]
- Moore DR, Ferguson MA, Halliday LF, Riley A. Frequency discrimination in children: Perception, learning and attention. Hearing Research. 2008;238:147–154. doi: 10.1016/j.heares.2007.11.013. [DOI] [PubMed] [Google Scholar]
- Nittrouer S. Do temporal processing deficits cause phonological processing problems? Journal of Speech Language and Hearing Research. 1999;42:925–942. doi: 10.1044/jslhr.4204.925. [DOI] [PubMed] [Google Scholar]
- Parnell MM, Amerman JD. Maturational Influences on Perception of Co-Articulatory Effects. Journal of Speech and Hearing Research. 1978;21:682–701. doi: 10.1044/jshr.2104.682. [DOI] [PubMed] [Google Scholar]
- Ramus F, Rosen S, Dakin SC, Day BL, Castellote JM, White S, et al. Theories of developmental dyslexia: insights from a multiple case study of dyslexic adults. Brain. 2003;126:841–865. doi: 10.1093/brain/awg076. [DOI] [PubMed] [Google Scholar]
- Ramus F, Szenkovits G. What phonological deficit? Quarterly Journal of Experimental Psychology. 2008;61:129–141. doi: 10.1080/17470210701508822. [DOI] [PubMed] [Google Scholar]
- Ramus F, White S, Frith U. Weighing the evidence between competing theories of dyslexia. Developmental Science. 2006;9:265–269. doi: 10.1111/j.1467-7687.2006.00483.x. [DOI] [PubMed] [Google Scholar]
- Robertson EK, Joanisse MF, Desroches AS, Ng S. Categorical speech perception deficits distinguish language and reading impairments in children. Developmental Science. 2009;12:753–767. doi: 10.1111/j.1467-7687.2009.00806.x. [DOI] [PubMed] [Google Scholar]
- Robertson EK, Joanisse MF, Desroches AS, Stella NG. Categorical speech perception deficits distinguish language and reading impairments in children. Developmental Science. doi: 10.1111/j.1467-7687.2009.00806.x. in press. [DOI] [PubMed] [Google Scholar]
- Rosen S. Auditory processing in dyslexia and specific language impairment: is there a deficit? What is its nature? Does it explain anything? Journal of Phonetics. 2003;31:509–527. [Google Scholar]
- Rosen S, Manganari E. Is there a relationship between speech and nonspeech auditory processing in children with dyslexia? Journal of Speech Language and Hearing Research. 2001;44:720–736. doi: 10.1044/1092-4388(2001/057). [DOI] [PubMed] [Google Scholar]
- Serniclaes W, Sprenger-Charolles L, Carre R, Demonet JF. Perceptual discrimination of speech sounds in developmental dyslexia. Journal of Speech Language and Hearing Research. 2001;44:384–399. doi: 10.1044/1092-4388(2001/032). [DOI] [PubMed] [Google Scholar]
- Serniclaes W, Van Heghe S, Mousty P, Carre R, Sprenger-Charolles L. Allophonic mode of speech perception in dyslexia. Journal of Experimental Child Psychology. 2004;87:336–361. doi: 10.1016/j.jecp.2004.02.001. [DOI] [PubMed] [Google Scholar]
- Snowling M. Dyslexia. Blackwell; Oxford: 2000. [Google Scholar]
- Snowling M, Goulandris N, Bowlby M, Howell P. Segmentation and Speech-Perception in Relation to Reading Skill - A Developmental Analysis. Journal of Experimental Child Psychology. 1986;41:489–507. doi: 10.1016/0022-0965(86)90006-8. [DOI] [PubMed] [Google Scholar]
- Sprenger-Charolles L, Serniclaes W, Cole P. Reading acquisition and developmental dyslexia. Psychology Press; 2006. [Google Scholar]
- Swan D, Goswami U. Phonological awareness deficits in developmental dyslexia and the phonological representations hypothesis. Journal of Experimental Child Psychology. 1997;66:18–41. doi: 10.1006/jecp.1997.2375. [DOI] [PubMed] [Google Scholar]
- Thomas MSC, Annaz D, Ansari D, Scerif G, Jarrold C, Karmiloff-Smith A. Using Developmental Trajectories to Understand Developmental Disorders. Journal of Speech Language and Hearing Research. 2009;52:336–358. doi: 10.1044/1092-4388(2009/07-0144). [DOI] [PubMed] [Google Scholar]
- Torgesen JK, Wagner R, Rashotte C. Test of Word Reading Efficiency (TOWRE) 1999. [Google Scholar]
- van Beinum FJ, Schwippert CE, Been PH, van Leeuwen TH, Kuijpers CTL. Development and application of a /bAk/-/dAk/ continuum for testing auditory perception within the Dutch longitudinal dyslexia study. Speech Communication. 2005;47:124–142. [Google Scholar]
- Vellutino FR, Fletcher JM, Snowling MJ, Scanlon DM. Specific reading disability (dyslexia): what have we learned in the past four decades? Journal of Child Psychology and Psychiatry. 2004;45:2–40. doi: 10.1046/j.0021-9630.2003.00305.x. [DOI] [PubMed] [Google Scholar]
- Watson CS, Kidd GR. Associations between auditory abilities, reading, and other language skills in children and adult. In: Cacace AT, McFarland JT, editors. Controversies in Central Auditory Processing Disorder (CAPD) Plural Publishing; 2008. [Google Scholar]
- Wechsler D. Wechlser Intelligence Scale for Children. Fourth Edition Hartcourt Assessment; 2004. [Google Scholar]
- Werker JF, Tees RC. Speech perception in severely disabled and average reading children. Canadian Journal of Psychology-Revue Canadienne de Psychologie. 1987;41:48–61. doi: 10.1037/h0084150. [DOI] [PubMed] [Google Scholar]
- White S, Milne E, Rosen S, Hansen P, Swettenham J, Frith U, et al. The role of sensorimotor impairments in dyslexia: a multiple case study of dyslexic children. Developmental Science. 2006;9:237–255. doi: 10.1111/j.1467-7687.2006.00483.x. [DOI] [PubMed] [Google Scholar]
- Wichmann FA, Hill NJ. The psychometric function: I. Fitting, sampling, and goodness of fit. Perception & Psychophysics. 2001;63:1293–1313. doi: 10.3758/bf03194544. [DOI] [PubMed] [Google Scholar]
- Windfuhr KL, Snowling MJ. The relationship between paired associate learning and phonological skills in normally developing readers. Journal of Experimental Child Psychology. 2001;80:160–173. doi: 10.1006/jecp.2000.2625. [DOI] [PubMed] [Google Scholar]
- Ziegler JC, Pech-Georgel C, George F, Lorenzi C. Speech-perception-in-noise deficits in dyslexia. Developmental Science. 2009;12:732–745. doi: 10.1111/j.1467-7687.2009.00817.x. [DOI] [PubMed] [Google Scholar]