

Abstract
It has previously been demonstrated that there is a negative correlation between the amplitude of the BOLD response and resting γ amino‐butyric acid (GABA) concentration in visual cortex. The work here is the first to empirically characterize individual variability in the haemodynamic response functions (HRFs) in response to a simple visual stimulus and baseline GABA concentration in a population of young adult males (n = 15, aged 20–28 years). The results demonstrate that GABA concentration is negatively correlated with BOLD response amplitude (r = −0.64, P < 0.02) and positively correlated with HRF width (r = 0.67, P < 0.002), that is, individuals with higher resting GABA concentration tend to exhibit smaller and wider HRFs. No correlations were observed with resting cerebral blood flow and GABA concentration and similarly, no correlations were observed between GABA and the proportional tissue content of the MRS voxel. We argue that correlation of the height of the HRF is supportive of the view that the previously observed correlations between BOLD amplitudes and GABA are reflective of differences in neuronal activity. However, the changes in HRF shape in individuals with higher baseline GABA levels are suggestive that differing vascular response characteristics may also make a significant contribution. Our results reinforce the view that variability in endogenous factors, such as neurotransmitter concentration, can have a profound effect on the vascular haemodynamic response. This has important implications for between‐cohort fMRI studies in which variation in parameters such as GABA concentration may lead to group differences in the BOLD signal. Hum Brain Mapp, 2012. © 2011 Wiley Periodicals, Inc.
Keywords: BOLD, fMRI, spectroscopy, GABA, HRF
INTRODUCTION
Compared with invasive neurophysiological techniques, BOLD fMRI provides low spatial (typically 3 mm length voxels) and low temporal resolution (∼1 s) data on brain function and is only an indirect time‐lagged haemodynamic measure of neural activity. However, the principle advantage of fMRI is that it allows noninvasive in vivo study of the entire human brain. While various elements of neural activity such as multi‐unit spike activity and changes in power in oscillatory frequency bands have been associated with haemodynamic responses [Goense and Logothetis,2008; Logothetis et al.,2001; Scholvinck et al.,2010] it is a complex sequence of neural and vascular events that results in the BOLD response, whose characteristics are influenced by the fMRI techniques used for data acquisition. Given that there are ∼70,000 neurons per mm3 of cerebral cortex (occipital lobe) [Pakkenberg and Gundersen,1997], a (unfiltered) human fMRI voxel as used in this study ([3 mm]3 or 0.027 ml) contains ∼1.9 million neurons, and as such fMRI is best considered as an index of mass neural action in the brain [Logothetis,2008]. The electrical activity in the cerebral cortex is primarily a result of the balanced activity between excitatory glutamatergic cells and inhibitory interneurons utilizing γ amino‐butyric acid (GABA) as a neurotransmitter. This balance between excitatory and inhibitory activity is thought to control both the firing rates of individual neurons [Whittington et al.,1995] within cortical ensembles as well as the emergent properties of these ensembles such as group‐level field potential oscillations [Traub et al.,1996]. The cortical excitation–inhibition balance can be modulated through neuromodulatory systems and it has been proposed that BOLD fMRI, as a measure of mass action in the nervous system, is sensitive to these modulations [Logothetis,2008].
One potential noninvasive means of probing the neurochemical nature of the excitation–inhibition balance is through the use of magnetic resonance spectroscopy (MRS) and, in particular, GABA‐edited MRS, where noninvasive measurements of GABA concentration can be obtained albeit with even coarser spatio‐temporal resolution than BOLD fMRI (voxel extent >1 cm, acquisition time >10 min). It has been recently demonstrated [Muthukumaraswamy et al.,2009] and replicated [Donahue et al.,2010] in human visual cortex that increased levels of baseline GABA across individuals are associated with decreased positive BOLD responses. A similar effect has been experimentally demonstrated in rat somatosensory cortex where inhibition of GABA transaminase with vigabatrin resulted in elevated GABA concentrations and concomitantly decreased positive BOLD responses [Chen et al.,2005]. Conversely, it has been shown in the anterior cingulate cortex that individuals with increased GABA levels display larger negative BOLD responses [Northoff et al.,2007]. Taken together, these studies provide some evidence that MRS can be used to probe the cortical excitation–inhibition balance and that the BOLD response is sensitive to this balance. However, it is unclear how GABA might also directly modulate the vascular factors influencing the haemodynamic response itself. Modulation of the amplitude of the HRF arising from a brief, temporally well‐characterized stimulus would be consistent with neuronal mechanisms, e.g., altered firing rates and synaptic input, whereas influences on the shape might suggest that vascular mechanisms, e.g., vascular time constants, play a role, assuming that the temporal profile of neural responses is similar across volunteers [Payne,2006]. Indeed, there is a significant body of research demonstrating that neuromodulators released by GABAergic interneurons can directly modulate local cerebral blood flow [Buzsaki et al.,2007; Hamel,2006]. To date, no combined BOLD/GABA studies have actually quantified the amplitude and shape of HRFs in a group of individuals and this was therefore the principal goal of the present work. To achieve this, we measured both GABA concentration and BOLD HRFs to visual stimulation at a high temporal sampling resolution (1 s) in 15 participants. A homogenous study population of young adult males was used to reduce potential age and sex‐related variance; for example, it is known that HRFs vary with age [D'Esposito et al.,1999a,b]. As subsidiary goals, we also sought to segment our spectroscopy voxel into tissue compartments to test for potential relationships between voxel composition and GABA concentration. Finally, because the BOLD response amplitude can be modulated by altered baseline CBF during vasodilatory interventions [Brown et al.,2003], we also acquired measures of resting CBF during passive fixation to determine whether this showed any relationship with GABA.
METHODS
Participants
Fifteen males (mean 24.2 years; range 20.3–28.1, std = 2.41) participated in this experiment (labeled P1–P15). Only men were selected due to reports that GABA can change in women over the course of the menstrual cycle [Epperson et al.,2002] and a limited age range was selected to reduce possible age‐related variance [D'Esposito et al.,1999a,b]. All participants had normal or corrected‐to‐normal vision and gave informed consent to participate in the study.
Visual Stimulation Paradigm
Visual stimuli consisting of vertical, stationary, maximum‐contrast, three cycles per degree, square‐wave gratings presented on a mean luminance background. Stimuli were presented in the lower left visual field and subtended 4° both horizontally and vertically, with the upper right corner of the stimulus located 0.5° horizontally and vertically from a small red fixation cross. Participants were instructed to maintain fixation for the entire experiment and, to maintain attention, were instructed to press a response key as fast as possible at the termination of each stimulation period [Muthukumaraswamy et al.,2009; Muthukumaraswamy and Singh,2008,2009]. Each stimulus was presented for 1.5–2 s (randomly chosen from a flat distribution) followed by 18 s of fixation cross only with a total of 45 trials. Presentation software was used to present all stimuli (1024 × 768 pixel resolution, 60 Hz refresh) via a Canon Xeed SX60 LCD projector.
MRI Acquisition Session
For each participant, the following MRI protocols were acquired in the fixed order of:
-
1
15 min BOLD EPI functional scan (partial brain coverage);
-
2
Whole brain EPI scan;
-
3
6 min baseline CBF scan (subjects passively fixating);
-
4
11 min GABA‐edited MRS acquisitions (× 2);
-
5
T1‐weighted structural image (3D Fast spoiled gradient‐echo, [FSPGR]).
Imaging was performed on a 3T GE HDx system.
MRI Methods—fMRI
fMRI data were acquired using a gradient echo EPI sequence taking 15 oblique slices at 3 mm isotropic voxel resolution centered over the primary visual cortex using a 64 × 64 matrix size, echo time of 35 ms, 90° flip angle, and TR of 1 s. fMRI data were analyzed using the FSL software library (http://www.fmrib.ox.ac.uk/fsl/) using the following preprocessing: motion correction using MCFLIRT [Jenkinson et al.,2002]; non‐brain removal using BET [Smith,2002]; spatial smoothing using a Gaussian kernel of FWHM 5 mm; mean‐based intensity normalization of all volumes by the same factor; and high‐pass temporal filtering (Gaussian‐weighted least‐squares straight line fitting, sigma = 50 s). The GLM was used to model a 2/18 s boxcar for each stimulus, after convolution with the canonical HRF. For registration, data were initially registered to a whole‐brain EPI scan and then to the FSPGR scan. Resultant activation maps were thresholded at P < 0.05 (voxel corrected [Worsley,2001]). A medial occipital region of interest (ROI) was then identified by masking the significant activation map with an anatomical ROI defined from Freesurfer [Dale et al.,1999; Fischl et al.,1999] flat maps of the occipital cortex for each participant. This ROI was constrained to follow the borders of the dorsal and ventral calcarine sulcus (see Fig. 1 for an example). The peak positive regression coefficient (BOLD response) in contralateral primary visual cortex was also identified (search constrained to contralateral medial gray matter to avoid draining vessels). From both the functional ROI and the peak location (which was always contained within the ROI), empirical HRFs were derived for both and converted into percentage signal change values. A double gamma function was then fitted to the data using the lsqcurvefit function in MATLAB using the SPM8 canonical HRF parameters as starting values (latency 1 = 6 s, latency 2 = 16 s, dispersion 1 = 1 s, dispersion 2 = 1 s, height ratio = 1:6). From the fitted functions peak amplitude, latency and width (FWHM) estimates were obtained (see Fig. 1d). All correlations in this article are standard Pearson's correlation coefficients presented with confidence intervals derived from bootstrapped estimates (5,000 iterations).
Figure 1.
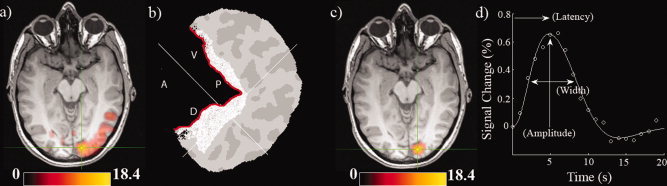
(a) BOLD activation map from Participant 1 (P < 0.05, voxel corrected). Units are z scores. (b) Freesurfer flatmap representation of the right hemisphere posterior occipital cortex of Participant 1. The flatmap has been opened up along the calcarine sulcus (indicated in red). The anatomical region of interest is shaded in white and the white crosshair indicates the peak activation voxel in the fMRI map. Anatomical directions of the calcarine are indicated (A = Anterior, P = Posterior, V = Ventral, D = Dorsal). (c) Similar activation map as (a) after the anatomical mask has been applied. (d) The empirical HRF derived from the activation ROI in (c) along with the fitted function. A schematic of how parameters of amplitude, latency, and width were obtained is included. [Color figure can be viewed in the online issue, which is available at wileyonlinelibrary.com.]
Figure 1 illustrates the fMRI data processing pipeline for one Participant (P1). Panel (a) shows the significant activation (P < 0.05, corrected) for this participant. Panel (b) shows the Freesurfer based flat map from this participant with an anatomical mask drawn around the calcarine sulcus and panel (c) shows the resultant functional map after this anatomical mask was applied; this corresponds to the ROI used for subsequent analysis. Panel (d) shows empirical and fitted HRFs and how summary parameters were obtained.
MRI Methods—Perfusion
Whole brain perfusion was measured using single‐shot pulsed arterial spin labeling proximal inversion with a control for off‐resonance effects (PICORE), Quantitative imaging of perfusion using a single subtraction (QUIPSSII) sequence with GE‐EPI readout [Wong et al.,1998]. Seventy‐one tag‐control image pairs with 16 axial slices (3 × 3 × 7 mm3 voxel resolution, matrix = 64 × 64) were acquired immediately after the fMRI session (TR/TE = 2,200/19.8 ms, single inversion time with TI1 = 700 and TI2 = 1,650–1,750 ms for slices covering the visual ROI). A separate single shot EPI (M 0) scan was acquired (TR = ∞). The signal from white matter was measured using the white matter segmentation as estimated by FAST [Zhang et al.,2001]. The M 0 of blood was estimated from the white matter signal assuming a ratio of the proton density of blood to that in white matter of 1.06 [Wong et al.,1998] and T 1 blood = 1.7 s [Lu et al.,2004], T*2 blood = 0.1 s [Silvennoinen et al.,2003], T*2 white‐matter = 0.047 s [Wansapura et al.,1999]. In‐house software was used to convert the estimate of M 0 of blood and the mean difference of the motion‐corrected (MCFLIRT [Jenkinson et al.,2002]) tag‐control perfusion pair time‐series to CBF maps in ml/100 g/min by applying a standard single compartment model [Wong et al.,1998]. For final quantification, the mean CBF measures from within the spectroscopy voxel, the fMRI activation ROI, and over the entire occipital lobe (using an individually warped standard space mask) were calculated for regions of gray matter only as determined by FAST.
MRI Methods—MRS
GABA‐edited MR spectra were acquired from a 3 × 3 × 3 cm3 volume positioned medially in the occipital lobe using the MEGA‐PRESS method [Mescher et al.,1998] as we have previously published [Muthukumaraswamy et al.,2009]. As shown in Figure 2, the lower face of the voxel was aligned with the cerebellar tentorium and the voxel was positioned so as to avoid including the sagittal sinus and to ensure the volume remained inside the occipital lobe. The following experimental parameters were used: TE = 68 ms; TR = 1,800 ms; 512 transients of 2 k datapoints were acquired in 15 min; a 20 ms Gaussian editing pulse was applied at 1.9 ppm in alternate scans. Phased‐array coil data were combined (using the first point of the unsuppressed water free induction decay signal) and spectra were processed by locally written software. Three hertz exponential line broadening and a high‐pass water filter were applied, and the MEGA‐PRESS difference spectrum was produced. The edited GABA signal at 3 ppm and the unsuppressed PRESS water signal from the excitation volume were integrated and a concentration measurement in institutional units was derived by accounting for the editing efficiency and the T 1 and T 2 relaxation times of water and GABA (derived from phantom measurements using the same sequence parameters). The integral of the GABA peak was calculated automatically using a linear fit of the baseline and a Gaussian fit to the peak itself [Marshall et al.,2000]. Two 15 min measurements were made and the mean concentration measurement for each participant used (see Results).
Figure 2.
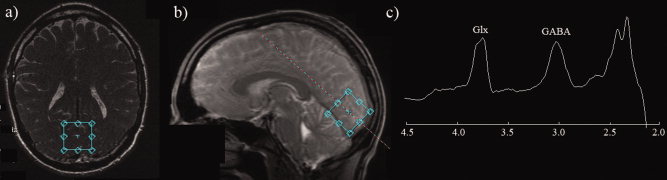
(a,b) Typical location of the 3 × 3 × 3 cm spectroscopy voxel for oblique‐axial and sagittal slices placed on the localiser scan (c) A typical GABA‐edited spectrum obtained from a single acquisition/participant (two spectra were obtained for each participant). A clearly resolved GABA peak is evident at 3 ppm. [Color figure can be viewed in the online issue, which is available at wileyonlinelibrary.com.]
MRI Methods—Structural
For each participant, we obtained a 3D FSPGR scan in an oblique‐axial orientation, with field of view = 256 × 256 × 192 mm3 and matrix = 256 × 256 × 192 to yield 1 mm isotropic voxel resolution (TR/TE = 7.9/3.0 ms; inversion time = 450 ms; flip angle = 20°). FSL's FAST [Zhang et al.,2001] was used to segment the brain into the various tissue compartments. The resulting partial volume probability estimates were used to quantify the proportion of gray/white matter and CSF located in each participant's spectroscopy voxel.
RESULTS
Figure 2 (panels a and b) show an example MRS voxel location as placed on the localizer image for both oblique‐axial and sagittal planes at acquisition time. Panel (c) shows a typical MRS spectrum from a single run from a single participant. For all participants, clearly resolved GABA peaks were evident in the spectra. Extensive single‐subject GABA spectra from this scanner, pulse sequence, and region, including reliability analyses, have already been published in several papers [Edden et al.,2009; Evans et al.,2010; Muthukumaraswamy et al.,2009; Sumner et al.,2010]. For the present data, because we had two spectra for each participant, we examined the repeatability and usefulness of the GABA measures. To formally assess the within‐session reliability of our GABA concentration measures, intraclass correlation coefficients were calculated [Shrout and Fleiss,1979] using SPSS. For a single measure the ICC = 0.772 (95% CI = 0.458–0.916; F = 7.77, P < 0.001) and for averaged measures ICC = 0.871 (95% CI = 0.628 to 0.956). Based on this, it is clear that GABA concentration was a reliable measure and appropriate to use in correlational analyses with other variables. Given these results, averaged GABA concentration values for each participant were subsequently used.
Statistically significant BOLD responses were found in every participant. Images showing ROI's and associated peak activation voxels in each participant can be found in Supporting Information Figure 1. Figure 3 shows the obtained HRFs for each participant in the experiment excluding P12, whose fMRI data was excluded due to excessive head motion. The HRFs in Figure 3 were obtained from the activation ROI in contralateral visual cortex near the calcarine sulcus. Clear HRFs are evident for all participants and differences in the heights of the first gamma function are clearly evident in the plots. It can be visually observed that the presence of a post‐stimulus undershoot was somewhat variable across the participants [Aguirre et al.,1998; Sadaghiani et al.,2009]. HRFs from the activation ROI showed good fits to the data with a mean percentage variance accounted for of 98.6% (std = 1.41%; range = 95.0%–99.8%). The mean peak amplitude (% signal change) for ROI‐based HRFs was 0.88% (std = 0.19%), with a latency of 5.6 s (std = 0.78 s) and a FWHM of 5.39 s (std = 0.63 s). Supporting Information Figure 2 displays HRFs computed from the peak activation voxel in each participant. HRFs from the peak activation voxel also showed good fits to the data with a mean percentage variance accounted for of 97.8% (std = 2.50%; range = 91.0%–99.7%). The mean peak amplitude (% signal change) for peak voxel HRFs was 2.07% (std = 0.69%), with a latency of 5.8 s (std = 0.83 s) and a FWHM of 5.47 s (std = 0.49 s).
Figure 3.
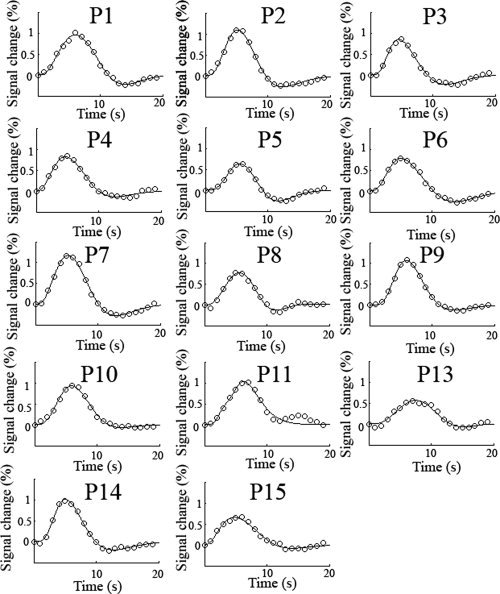
Experimentally obtained HRFs from the activation ROI for each participant along with the fitted function. HRFs from the peak voxel location can be found in the Supporting Information. The TR was 1 s. Clear HRFs are present for each participant although significant variability can seen visually in the amplitude and shape of the HRF as they all share the same axis scaling. P12 was excluded from the fMRI analysis due to excessive head motion.
Figure 4 plots the correlation of the fitted HRF amplitude, latency and width estimates with GABA concentration for the ROI (a) and for the peak activation voxel (b). For the activation ROI, the amplitude of the HRFs showed a significant correlation with GABA concentration (r = −0.64, P < 0.02, CI = −0.84 to −0.14) as did FWHM (r = 0.67, P < 0.002, CI = 0.15 to 0.96), however, peak latency did not (r = 0.43, P = 0.13, CI = −0.25 to 0.85). For the peak voxel, the amplitude of the HRFs showed a significant correlation with GABA concentration (r = −0.78, P < 0.001, CI = −0.93 to −0.42) as did peak latency (r = 0.73, P < 0.003, CI = 0.40 to 0.90), however, FWHM did not (r = 0.42, P = 0.14, CI = 0.01 to 0.75). Note; for both analyses neither the latency nor the dispersion of each of the two component gamma functions in the HRF model correlated with GABA—only the total fitted function revealed these correlations.
Figure 4.
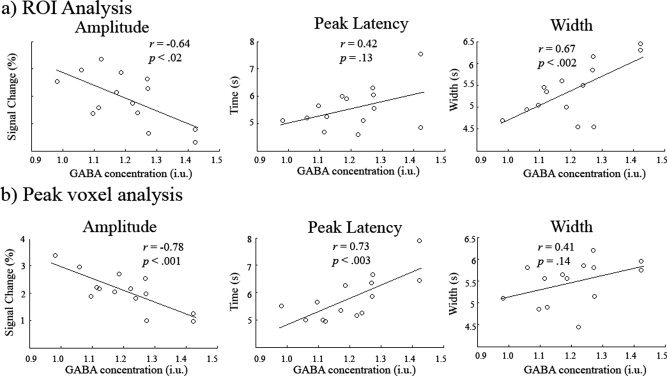
Scatter plots showing the correlation of HRF amplitude, peak latency and width (FWHM of the peak) with GABA concentration for the ROI analysis (a) and for the peak voxel (b). In both cases amplitude was negatively correlated with GABA concentration. Confidence intervals for the r values can be found in the Results.
We then tested whether there was any relationship between the obtained GABA measures and the proportion of gray matter/white matter/CSF included in the spectroscopy voxel. FAST was used to segment the structural FSPGR scan of participants and the partial volume estimates used (see Fig. 5a and b for an example segmentation). In Figure 5c, the magnitudes of each are plotted with standard errors. The mean gray, white matter, and CSF values were 60.8% (std = 6.02%), 35.7% (std = 5.18%), and 3.46% (std = 1.49%), respectively. In Figure 6, the results of a correlational analysis between GABA and each of the tissue types is presented. None of the correlations approached significance (gray matter r = 0.26, p = 0.34, CI = −0.24 to 0.70; white matter r = −0.25, P = 0.36 CI = −0.67 to 0.22; CSF r = −0.17, P = 0.53, CI = −0.60 to 0.22).
Figure 5.

(a, b) shows the location of the spectroscopy voxel on the 1 mm FSPGR scan. The results of the FAST segmentation are displayed with gray matter marked in brown, white matter in tan and CSF in green. For the empirical analysis partial volume estimates were used (c) Across group mean proportion of tissue types as calculated from the fractional probability percentages returned by FAST. Error bars represent the standard deviation (see text for numbers). [Color figure can be viewed in the online issue, which is available at wileyonlinelibrary.com.]
Figure 6.
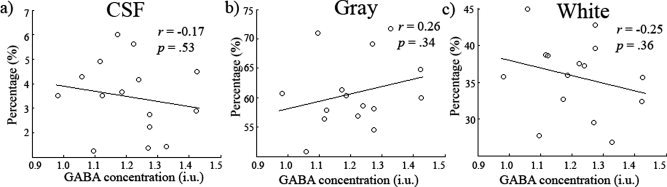
(a–c) Scatter plots showing GABA concentration (i.u) against CSF, gray and white matter respectively. No relationship was found between any of the tissue types and GABA concentration. Confidence intervals for the r values can be found in the results.
Finally, we examined whether there was any correlation between GABA and baseline CBF (see Fig. 7) by extracting CBF values from gray matter for (a) the MRS voxel, (b) the entire occipital lobe, and (c) the fMRI activation ROI (see Supporting Information Fig. 3 for perfusion maps for all participants). None of these measures showed a correlation with GABA (MRS voxel r = −0.14, P = 0.62, CI = −0.62 to 0.48; whole occipital lobe r = −0.27, P = 0.33, CI = −0.68 to 0.26; fMRI activation ROI r = −0.19, P = 0.52, CI = −0.54 to 0.21) although as expected the perfusion values were highly correlated with each other. For the activation ROI peak based HRFs, latency of the HRF was marginally correlated with both MRS voxel perfusion (r = 0.53, P < 0.051) and occipital lobe perfusion (r = 0.53, P < 0.051).
Figure 7.
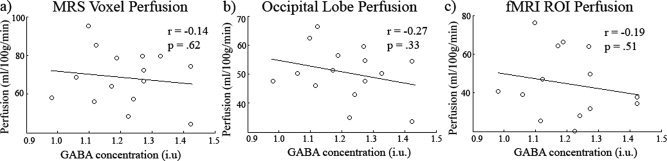
Scatter plot showing GABA versus (a) MRS voxel gray matter perfusion, (b) occipital lobe gray matter perfusion, and (c) fMRI ROI gray matter. No significant relationships were found. See text for confidence intervals of the r values. The perfusion measures were intercorrelated.
DISCUSSION
The main finding of this study is that the height of the HRF in early visual cortex is negatively correlated with the concentration of GABA in the medial occipital cortex. Further, the width of the HRF is positively correlated with GABA concentration. In other words, those individuals with relatively higher GABA concentrations tended to display smaller and wider (and possibly more dispersed) HRFs. In our previous study showing a relationship between GABA and the positive BOLD response, the computed BOLD amplitudes could have been affected by either the height or the shape of the HRF. It is well known that there is significant reliable inter‐participant variability in the HRF parameters of dispersion, latency, and amplitude [Aguirre et al.,1998; D'Esposito et al.,1999a,b]. Parameters such as latency and dispersion are more likely to be reflective of non‐neuronal vascular factors such as the anatomy of the microvasculature of an area and its functional state [Chang et al.,2008; Kemna and Posse,2001]; factors which control the timing of blood entry into local areas of the cerebral cortex. Indeed in the current data, we found a marginal correlation between baseline CBF and HRF latency [Kemna and Posse,2001]. As mentioned in the introduction, it is also known that GABAergic neurons can directly control the cerebral microvasculature through the release of neuromodulators such as vasoactive intestinal peptide (VIP) and somatostatin [Buzsaki et al.,2007; Hamel,2006]. Direct application of GABA has been shown to cause dilation of cerebral artery segments with GABA agonists having similar effects [Edvinsson and Krause,1979]. Hence, this could cause systematic variability in the vascular contribution to the BOLD response across individuals, which could explain the present correlation of GABA with peak width. This explanation suggests that there is some direct GABAergic contribution via the vasculature to the observed inter‐individual differences in BOLD response width.
This study is the third to demonstrate a negative correlation between BOLD response amplitude and resting GABA concentration in visual cortex; one initially from our group [Muthukumaraswamy et al.,2009] and another from an independent laboratory [Donahue et al.,2010]. As such, there seems little doubt about the robustness and replicability of this basic finding. Further, we note that the obtained correlation values were very similar between all three studies with a value of r = −0.64 (n = 15) in the present study (r = −0.78, for the peak voxel), r = −0.70 (n = 12) in Donahue et al., [2010] and r = −0.64 (n = 10) in Muthukumaraswamy et al., [2009]. One question worth considering is how general the GABA/BOLD correlation might be in the brain; this is of course a largely empirical question but preliminary evidence suggests that it may be widespread. It has been demonstrated in rat somatosensory cortex, during forepaw stimulation, that BOLD responses are decreased following administration of vigabatrin [Chen et al.,1997]. Vigabatrin has the pharmacological method of action of blocking GABA transaminase and hence causes increased levels of GABA when measured with MRS (also seen in Petroff et al. [1999a,b]). This study was able to demonstrate experimentally (rather than observationally such as in the present study) that increasing levels of GABA cause decreased BOLD response amplitudes. In humans there has been a recent report in primary motor cortex that individuals with increased GABA levels in their motor cortex exhibit decreased BOLD responses [Bachtiar et al.,2010]; a pattern similar to the present data. Finally, and intriguingly, is the report of increased levels of GABA corresponding with increased negative BOLD responses in human anterior cingulate cortex, part of the default mode network [Northoff et al.,2007]. Taken, together these results suggest the relationship may be widespread in the brain but more extensive data are needed for a more comprehensive conclusion on this matter.
In the present paper, we found no relationship between the spectroscopy voxels' tissue constituents (gray matter/white matter/CSF) and the obtained GABA concentrations. Previously we found a similar lack of relationship between the gray matter in the occipital cortical sheet (volume and thickness) as obtained from freesurfer estimates [Dale et al.,1999; Fischl et al.,1999]. However, the current work has improved on the previous approach by estimating the matter constituents in the spectroscopy voxel rather than using atlas approximations. It is known from both in vivo [Jensen et al.,2005] and ex vivo [Petroff et al.,1988,1989] methods that gray matter has a 2–3 times higher concentration of GABA than white matter and hence this may be a potential third variable that drives correlations between GABA and BOLD. However, the results of our analysis demonstrate that, for a relatively large spectroscopy voxel (27 cm3) in this occipital region, there is actually a very small degree of inter‐participant variability in the tissue composition of the MRS voxel (as evidenced by the small standard deviation bars in Fig. 5c). The tissue constituents of the MRS voxel then (as far as can be resolved with the MRI techniques used here) do not seem to explain the GABA/BOLD correlation.
In this work, we also found no relationship between baseline CBF and GABA concentration, and hence systematic inter‐participant variability in baseline CBF does not, in the present data, appear to explain the GABA‐BOLD correlation observed. However, this result is at odds with a recent report that did demonstrate a correlation between baseline CBF and GABA concentration in the occipital lobe [Donahue et al.,2010] and this discrepancy deserves some attention. The CBF measures from Donahue et al. were obtained from the “off” period of a 20–40 s boxcar visual stimulation paradigm. Although the first 15 s of “off” data were excluded from the analysis, the remaining period may still represent a different level of CBF due to task‐state alternation compared with the resting state as used in this experiment (passive fixation for 6 min). They also only analyzed the “off” data from those regions which activated during the “on” periods, and differences in the volume studied are likely the major factor in differences in findings (we used the spectroscopy voxel as our region of interest). Donahue et al. also used a different ASL read‐out based on GRASE [Gunther et al.,2005] which tends to have higher signal‐to‐noise ratio at the expense of blurring in the through‐slice direction. This may cause perfusion signals lying outside the GABA voxel to contribute significantly to the measurement. Donahue et al. additionally find a positive correlation with the time‐to‐peak of the ASL response to a visual stimulus and GABA concentration. As they point out, this supports the idea that GABA may correlate with arterial arrival time (AAT). Were this the case, depending on the inversion time of the ASL acquisition, CBF may be overestimated where AAT is increased, making it appear that CBF correlates with GABA. Our ASL acquisition may have been insensitive to this effect. However, it must also be considered that we too have used a single inversion time in our ASL acquisition necessitating model assumptions for conversion of signals to CBF values. We may therefore have rendered our experiment insensitive to true CBF‐GABA correlations, such as those observed by Donahue et al. This requires further examination with a more complete modeling of the ASL timecourse using multiple inversion times.
Our experiment has the potential for a contribution to the BOLD response from inflow effects. Recent work from Liu et al. [2008], using a similar experimental design to that presented here, demonstrated a shift to an earlier latency in the measured haemodynamic response of ∼300 ms when using a flip angle of 90 degree compared with 30 degree with TR = 1 s. Liu et al. did not observe a change of the temporal width of the haemodynamic response suggesting that our observed correlation of GABA with width is unlikely to be as a result of inflow effects. We also observed a marginal positive correlation between baseline CBF and HRF peak latency, i.e., higher CBF, longer latency, which is opposite in direction to that suggested by Liu's observation of a shift to shorter latency with stronger inflow effects.
In our previous paper, where we observed a similar correlation, a short boxcar design was used of 2 s/10 s off (12 s total). This short box‐car frequency of 0.08 Hz could potentially have been confounded with the 0.1 Hz oscillation caused by pulsatile motion in the vascular bed [Elwell et al.,1999; Mayhew et al.,1996]. As such, it was possible that the variability in BOLD amplitude that we measured previously was linked to individual variability in this vasomotion signal, rather than being of neural origin. However, the present data using a 2 s/18 s boxcar reduces this possibility as does the observation of GABA‐BOLD correlations in a long boxcar design [Donahue et al.,2010].
In the current work, we have controlled and measured a number of parameters that could potentially explain the previously observed negative correlations between GABA concentration and the positive BOLD response. Although one must be cautious not to over‐interpret correlational data, we can provisionally suggest a mechanistic framework that can explain the current results. The major assumption that we make here is that individual variability in GABA concentration observed with MRS reflects an underlying variability in the excitation–inhibition balance of the different participants. Those participants with higher GABA levels in occipital cortex may have a lower excitation–inhibition ratio than those participants with lower GABA levels. In essence the assumption is that the GABA MRS signal can be used as a surrogate measure for the functional activity of GABA within local neocortex. In one model of the neocortex, the “canonical cortical microcircuit” is composed of reciprocally connected GABAergic interneurons (layers III–VI) and glutamate cells (layers II–IVc & V–VI) [Douglas and Martin,1994; Suarez et al.,1995]. When the microcircuit becomes active (for example through visual stimulation) activity is propagated throughout the entire microcircuit. Microcircuits are held under tight feedback control through back‐projecting GABAergic cells onto principal cells. If an individual has stronger inhibition then this could potentially result in increased feedback onto principal cells and overall decreased principal cell activity. Relatively decreased principal cell activity would then reduce the metabolic costs associated with glutamate cycling [Magistretti et al.,1999; Pellerin and Magistretti,1994] and therefore cause an overall decreased BOLD response. While this argument is speculative, it is testable. Future experiments, both invasively in animals and noninvasively in humans, using a range of appropriate GABAergic and glutamatergic agonists/antagonists should provide an excellent test of the proposed model of how cortical excitation–inhibition affects the BOLD fMRI response.
Finally, the results of this study, coupled with the two previous reports of GABA inverse correlation with BOLD amplitude have important implications for between‐cohort studies. In cohorts in which GABAergic modulations have been proposed, such as schizophrenia [Gonzalez‐Burgos and Lewis,2008; Lewis et al.,2005] and epilepsy [Bernard et al.,2000] it is entirely possible that differences in BOLD response amplitude could result that are due primarily to variations in GABAergic inhibition. These inhibition‐related cohort differences could reflect differences in neural activity, differences in the vascular response, especially in event‐related designs or (perhaps most likely) a combination of the two.
Supporting information
Additional Supporting Information may be found in the online version of this article.
Supporting Information
Acknowledgements
Dr. Kevin Murphy is thanked for useful discussions.
REFERENCES
- Aguirre GK, Zarahn E, D'Esposito M ( 1998): The variability of human, BOLD hemodynamic responses Neuroimage 8: 360–369. [DOI] [PubMed] [Google Scholar]
- Bachtiar V, Stagg C, Johansen‐Berg H ( 2010): GABAergic tone and its responsiveness to modulation reflect individual performance of motor tasks. Presented at the 16th Annual Meeting of the Organization for Human Brain Mapping, Barcelona.
- Bernard C, Cossart R, Hirsch JC, Esclapez M, Ben‐Ari Y ( 2000): What is GABAergic inhibition? How is it modified in epilepsy? Epilepsia 41: S90–S95. [DOI] [PubMed] [Google Scholar]
- Brown GG, Eyler Zorrilla LT, Georgy B, Kindermann SS, Wong EC, Buxton RB ( 2003): BOLD and perfusion response to finger‐thumb apposition after acetazolamide administration: Differential relationship to global perfusion. J Cereb Blood Flow Metab 23: 829–837. [DOI] [PubMed] [Google Scholar]
- Buzsaki G, Kaila K, Raichle M ( 2007): Inhibition and brain work. Neuron 56: 771–783. [DOI] [PMC free article] [PubMed] [Google Scholar]
- Chang C, Thomason ME, Glover GH ( 2008): Mapping and correction of vascular hemodynamic latency in the BOLD signal. Neuroimage 43: 90–102. [DOI] [PMC free article] [PubMed] [Google Scholar]
- Chen R, Yaseen Z, Cohen G, Hallett M ( 1997): Time course of corticospinal excitability in reaction time and self‐paced movements. Ann Neurol 44: 317–325. [DOI] [PubMed] [Google Scholar]
- Chen ZG, Silva AC, Yang JH, Shen J ( 2005): Elevated endogenous GABA level correlates with decreased fMRI signals in the rat brain during acute inhibition of GABA transaminase. J Neurosci Res 79: 383–391. [DOI] [PubMed] [Google Scholar]
- D'Esposito M, Zarahn E, Aguirre GK, Rypma B ( 1999a) The effect of normal aging on the coupling of neural activity to the bold hemodynamic response. Neuroimage 10: 6–14. [DOI] [PubMed] [Google Scholar]
- D'Esposito M, Zarahn E, Aguirre GK, Rypma B ( 1999b): The variability of bold hemodynamic responses in young and elderly subjects: Implications for FMRI studies of normal aging. J Cogn Neurosci 72–72. [Google Scholar]
- Dale AM, Fischl B, Sereno MI ( 1999): Cortical surface‐based analysis. I. Segmentation and surface reconstruction. Neuroimage 9: 179–194. [DOI] [PubMed] [Google Scholar]
- Donahue MJ, Near J, Blicher JU, Jezzard P ( 2010): Baseline GABA concentration and fMRI response. Neuroimage 53: 392–398. [DOI] [PubMed] [Google Scholar]
- Douglas RJ, Martin KAC ( 1994): The canonical microcircuit—A co‐operative neuronal network for neocortex. Struct Funct Organ Neocortex 24: 131–141. [Google Scholar]
- Edden RAE, Muthukumaraswamy SD, Freeman T, Singh KD ( 2009): Orientation discrimination performance is predicted by gamma oscillation frequency and resting GABA concentration in human visual cortex. J Neurosci 29: 15721–15726. [DOI] [PMC free article] [PubMed] [Google Scholar]
- Edvinsson L, Krause DN ( 1979): Pharmacological characterization of GABA receptors mediating vasodilation of verebral arteries in vitro. Brain Res 173: 89–97. [DOI] [PubMed] [Google Scholar]
- Elwell CE, Springett R, Hillman E, Delpy DT ( 1999): Oscillations in cerebral haemodynamics—Implications for functional activation studies. Adv Exp Med Biol 471: 57–65. [PubMed] [Google Scholar]
- Epperson CN, Haga K, Mason GF, Sellers E, Gueorguieva R, Zhang W, Weiss E, Rothman DL, Krystal JH ( 2002): Cortical gamma‐aminobutyric acid levels across the menstrual cycle in healthy women and those with premenstrual dysphoric disorder: A proton magnetic resonance spectroscopy study. Arch Gen Psychiatry 59: 851–858. [DOI] [PubMed] [Google Scholar]
- Evans CJ, McGonigle DJ, Edden RA ( 2010): Diurnal stability of gamma‐aminobutyric acid concentration in visual and sensorimotor cortex. J Magn Reson Imaging 31: 204–209. [DOI] [PubMed] [Google Scholar]
- Fischl B, Sereno MI, Dale AM ( 1999): Cortical surface‐based analysis. II. Inflation, flattening, and a surface‐based coordinate system. Neuroimage 9: 195–207. [DOI] [PubMed] [Google Scholar]
- Goense JB, Logothetis NK ( 2008): Neurophysiology of the BOLD fMRI signal in awake monkeys. Curr Biol 18: 631–640. [DOI] [PubMed] [Google Scholar]
- Gonzalez‐Burgos G, Lewis DA ( 2008): GABA neurons and the mechanisms of network oscillations: Implications for understanding cortical dysfunction in schizophrenia. Schizophr Bull 34: 944–961. [DOI] [PMC free article] [PubMed] [Google Scholar]
- Gunther M, Oshio K, Feinberg DA ( 2005): Single‐shot 3D imaging techniques improve arterial spin labeling perfusion measurements. Magn Reson Med 54: 491–498. [DOI] [PubMed] [Google Scholar]
- Hamel E ( 2006): Perivascular nerves and the regulation of cerebrovascular tone. J Appl Physiol 100: 1059–1064. [DOI] [PubMed] [Google Scholar]
- Jenkinson M, Bannister P, Brady M, Smith S ( 2002): Improved optimization for the robust and accurate linear registration and motion correction of brain images. Neuroimage 17: 825–841. [DOI] [PubMed] [Google Scholar]
- Jensen JE, Frederick Bde B, Renshaw PF ( 2005): Grey and white matter GABA level differences in the human brain using two‐dimensional, J‐resolved spectroscopic imaging NMR Biomed 18: 570–576. [DOI] [PubMed] [Google Scholar]
- Kemna LJ, Posse S ( 2001): Effect of respiratory CO(2) changes on the temporal dynamics of the hemodynamic response in functional MR imaging. Neuroimage 14: 642–649. [DOI] [PubMed] [Google Scholar]
- Lewis DA, Hashimoto T, Volk DW ( 2005): Cortical inhibitory neurons and schizophrenia. Nat Rev Neurosci 6: 312–324. [DOI] [PubMed] [Google Scholar]
- Liu HL, Wei PS, Wai YY, Kuan WC, Huang CM, Wu CW, Buckle C, Wan YL, Gao JH ( 2008): Inflow effects on hemodynamic responses characterized by event‐related fMRI using gradient‐echo EPI sequences. Med Phys 35: 4300–4307. [DOI] [PubMed] [Google Scholar]
- Logothetis NK ( 2008): What we can do and what we cannot do with fMRI. Nature 453: 869–878. [DOI] [PubMed] [Google Scholar]
- Logothetis NK, Pauls J, Augath M, Trinath T, Oeltermann A ( 2001): Neurophysiological investigation of the basis of the fMRI signal. Nature 412: 150–157. [DOI] [PubMed] [Google Scholar]
- Lu H, Clingman C, Golay X, van Zijl PC ( 2004): Determining the longitudinal relaxation time (T1) of blood at 3.0 Tesla. Magn Reson Med 52: 679–682. [DOI] [PubMed] [Google Scholar]
- Magistretti PJ, Pellerin L, Rothman DL, Shulman RG ( 1999): Energy on demand. Science 283: 496–497. [DOI] [PubMed] [Google Scholar]
- Marshall I, Bruce SD, Higinbotham J, MacLullich A, Wardlaw JM, Ferguson KJ, Seckl J ( 2000): Choice of spectroscopic lineshape model affects metabolite peak areas and area ratios. Magn Reson Med 44: 646–649. [DOI] [PubMed] [Google Scholar]
- Mayhew JEW, Askew S, Zheng Y, Porrill J, Westby GWM, Redgrave P, Rector DM, Harper RM ( 1996): Cerebral vasomotion: A 0.1‐Hz oscillation in reflected light imaging of neural activity. Neuroimage 4: 183–193. [DOI] [PubMed] [Google Scholar]
- Mescher M, Merkle H, Kirsch J, Garwood M, Gruetter R ( 1998): Simultaneous in vivo spectral editing and water suppression. NMR Biomed 11: 266–272. [DOI] [PubMed] [Google Scholar]
- Muthukumaraswamy SD, Singh KD ( 2008): Spatiotemporal frequency tuning of BOLD and gamma band MEG responses compared in primary visual cortex. Neuroimage 40: 1552–1560. [DOI] [PubMed] [Google Scholar]
- Muthukumaraswamy SD, Singh KD ( 2009): Functional decoupling of BOLD and gamma‐band amplitudes in human primary visual cortex. Hum Brain Mapp 30: 2000–2007. [DOI] [PMC free article] [PubMed] [Google Scholar]
- Muthukumaraswamy SD, Edden RAE, Jones DK, Swettenham JB, Singh KD ( 2009): Resting GABA concentration predicts peak gamma frequency and fMRI amplitude in response to visual stimulation in humans. Proc Natl Acad Sci USA 106: 8356–8361. [DOI] [PMC free article] [PubMed] [Google Scholar]
- Northoff G, Walter M, Schulte RF, Beck J, Dydak U, Henning A, Boeker H, Grimm S, Boesiger P ( 2007): GABA concentrations in the human anterior cingulate cortex predict negative BOLD responses in fMRI. Nat Neurosci 10: 1515–1517. [DOI] [PubMed] [Google Scholar]
- Pakkenberg B, Gundersen HJ ( 1997): Neocortical neuron number in humans: Effect of sex and age. J Comp Neurol 384: 312–320. [PubMed] [Google Scholar]
- Payne SJ ( 2006): A model of the interaction between autoregulation and neural activation in the brain. Math Biosci 204: 260–281. [DOI] [PubMed] [Google Scholar]
- Pellerin L, Magistretti PJ ( 1994): Glutamate uptake into astrocytes stimulates aerobic glycolysis: A mechanism coupling neuronal activity to glucose utilization. Proc Natl Acad Sci USA 91: 10625–10629. [DOI] [PMC free article] [PubMed] [Google Scholar]
- Petroff OA, Ogino T, Alger JR ( 1988): High‐resolution proton magnetic resonance spectroscopy of rabbit brain: Regional metabolite levels and postmortem changes. J Neurochem 51: 163–171. [DOI] [PubMed] [Google Scholar]
- Petroff OA, Spencer DD, Alger JR, Prichard JW ( 1989): High‐field proton magnetic resonance spectroscopy of human cerebrum obtained during surgery for epilepsy. Neurology 39: 1197–1202. [DOI] [PubMed] [Google Scholar]
- Petroff OA, Hyder F, Collins T, Rothman DL, Mattson RH ( 1999a) Vigabatrin increases brain GABA within one hour. Epilepsia 40: 146–146. [DOI] [PubMed] [Google Scholar]
- Petroff OAC, Hyder F, Collins T, Mattson RH, Rothman DL ( 1999b) Acute effects of vigabatrin on brain GABA and homocarnosine in patients with complex partial seizures. Epilepsia 40: 958–964. [DOI] [PubMed] [Google Scholar]
- Sadaghiani S, Ugurbil K, Uludag K ( 2009): Neural activity‐induced modulation of BOLD poststimulus undershoot independent of the positive signal. Magn Reson Imaging 27: 1030–1038. [DOI] [PubMed] [Google Scholar]
- Scholvinck ML, Maier A, Ye FQ, Duyn JH, Leopold DA ( 2010): Neural basis of global resting‐state fMRI activity. Proc Natl Acad Sci USA 107: 10238–10243. [DOI] [PMC free article] [PubMed] [Google Scholar]
- Shrout PE, Fleiss JL ( 1979): Intraclass correlations: Uses in assessing rater reliability. Psychol Bull 2: 420–428. [DOI] [PubMed] [Google Scholar]
- Silvennoinen MJ, Clingman CS, Golay X, Kauppinen RA, van Zijl PC ( 2003): Comparison of the dependence of blood R2 and R2* on oxygen saturation at 1.5 and 4.7 Tesla. Magn Reson Med 49: 47–60. [DOI] [PubMed] [Google Scholar]
- Smith SM ( 2002): Fast robust automated brain extraction. Hum Brain Mapp 17: 143–155. [DOI] [PMC free article] [PubMed] [Google Scholar]
- Suarez H, Koch C, Douglas R ( 1995): Modeling direction selectivity of simple cells in striate visual‐cortex within the framework of the canonical microcircuit. J Neurosci 15: 6700–6719. [DOI] [PMC free article] [PubMed] [Google Scholar]
- Sumner P, Edden RA, Bompas A, Evans CJ, Singh KD ( 2010): More GABA, less distraction: A neurochemical predictor of motor decision speed. Nat Neurosci 13: 825–827. [DOI] [PubMed] [Google Scholar]
- Traub RD, Whittington MA, Colling SB, Buzsaki G, Jefferys JGR ( 1996): Analysis of gamma rhythms in the rat hippocampus in vitro and in vivo. J Physiol 493: 471–484. [DOI] [PMC free article] [PubMed] [Google Scholar]
- Wansapura JP, Holland SK, Dunn RS, Ball WS Jr ( 1999): NMR relaxation times in the human brain at 3.0 tesla. J Magn Reson Imaging 9: 531–538. [DOI] [PubMed] [Google Scholar]
- Whittington MA, Traub RD, Jefferys JGR ( 1995): Synchronized oscillations in interneuron networks driven by metabotropic glutamate‐receptor activation. Nature 373: 612–615. [DOI] [PubMed] [Google Scholar]
- Wong EC, Buxton RB, Frank LR ( 1998): Quantitative imaging of perfusion using a single subtraction (QUIPSS and QUIPSS II). Magn Reson Med 39: 702–708. [DOI] [PubMed] [Google Scholar]
- Worsley KJ ( 2001): Statistical analysis of activation images In: Jezzard P, Maththews P, Smith S, editors. Functional MRI: An Introduction to Methods. Oxford: Oxford University Press; 251–270. [Google Scholar]
- Zhang Y, Brady M, Smith S ( 2001): Segmentation of brain MR images through a hidden Markov random field model and the expectation‐maximization algorithm. IEEE Trans Med Imaging 20: 45–57. [DOI] [PubMed] [Google Scholar]
Associated Data
This section collects any data citations, data availability statements, or supplementary materials included in this article.
Supplementary Materials
Additional Supporting Information may be found in the online version of this article.
Supporting Information