

Abstract
We report two immuoreactive species of thrombospondin-2 (TSP2), sized approximately 200 and 125 kDa, in the long bones of growing, but not skeletally mature, mice. In vitro osteoblasts secrete a 200-kDa species into the culture medium as early as day 3, and it appears in the cell-matrix layer by day 7. A 125-kDa species appears in the cell-matrix layer in parallel with mineralization; it is not detected in cell-conditioned medium. Unilateral tibial fracture induced a time-dependent upregulation of the 200-kDa species at the site of trauma. By contrast, relative levels of the 125-kDa species at the fracture site were lower than in bones from naive control animals. In the contralateral untouched control tibia, the 200-kDa species was rapidly and substantially reduced compared to bone harvested from naive control mice. Levels of the 125-kDa species in the untouched tibia declined gradually with time postfracture. TSP2 gene expression in uninjured control bone decreased modestly by 21 days postfracture. On the day of fracture, the osteoblast differentiation potential of MSCs harvested from uninjured bones decreased compared to those harvested from naive control animals. The presence of two isoforms suggests that TSP2 may undergo posttranscriptional or posttranslational processing in skeletal tissue. Our data also suggest that, in the context of trauma, the two TSP2 isforms are differentially modulated at injured and noninjured skeletal sites in an animal undergoing fracture healing.
Keywords: Matricellular, Thrombospondin-2, Fracture, Marrow stromal cell, Osteoblast
Introduction
Thrombospondin 2 (TSP2) belongs to the matricellular family of extracellular matrix (ECM) glycoproteins [1, 2]. In the context of the skeleton, it affects proliferation and differentiation of marrow-derived mesenchymal stromal cells (MSCs), and it promotes osteoblast lineage progression. Long bones of TSP2-null mice display an increased cortical thickness that is associated with increased MSC numbers [3]. Accordingly, in vitro studies indicate that TSP2 is an autocrine inhibitor of MSC proliferation [4]. In committed osteoblasts, TSP2 promotes matrix maturation and mineralization in cell culture [5]. TSP2-null MSCs also display increased adipogenic capacity in vitro [6]. In the context of fracture healing, TSP2 gene expression increases substantially during the inflammatory stage, peaking 5 days after injury [7]. TSP2-null mice display a more robust intramembranous healing response than their wild-type counterparts [7], an observation that may be due to TSP2’s antiangiogenic activity [8, 9]. Thus, TSP2 appears to affect MSC proliferation, lineage commitment, and osteoblast differentiation in multiple contexts.
We have noted the presence of two TSP2-immunoreactive protein species in murine cortical bone. The experiments outlined here were undertaken to define the physiologic contexts in which these two isoforms of TSP2 are present. Together, our data suggest that TSP2 protein is posttranscriptionally modified during the course of osteoblast matrix maturation. Following skeletal injury, both isoforms are subject to local regulation at the site of trauma and to differential modulation at noninjured bony sites within the same animal.
Materials and Methods
Animal Care
C57/B6 mice were obtained from Charles River (Wilmington, MA). Andrea I Alford maintains a colony of TSP2-null mice on the C57/B6 background. All mice were housed under specific pathogen-free conditions at the University of Michigan. All procedures were approved by the University of Michigan Committee on the Care and Use of Animals.
Fracture Model
Two-month-old female C57/B6 mice were used in this part of the study. Unilateral, closed, transverse tibial fractures were created as described previously [10]. Mice were anesthetized for all surgical procedures using isoflurane (Aerrane; Baxter, Deerfield, IL). Analgesic (0.05 mg/kg butorphanol tartrate; Fort Dodge Animal Health, Fort Dodge, IA) was administered subcutaneously shortly after anesthesia. Mice were positioned dorsally on heating pads for the duration of anesthesia. At random, one leg was prepared for aseptic surgery. The stifle joint of the leg was flexed, and a small incision was made just medial of the tibial tuberosity. A 26-gauge hypodermic needle was then used to make an entry hole in the medial cortex, and a sterile, 0.009-inch-diameter, stainless-steel pin was fully inserted into the medullary canal. This intramedullary pin provided stability at the fracture site. Following pin insertion, the pins were cut flush with the cortex, and the skin defect was closed using tissue adhesive (Nexaband; Abbot Laboratories, North Chicago, IL). For the sham control group the procedure ended here with placement of the medullary pin and mice were allowed to recover as described below.
For the fracture groups, mice were placed in sternal recumbancy and a fracture was created using a custom-made device that provides consistent controlled displacement and high-energy impact force sufficient to induce fracture in the mouse tibia. Microradiographs were then generated (Faxitron, Wheeling, IL) to verify pin placement and fracture location. Tape splints were placed on the tibia to provide rotational stability during the first few postoperative days. Mice in both the sham-operated and fracture-treated groups recovered under heat lamps. Moistened food and water were provided ad libitum. Mice were typically ambulatory within 15 min postsurgery and began eating within a few hours. No mortality was observed during the course of this study.
Bone Tissue Harvests
After the times indicated, animals were humanely killed and the whole fractured tibiae and whole-intact contralateral untouched tibiae were each collected for analysis of TSP2 protein or mRNA as outlined below. Soft tissues were preserved to protect the fracture callus. In order to determine whether TSP2 was differentially localized, the cartilaginous fracture callus (day 7 postfracture) was dissected from a subset of animals. Whole femora and tibiae were also harvested from 1-, 2-, and 3-month-old naive male and female C57/B6 mice (n = 6 per age group and sex). In two small groups of 1-month-old naive animals (4 each) the marrow contents were removed by centrifugation after cutting the distal epiphysis or both distal and proximal epiphyseal-metaphyseal regions were dissected from the diaphyseal bone. The epiphyses and metaphyses were not separated from each other. In a separate group of fractured and naive control animals, uninjured bones were collected for CFU-F and CFU-OB analysis as outlined below. Tissue samples were snap-frozen and stored at −80°C until they were processed for immunoprecipitation and Western blot or gene expression analysis as outlined below.
Immunoprecipitation
Bones were crushed and homogenized in lysis buffer containing 50 mM Tris, 150 mM NaCl, 2 mM EGTA, 10% NP40, and 10 mM NaPPi, as well as a mixture of protease inhibitors (10 mM PMSF, 10 mM sodium fluoride, 10 mM sodium orthovanadate and the Complete protease inhibitor cocktail [Roche Applied Science, Indianapolis, IN]). Protein concentrations were determined using the BCA assay. Equal amounts of protein were then processed for Western blot or precleared for immunoprecipitation.
Cleared supernatants were incubated at 4°C with 50 μL polyclonal anti-thrombospondin 2 antibody (AbCam, Cambridge, MA) per 500 μL reaction. Protein A/G PLUS-Agarose (20 μL; Santa Cruz Biotechnology, Santa Cruz, CA) was added to samples after 6 h, and they were incubated at 4°C overnight. Immunoprecipitates were collected by centrifugation and washed 4 times with 150 mM NaCl, 10 mm Tris, 1 mM EDTA, 1 mM EGTA, 0.5% NP40, and 1% Triton X-100 plus protease inhibitors. The pellet was resuspended in 40 μL gel loading buffer (62.5 mM Tris-HCl [pH 6.8], 2% SDS, 10% glycerol, 0.01% bromophenol blue, and 5% BME) and incubated at 95°C for 5 min in preparation for SDS-PAGE and Western blot.
Western Blot Analysis
Bone protein extracts and cell-matrix layers were normalized for total protein content (BCA assay); equal volumes of immunoprecipitated fractions and cell-conditioned medium were applied. Protein samples were separated on 10% SDS-PAGE gels and transferred to nitrocellulose in transfer buffer containing 50 mM Tris, 192 mM glycine, and 20% methanol. Nonspecific sites were blocked with Tris-buffered saline containing 0.05% Tween-20 and 5% nonfat dry milk. Blots were incubated with a monoclonal anti-mouse TSP2 antibody (BD Biosciences, San Jose, CA) overnight at 4°C, washed three times in Tris-buffered saline containing 0.05% Tween-20, and incubated with horseradish peroxidase-conjugated goat anti-mouse immunoglobulin-G (Thermo Scientific, Rockford, IL). Membranes were washed again, and proteins were detected using enhanced chemiluminescence (Supersignal West Femto ECL kit, Thermo Scientific, Rockford, IL). Band intensities were determined from histograms generated using ImageJ gel analysis software (National Institutes of Health, Bethesda, MD).
Analysis of TSP2 Gene Expression
Total RNA was isolated from bones using Trizol (Invitrogen, Carlsbad, CA). After DNase treatment (New England Biolabs, Ipswich, MA), RNA was quantified by ultraviolet spectrophotometry. One microgram of RNA was then reverse-transcribed using oligo (dT) primers and superscript III reverse transcriptase (Invitrogen, Carlsbad, CA). The resulting cDNA was used in real-time PCR with Power SYBR green (Applied Biosystems, Foster City, CA) using published TSP2 and actin primer sequences [5]. Thermal cycling was performed using a 7500 Fast Real-Time System (Applied Biosystems). Proper amplicon formation was confirmed by melt-curve analysis, and relative mRNA expression levels were calculated using the double delta-Ct method.
Isolation and Culture of Primary MSCs
MSCs were isolated and cultured as described previously [3]. Marrow was flushed from the femora and tibiae of 4- to 6-week old male mice. A single-cell suspension was obtained by passing the aspirate through a 26-gauge needle, and the cells were plated, at a ratio of one animal per dish, onto 10-cm tissue culture dishes in MSC growth medium (α-MEM containing 10% fetal bovine serum [Hyclone, Logan, UT], 100 IU/mL penicillin, 100 μg/mL streptomycin, 10 μM amphotericin B, and 50 μM ascorbate). This heterogeneous cell population was cultured for 2 weeks, and medium was changed every 3–4 days. In order to maintain the influence of nonadherent cells [11], only one-third of the total volume of medium was replaced each time. At the end of this initial culture period, nonadherent cells were discarded and the adherent MSC population was removed from the culture surface using 0.25% trypsin containing 10 mM EDTA and passaged onto six-well plates at a density of 20,000 cells/cm2 in osteoblast induction medium (MSC growth medium supplemented with 10 mM β-glycerolphosphate). Medium was replaced completely every 3 days. At the end of the indicated culture period, conditioned medium was collected and snap-frozen in the presence of protease inhibitors. The cell-matrix layers were collected directly into gel loading buffer containing protease inhibitors. Both fractions were stored at −80°C in preparation for Western blot analysis as outlined above.
Colony Forming Unit-Fibroblastic Assay
CFU-F assays were performed as described [3]. After death, marrow was flushed separately from each tibia of naive control animals or from the contralateral untouched control tibia of mice that had undergone unilateral tibial fracture surgery 0, 3, 7, 10, or 14 days previously. A single-cell suspension of whole marrow from each bone was obtained using a 26-gauge needle and cultured in triplicate at 2.6 × 10⁶ cells per 60-mm dish in MSC growth medium containing ascorbate. After 9 days, colonies were stained using a commercially available alkaline phosphatase kit (Sigma, St. Louis, MO). After obtaining an image of each plate using a flatbed scanner, colonies were independently counted inside four identical circular regions of interest by two blinded observers (P. M. and G. S.).
Colony Forming Unit-Osteoblastic
In an additional group of animals, the osteoblastic potential of MSCs harvested from uninjured bone was determined by alizarin red S staining. MSCs were harvested from naive control animals and from the contralateral untouched control tibiae of mice that had undergone unilateral fracture surgery 0 or 10 days previously and plated as outlined above for the CFU-F assay. After 9 days of culture in MSC medium, β-glycerolphosphate was added to the cultures and they were maintained for an additional 12 days. Plates were washed with PBS, air-dried, fixed in 50% ethanol, stained for 5 min with a 1.0% solution of alizarin red S, and rinsed thoroughly in ddH2O. Total and mineralizedcolonies were counted under a dissecting microscope. Alizarin red S was then solubilized in 0.5 N HCL containing 5% SDS for 30 min at room temperature, and optical densities were read at 415 nm using a SpartSpec 3000 UV spectrophotometer (BioRad Laboratories, Hercules, CA).
Statistical Analysis
All data are mean and SD of values obtained from four to eight animals. Statistical analyses were conducted using Prism 4.0 (GraphPad Software, San Diego, CA). Effects of time postfracture on TSP2 and on CFU-F numbers were evaluated by ANOVA followed by Dunnett’s post-hoc test, comparing mean values to those obtained from naive control animals. A post-hoc regression analysis was also conducted on the CFU-F data. P <0.05 was considered statistically different.
Results
Western blot analysis of whole-bone protein extracts obtained from growing C57/B6 mice revealed two immunoreactive species running at approximately 200 kDa Mr and 125 kDa Mr (Fig. 1a). TSP2 protein levels decreased substantially at skeletal maturity, and only the lower–molecular weight isoform was detected (Fig. 1a). Each lane contains an equal amount of protein derived from the long bones of a single mouse. We confirmed the specificity of the immunoblotting experiments using protein extracted from TSP2-null and wild-type littermates (Fig. 1b). In a subset of bones, the distal epiphysis was cut away and the marrow removed by centrifugation. Figure 1c demonstrates that both TSP2-immunoreactive species were present in the bone but marrow did not contain detectable amounts of TSP2. Figure 1d shows that the 200-kDa isoform was enriched in epiphyseal bone compared to diaphyseal cortical bone. The 125-kDa species was present in both regions (Fig. 1d).
Fig. 1.
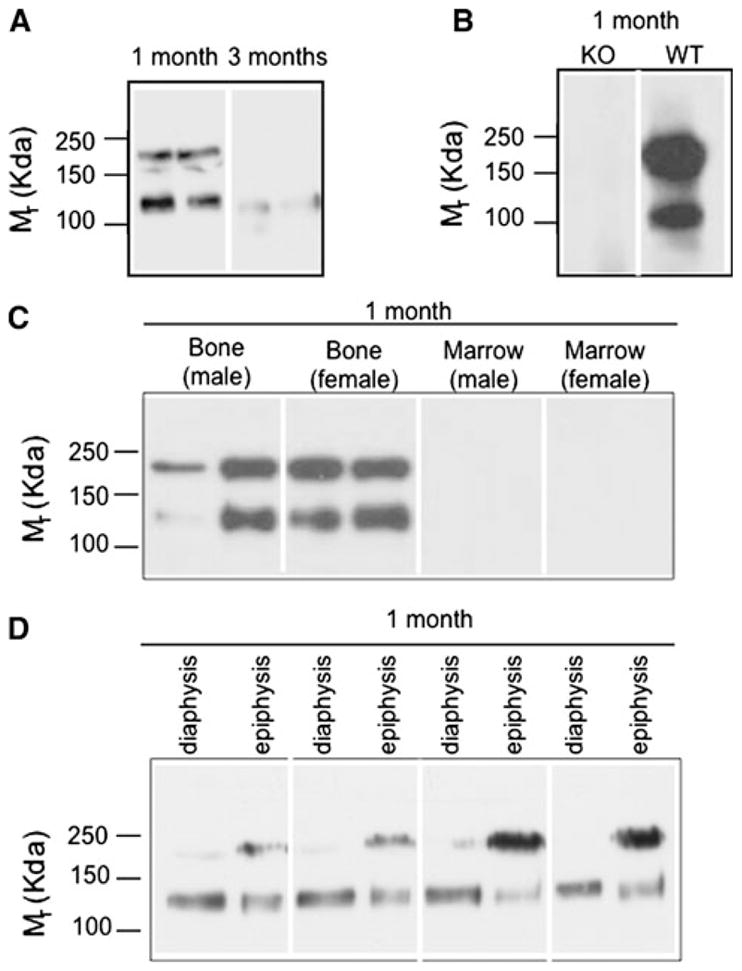
Characterization of TSP2 protein in murine long bone. Western blots of bone from 1- and 3-month old female mice (a) and 1-month-old male TSP2-null (KO) and wild-type (WT) littermates (b). c Immunoprecipitation and Western blot of bone and marrow. d Western blot of diaphyseal cortical and epiphyseal trabecular bones. Blots are representative of material obtained from four to eight mice per group. Each lane contains protein from a single mouse
Next, we examined patterns of TSP2 protein expression during osteoblast differentiation in vitro. Figure 2 shows that the 200-kDa Mr TSP2 protein species began to accumulate in the culture medium as early as day 3 and appeared in the cell-matrix layer by day 7. At approximately day 21, when these cultures were well mineralized (data not shown), a second 125-kDa Mr TSP2 species appeared in the cell-ECM layer. Only the 200-kDa Mr TSP2 isoform was detected in the medium harvested from these cultures (Fig. 2b).
Fig. 2.

Characterization of TSP2 protein in MSCs undergoing osteoblastic differentiation in vitro. Western blot of cell-ECM extracts (a) and conditioned medium (b) obtained from primary MSCs cultured under osteogenic conditions. Blots are representative of data obtained from three independent cell isolations with two to three wells at each time point
TSP2 makes important contributions to fracture healing, and TSP2 mRNA levels increase substantially at the fracture site during the first week after injury [7]. As such, we examined TSP2 protein in both legs 6 days following the application of a unilateral transverse tibial fracture. Western blot analysis showed that while TSP2 levels were quite high in injured limbs, the protein was virtually undetectable in each animal’s corresponding untouched contralateral control limb (Fig. 3a). Immunoprecipitation and Western blot corroborated the absence of the 200-kDa Mr TSP2 isoform in the untouched tibiae (data not shown). These data suggest that, following fracture, TSP2 is upregulated in the injured limb but downregulated in noninjured control bone. To further confirm this premise, we ran protein extracted from naive control mice together with fracture-operated, sham-operated, and contralateral untouched control samples. Figure 3b shows that relative to naive controls TSP2 levels were decreased in the untouched contralateral control limbs of both sham-operated and fracture-operated mice.
Fig. 3.

Effect of fracture healing on TSP2 protein levels in injured and noninjured bones. a, b Western blots of fractured or sham-operated and control tibiae harvested after 6 days of healing. c Western blot of fracture callus after 7 days of healing. Each lane contains protein obtained from a single bone; extracts from the limbs of individual animals are side-by-side. Blots are representative of data from three to five animals per group
The whole fractured bone was harvested for the TSP2 analyses shown in Fig. 3a, b. In order to determine whether TSP2 is differentially localized within the injured bone, we dissected cartilaginous callus from bones harvested from mice that had undergone fracture healing for 7 days. Figure 3c shows that the fracture callus only contained the200-kDa Mr TSP2 isoform.
Next, we analyzed levels of each isoform in injured and contralateral control bones with time following application of a unilateral fracture. Figure 4 summarizes data obtained from fractured tibiae. At the site of trauma, relative levels of the 200-kDa species increased significantly by 7 days postfracture (Fig. 4b). Conversely, the 125-kDa species declined relative to naive control bones (Fig. 4c).
Fig. 4.

Postfracture time course of TSP2 protein levels at the site of injury. a Representative Western blots of fractured tibiae obtained at the indicated times. Intensities of the 200-kDa (b) and the 125-kDa (c) bands were determined using histograms generated in ImageJ. Each bar represents mean ± SD of TSP2 intensities determined from eight bones. #P <0.05, *P <0.01 compared to naive control by ANOVA and Dunnett’s post-hoc test
Figure 5 summarizes data obtained from contralateral uninjured control tibiae. At day 0 (6 h following fracture) the 200-kDa species was detected in 75% (6/8) of the contralateral control bones tested, and by day 3 it was not detected in any of the samples tested (Fig. 5a). The 125-kDa species was detectable over the entire time course analyzed, and band intensities are quantified in Fig. 5b. Relative levels of the 125-kDa TSP2 isoform remained stable over the first 3 days and then began to decrease between 7 and 14 days postfracture. TSP2 mRNA levels decreased with time postfracture, and at day 21 this difference reached statistical significance compared to naive control gene expression levels (Fig. 6). As an additional comparison, we also conducted RT-PCR analysis on RNA extracted from TSP2-null tibiae, but the fluorescence intensity for the TSP2 amplification never exceeded background levels in the null tissue (data not shown).
Fig. 5.

Postfracture time course of TSP2 protein levels in control uninjured bones. a Representative Western blots of contralateral untouched control tibiae obtained at the indicated times. b Intensities of the 125-kDa bands were determined using histograms generated in ImageJ. Each bar represents mean ± SD of TSP2 intensities determined from eight bones. #P <0.05 compared to naive control by ANOVA and Dunnett’s post-hoc test
Fig. 6.

Postfracture time course of TSP2 gene expression in control uninjured bones. Within each group, TSP2 mRNA levels were normalized to actin mRNA levels and expressed relative to expression levels in the naive control samples. Bars represent mean ± SD of TSP2 expression data obtained from four to eight animals per group. #P <0.05 compared to naive control
Since TSP2 inhibits MSC proliferation [4], we hypothesized that the decrease in TSP2 that we observed in the untouched control bones would correlate with an increase in the size of the progenitor cell pool on this uninjured side. In order to test this premise, we flushed marrow from the uninjured tibiae of mice that had undergone fracture healing for a range of times and performed CFU-F assays. Figure 7 shows that compared to naive control values there was no significant effect of fracture on the number of adherent colonies obtained from uninjured control bones.
Fig. 7.

Effect of fracture healing on the size of the MSC pool in uninjured control bone. a Representative CFU-F assay from a single tibia. Visible colonies were scored within the circles. Extremely small (arrow) or large (asterisk) colonies were not scored. b Bars represent mean ± SD of colony numbers determined for 16–18 bones per time point
TSP2 promotes osteoblast differentiation in vitro, so we also examined the osteoblastic potential of MSCs harvested from uninjured control bones. Compared to naive control values, the number of mineralized colonies obtained from contralateral uninjured bone decreased the day of fracture (Fig. 8a, b). Similarly, the relative amount of mineralization as determined by solubilizing the alizarin red S decreased immediately postfracture (Fig. 8c). At 10 days postfracture, the number of mineralized nodules was not different from naive control values but the relative amount of total mineral was still significantly lower compared to naive control plates (Fig. 8c). Similar to the data shown in Fig. 7, the total number of CFU-F did not change with time postfracture.
Fig. 8.

Effect of fracture healing on osteoblastic potential of MSCs in uninjured control bone. a Representative alizarin red S–stained plates. b Mean ± SD of mineralized nodules per plate. c Mean ± SD of optical density values obtained after alizarin red S solubilization of plates analyzed in b. d Mean ± SD of total colonies per plate. Data were obtained from three animals per time point. #P <0.05, *P <0.01 compared to naive control
Discussion
The data presented here are the first of which we are aware to show that two molecular weight species of TSP2 are present in bone. The presence of two TSP2 isoforms is most likely due to differential posttranscriptional or posttranslational processing. TSP2 has multiple candidate sites for protein glycosylation [12], but glycosidase treatment had an equivalent effect on the apparent molecular weight of both TSP2 isoforms (data not shown). The possibility that there are multiple TSP2 transcripts, which are expressed in a context-dependent manner in the skeleton, has not been ruled out. Alternatively, the lower-molecular weight isoform of TSP2, which was found exclusively in the cell-matrix layer in vitro (Fig. 3), is potentially liberated by bone matrix–bound proteinase activity. TSP2 is a disulfide-linked trimer that is structurally suited to extra-cellular proteolysis [12]. ADAMTS-1 cleaves purified preparations of TSP2 [13], and the protease has been implicated in osteoblast maturation and matrix mineralization [14, 15]. MT1-MMP and MMP2 also contribute to proper maturation of the osteoblast-derived matrix, nodule formation, and mineralization [16]. In vivo, MMP-mediated degradation of bone matrix components may facilitate proper osteoclast-mediated bone turnover [17]. Whether any of these proteinases process TSP2 in bone has not yet been explored. In addition, while the 125-kDa Mr TSP2 isoform was restricted to the matrix layer in vitro, the exact location of each TSP2 isoform within the bone matrix formed in vivo remains to be determined.
The 200-kDa Mr TSP2 isoform was present in osteoblast lineage cell cultures and in cartilaginous fracture callus, supporting the conclusion that full-length TSP2 is expressed by osteoblasts and chondrocytes [18]. In contrast, the 125-kDa Mr TSP2 species appears to be restrictedto mineralized tissues: it is detected in mineralizing osteoblast cultures, in diaphyseal bone, as well as in specimens containing ossifying cartilage at the metaphyseal growth plate plus the secondary ossification center located at the epiphysis. Conversely, the 125-kDa Mr TSP2 species was not detected in cartilaginous fracture callus. Both TSP2 species are present in epiphyseal bone, which contains growth plate cartilage and newly mineralizing trabeculae. We hypothesize that the 125-kDa Mr species is liberated from full-length TSP2 during the course of matrix mineralization.
Our second major finding is that postfracture TSP2 protein levels appear to be differentially modulated in injured and noninjured bone. While TSP2 protein levels were quite high in the fractured limb between 6 and 10 days after surgery, they were substantially lower in the contralateral untouched control tibiae. Our data suggest that the injury imparted by inserting the medullary pin also promotes a decrease in TSP2 levels in untouched contralateral control bones. TSP2 mRNA levels also decreased modestly after fracture in noninjured tibiae, and decreased TSP2 protein levels may reflect changes in TSP2 gene expression. However, in contrast to skeletal tissue derived from wild-type animals in all surgical and control groups, TSP2 mRNA was virtually undetectable in TSP2-null bones. Thus, although TSP2 gene expression in contralateral untouched bone decreases with time postfracture, it does not decline to levels comparable to those obtained from TSP2-null bone. The observation that the 200-kDa Mr isoform disappeared rapidly compared to the more gradual reduction in the 125-kDa Mr suggests that the lower–molecular weight isoform may be relatively more stable. Together our data suggest that both posttranscriptional and posttranslational mechanisms modulate TSP2 levels in noninjured skeletal sites after a fracture. For example, osteogenic growth peptide, a 14-amino acid, histone H-4-related peptide, is a circulating factor that contributes to increased osteoblast activity observed at distal sites following marrow ablation [19–21]. Although they may be interdependent, we hypothesize that the events modulating TSP2 at a site of skeletal injury are distinct from those that regulate TSP2 expression systemically following trauma.
Systemic osteogenesis following skeletal trauma is a well-established phenomenon [22–24], and the possibility that a circulating population of cells with osteogenic potential can contribute to fracture healing is currently an active area of research [reviewed in 25; see also 26, 27]. TSP2 is an established modulator of MSC proliferation [3, 4] and of angiogenesis [8, 9], so a decrease in TSP2 levels potentially contributes to the mobilization of distant progenitor cell pools in response to skeletal injury. We explored the potential relationship between declining TSP2 levels and the size of the MSC pool by conducting CFU-F assays on marrow harvested from contralateral control tibiae. Our data do not demonstrate a correlation between decreased TSP2 levels and the size of the MSC pool in untouched contralateral control bones. While TSP2 levels (200 kDa) remained low throughout the time course studied, colony numbers only increased modestly, but not significantly, between day 0 and day 7 compared to naive control values. In contrast, the osteogenic potential of MSCs harvested from contralateral untouched control bones decreased immediately following fracture. Compared to naive control values, the total number of nodules and relative amounts of alizarin red S staining decreased significantly the day of fracture. At 10 days postfracture the number of mineralized nodules had returned to control values, but there were still relatively lower amounts of total alizarin red S staining compared to cells harvested from naive control animals. These data suggest that the nodules formed by MSCs harvested 10 days after fracture might be smaller than those formed by cells harvested from naive control mice. Whether the decrease in TSP2 that we observed in uninjured control bones is linked to decreased osteoblast differentiation potential remains to be determined, but these data support the hypothesis that TSP2 promotes osteoblast differentiation. Similarly, the possibility that the two isoforms have differential effects on these outcome measures was not addressed here. Indeed, the two species displayed unique postfracture expression patterns in the contralateral untouched bones. Similarly, the possibility that changes in TSP2 expression have downstream effects on MSCs and osteoblasts cannot be ruled out. As discussed above, putative circulating cells with osteogenic differentiation potential might also contribute to fracture healing, but the relationships between TSP2 and these newly identified cell populations have not been explored.
Our data demonstrate the presence of two TSP2 isoforms in mineralized skeletal tissue and suggest the possibility that posttranslational processing of TSP2 contributes to osteoblast maturation or matrix mineralization. Our fracture healing experiments showing that injury leads to decreased TSP2 levels, as well as MSC-osteoblastic differentiation potential, in untouched control bones suggest that TSP2 promotes osteoblast differentiation in vivo. Together, our data support the premise that TSP2 plays multiple, context-dependent roles in osteoblast lineage progression.
Acknowledgments
We thank Bonnie T. Nolan and Kathy Sweet for expert technical assistance and animal care.
Footnotes
The authors have stated that they have no conflict of interest.
Contributor Information
Andrea I. Alford, Email: aialford@umich.edu, Department of Orthopaedic Surgery, University of Michigan School of Medicine, Biological Sciences Research Building, Room 2009, Ann Arbor, MI 48109, USA
Anita B. Reddy, Department of Orthopaedic Surgery, University of Michigan School of Medicine, Biological Sciences Research Building, Room 2009, Ann Arbor, MI 48109, USA
Steven A. Goldstein, Department of Orthopaedic Surgery, University of Michigan School of Medicine, Biological Sciences Research Building, Room 2009, Ann Arbor, MI 48109, USA
Prithvi Murthy, Department of Orthopaedic Surgery, University of Michigan School of Medicine, Biological Sciences Research Building, Room 2009, Ann Arbor, MI 48109, USA.
Riyad Tayim, Department of Orthopaedic Surgery, University of Michigan School of Medicine, Biological Sciences Research Building, Room 2009, Ann Arbor, MI 48109, USA. Wright State University Boonshoft School of Medicine, Dayton, OH 45435, USA.
Gorav Sharma, Department of Orthopaedic Surgery, University of Michigan School of Medicine, Biological Sciences Research Building, Room 2009, Ann Arbor, MI 48109, USA.
References
- 1.Bornstein P, Sage E. Matricellular proteins: extracellular modulators of cell function. Curr Opin Cell Biol. 2002;14:608–616. doi: 10.1016/s0955-0674(02)00361-7. [DOI] [PubMed] [Google Scholar]
- 2.Bornstein P, Armstrong LC, Hankenson KD, Kyriakides TR, Yang Z. Thrombospondin 2, a matricellular protein with diverse functions. Matrix Biol. 2000;19:557–568. doi: 10.1016/s0945-053x(00)00104-9. [DOI] [PubMed] [Google Scholar]
- 3.Hankenson KD, Bain SD, Kyriakides TR, Smith EA, Goldstein SA, Bornstein P. Increased marrow-derived osteoprogenitor cells and endosteal bone formation in mice lacking thrombospondin 2. J Bone Miner Res. 2000;15:851–862. doi: 10.1359/jbmr.2000.15.5.851. [DOI] [PubMed] [Google Scholar]
- 4.Hankenson KD, Bornstein P. The secreted protein thrombospondin 2 is an autocrine inhibitor of marrow stromal cell proliferation. J Bone Miner Res. 2002;17:415–425. doi: 10.1359/jbmr.2002.17.3.415. [DOI] [PubMed] [Google Scholar]
- 5.Alford AI, Terkhorn SP, Reddy AB, Hankenson KD. Thrombospondin-2 regulates matrix mineralization in MC3T3-E1 pre-osteoblasts. Bone. 2010;46:464–471. doi: 10.1016/j.bone.2009.08.058. [DOI] [PMC free article] [PubMed] [Google Scholar]
- 6.Shitaye HS, Terkhorn SP, Combs JA, Hankenson KD. Thrombospondin-2 is an endogenous adipocyte inhibitor. Matrix Biol. 2010;29:549–556. doi: 10.1016/j.matbio.2010.05.006. [DOI] [PMC free article] [PubMed] [Google Scholar]
- 7.Taylor DK, Meganck JA, Terkhorn S, Rajani R, Naik A, O’Keefe RJ, Goldstein SA, Hankenson KD. Thrombospondin-2 influences the proportion of cartilage and bone during fracture healing. J Bone Miner Res. 2009;24:1043–1054. doi: 10.1359/jbmr.090101. [DOI] [PMC free article] [PubMed] [Google Scholar]
- 8.Volpert OV, Tolsma SS, Pellerin S, Feige JJ, Chen H, Mosher DF, Bouck N. Inhibition of angiogenesis by thrombospondin-2. Biochem Biophys Res Commun. 1995;217:326–332. doi: 10.1006/bbrc.1995.2780. [DOI] [PubMed] [Google Scholar]
- 9.Kyriakides TR, Zhu YH, Smith LT, Bain SD, Yang Z, Lin MT, Danielson KG, Iozzo RV, LaMarca M, McKinney CE, Ginns EI, Bornstein P. Mice that lack thrombospondin 2 display connective tissue abnormalities that are associated with disordered collagen fibrillogenesis, an increased vascular density, and a bleeding diathesis. J Cell Biol. 1998;140:419–430. doi: 10.1083/jcb.140.2.419. [DOI] [PMC free article] [PubMed] [Google Scholar]
- 10.Hiltunen A, Vuorio E, Aro HT. A standardized experimental fracture in the mouse tibia. J Orthop Res. 1993;11:305–312. doi: 10.1002/jor.1100110219. [DOI] [PubMed] [Google Scholar]
- 11.Aubin JE. Osteoprogenitor cell frequency in rat bone marrow stromal populations: role for heterotypic cell–cell interactions in osteoblast differentiation. J Cell Biochem. 1999;72:396–410. [PubMed] [Google Scholar]
- 12.Carlson CB, Lawler J, Mosher DF. Structures of thrombospondins. Cell Mol Life Sci. 2008;65:672–686. doi: 10.1007/s00018-007-7484-1. [DOI] [PMC free article] [PubMed] [Google Scholar]
- 13.Lee NV, Sato M, Annis DS, Loo JA, Wu L, Mosher DF, Iruela-Arispe ML. ADAMTS1 mediates the release of antiangiogenic polypeptides from TSP1 and 2. EMBO J. 2006;25:5270–5283. doi: 10.1038/sj.emboj.7601400. [DOI] [PMC free article] [PubMed] [Google Scholar]
- 14.Lind T, McKie N, Wendel M, Racey SN, Birch MA. The hyalectan degrading ADAMTS-1 enzyme is expressed by osteoblasts and up-regulated at regions of new bone formation. Bone. 2005;36:408–417. doi: 10.1016/j.bone.2004.11.008. [DOI] [PubMed] [Google Scholar]
- 15.Rehn AP, Birch MA, Karlstrom E, Wendel M, Lind T. ADAMTS-1 increases the three-dimensional growth of osteoblasts through type I collagen processing. Bone. 2007;41:231–238. doi: 10.1016/j.bone.2007.04.187. [DOI] [PubMed] [Google Scholar]
- 16.Manduca P, Castagnino A, Lombardini D, Marchisio S, Soldano S, Ulivi V, Zanotti S, Garbi C, Ferrari N, Palmieri D. Role of MT1-MMP in the osteogenic differentiation. Bone. 2009;44:251–265. doi: 10.1016/j.bone.2008.10.046. [DOI] [PubMed] [Google Scholar]
- 17.Geoffroy V, Marty-Morieux C, Le Goupil N, Clement-Lacroix P, Terraz C, Frain M, Roux S, Rossert J, de Vernejoul MC. In vivo inhibition of osteoblastic metalloproteinases leads to increased trabecular bone mass. J Bone Miner Res. 2004;19:811–822. doi: 10.1359/JBMR.040119. [DOI] [PubMed] [Google Scholar]
- 18.Kyriakides TR, Zhu YH, Yang Z, Bornstein P. The distribution of the matricellular protein thrombospondin 2 in tissues of embryonic and adult mice. J Histochem Cytochem. 1998;46:1007–1015. doi: 10.1177/002215549804600904. [DOI] [PubMed] [Google Scholar]
- 19.Bab IA, Einhorn TA. Polypeptide factors regulating osteogenesis and bone marrow repair. J Cell Biochem. 1994;55:358–365. doi: 10.1002/jcb.240550313. [DOI] [PubMed] [Google Scholar]
- 20.Bab I, Gazit D, Chorev M, Muhlrad A, Shteyer A, Greenberg Z, Namdar M, Kahn A. Histone H4-related osteogenic growth peptide (OGP): a novel circulating stimulator of osteoblastic activity. EMBO J. 1992;11:1867–1873. doi: 10.1002/j.1460-2075.1992.tb05238.x. [DOI] [PMC free article] [PubMed] [Google Scholar]
- 21.Brager MA, Patterson MJ, Connolly JF, Nevo Z. Osteogenic growth peptide normally stimulated by blood loss and marrow ablation has local and systemic effects on fracture healing in rats. J Orthop Res. 2000;18:133–139. doi: 10.1002/jor.1100180119. [DOI] [PubMed] [Google Scholar]
- 22.Amsel S, Maniatis A, Tavassoli M, Crosby WH. The significance of intramedullary cancellous bone formation in the repair of bone marrow tissue. Anat Rec. 1969;164:101–111. doi: 10.1002/ar.1091640107. [DOI] [PubMed] [Google Scholar]
- 23.Gazit D, Karmish M, Holzman L, Bab I. Regenerating marrow induces systemic increase in osteo-and chondrogenesis. Endocrinology. 1990;126:2607–2613. doi: 10.1210/endo-126-5-2607. [DOI] [PubMed] [Google Scholar]
- 24.Bab I, Gazit D, Massarawa A, Sela J. Removal of tibial marrow induces increased formation of bone and cartilage in rat mandibular condyle. Calcif Tissue Int. 1985;37:551–555. doi: 10.1007/BF02557840. [DOI] [PubMed] [Google Scholar]
- 25.Pignolo RJ, Kassem M. Circulating osteogenic cells: implications for injury, repair, and regeneration. J Bone Miner Res. 2011;26:1685–1693. doi: 10.1002/jbmr.370. [DOI] [PubMed] [Google Scholar]
- 26.Kumagai K, Vasanji A, Drazba JA, Butler RS, Muschler GF. Circulating cells with osteogenic potential are physiologically mobilized into the fracture healing site in the parabiotic mice model. J Orthop Res. 2008;26:165–175. doi: 10.1002/jor.20477. [DOI] [PubMed] [Google Scholar]
- 27.Boban I, Barisic-Dujmovic T, Clark SH. Parabiosis model does not show presence of circulating osteoprogenitor cells. Genesis. 2010;48:171–182. doi: 10.1002/dvg.20602. [DOI] [PubMed] [Google Scholar]