

Abstract
A hallmark feature of Huntington's disease pathology is the atrophy of brain regions including, but not limited to, the striatum. Though MRI studies have identified structural CNS changes in several Huntington's disease (HD) mouse models, the functional consequences of HD pathology during the progression of the disease have yet to be investigated using in vivo functional MRI (fMRI). To address this issue, we first established the structural and functional MRI phenotype of juvenile HD mouse model R6/2 at early and advanced stages of disease. Significantly higher fMRI signals [relative cerebral blood volumes (rCBVs)] and atrophy were observed in both age groups in specific brain regions. Next, fMRI results were correlated with electrophysiological analysis, which showed abnormal increases in neuronal activity in affected brain regions, thus identifying a mechanism accounting for the abnormal fMRI findings. [14C] 2-deoxyglucose maps to investigate patterns of glucose utilization were also generated. An interesting mismatch between increases in rCBV and decreases in glucose uptake was observed. Finally, we evaluated the sensitivity of this mouse line to audiogenic seizures early in the disease course. We found that R6/2 mice had an increased susceptibility to develop seizures. Together, these findings identified seizure activity in R6/2 mice and show that neuroimaging measures sensitive to oxygen metabolism can be used as in vivo biomarkers, preceding the onset of an overt behavioral phenotype. Since fMRI-rCBV can also be obtained in patients, we propose that it may serve as a translational tool to evaluate therapeutic responses in humans and HD mouse models.
Introduction
Huntington's disease (HD) is a fatal inherited neurodegenerative disorder characterized by an increased number of glutamine repeats in the N-terminal region of the huntingtin protein (mhtt) (Gusella et al., 1983). Clinically, the disorder is characterized by a progressive decline in cognitive and motor function, and the most vulnerable neuronal population in HD is the medium spiny neurons within the striatum (st.) (Vonsattel and DiFiglia, 1998). Grossly, HD brains are characterized by marked atrophy in both the caudate nucleus and putamen, producing large ventricular volumes. Recent high-resolution MRI studies in HD patients and mouse models have identified significant extrastriatal volume losses (Aylward et al., 1998; Rosas et al., 2003; Bohanna et al., 2008; Lerch et al., 2008; Sawiak et al., 2009a). While the use of structural MRI capable of detecting subtle variations in brain volumes has increased substantially in recent years to study animal models of disease (Bohanna et al., 2008; Lerch et al., 2011) functional MRI (fMRI) has not been widely implemented to study mouse models, owing partly to its limited spatial resolution. fMRI, however, holds the advantage of perhaps identifying metabolic abnormalities that appear before structural changes (Wu and Small, 2006). Considering this, we used in vivo functional and structural brain MRI to study R6/2 mice, an HD model well characterized anatomically, and behaviorally and widely used for therapeutic trials (Li et al., 2005; Menalled et al., 2010) at time points corresponding to minor and full symptomatology in the animal model.
Although the molecular and cellular mechanisms underlying neurohemodynamic coupling are not fully known (Logothetis et al., 2001; Logothetis and Pfeuffer, 2004; Lauritzen, 2005), there is a general consensus that neuronal activation correlates with changes in hemodynamic MRI signals in the physiologically intact brain (Huppert et al., 2009; Tian et al., 2010). These signals are a complex function of change in cerebral blood flow (CBF), cerebral blood volume (CBV) and blood oxygenation [i.e., blood oxygen level-dependent (BOLD) signal]. Specifically, the local cerebral metabolic rate of oxygen consumption, CBF, and CBV are all increased during neuronal activity (Mueggler et al., 2003; Lauritzen, 2005). The recent development of MRI techniques that generate relative CBR (rCBV) maps with high spatial resolution (Moreno et al., 2006, 2007) allowed us to observe abnormally high MRI-rCBV values in several brain regions that demonstrated age-dependent regional atrophy in R6/2 mice when examined with structural MRI.
Experiments demonstrating the integrity of the blood–brain barrier (BBB) of the model used—an assumption made when performing rCBV measurements—are also presented.
It is important to keep in mind that several disorders might directly target brain vasculature and that rCBV mapping might not reflect underlying neuronal function in these cases. Furthermore, since fMRI is an indirect measure of brain metabolism/activity, we also assessed in vivo brain metabolism more directly using neuronal glucose uptake and evaluated activity electrophysiologically. Finally, we studied the behavioral correlates of the hyperexcitability we observed in vitro.
The results allow us to evaluate hemodynamic coupling to neural activity (termed neurovascular coupling) at baseline as well as neurometabolic coupling, which matches neuronal energy demand to neuronal metabolism. Understanding these relationships is of particular importance considering recent reports of abnormal metabolism in HD pathology (Mochel and Haller, 2011).
Materials and Methods
R6/2 mice
Animal care was in accordance with the United States Public Health Service Guide for the Care and Use of Laboratory Animals. Procedures were approved by the Institutional Animal Care and Use Committee at Psychogenics Inc. using Columbia University and SUNY Downstate guidelines. R6/2 transgenic mice expressing the N-terminal region of a mutant human huntingtin gene (Menalled et al., 2010), and wild-type (WT) littermates were generated by crossing ovarian-transplanted females (from R6/2 CBAxC57BL/6 female donors) with CBAxC57BL/6 F1 WT males. Genotype was determined at 15 d of age by PCR of tail snips (Menalled et al., 2010). Laragen Inc. measured CAG repeat lengths. The mean CAG number was 251 ± 8.12. All CAG repeat numbers reported here are those determined directly by Genemapper software. Mice were group housed (four to five per cage) in shoebox cages with wood shavings and a filter top. The environment was enriched with a play tunnel, shredded paper, and a plastic bone. Breeder animals also received cotton nestlets and igloos, instead of play tunnels. Food and water were available ad libitum.
A second group of 6-week-old male R6/2 and WT littermates was used for electrophysiology, 2-deoxyglucose (2DG) maps, and dynamic contrast-enhanced (DCE) MRI. The mean CAG number of the R6/2 mice used for these experiments was 239 ± 7 (n = 40).
Functional imaging
CBV maps were acquired using methods previously described (Moreno et al., 2007). Subjects were imaged with a Bruker AVANCE 400WB spectrometer (nuclear magnetic resonance) outfitted with an 89-mm-bore 9.4 tesla vertical Bruker magnet (Oxford Instruments), a birdcage RF probe with 30 mm inner diameter, and a shielded gradient system (100 G/cm). Anesthesia was used to immobilize the animals, and to minimize the fear and anxiety induced by the loud environment of the scanner. Like other fMRI studies in rodents, we used isoflurane for anesthesia [induction phase 3 volume percent (vol%) and maintenance 1.1–1.5 vol% at 1 l/min air flow, via a nose cone], under conditions that do not significantly affect heart rate, respiratory rate, or oxygen saturation (SaO2) in C57BL/6J mice (Moreno et al., 2006). Although isoflurane causes a decrease in global glucose uptake, it does not significantly uncouple the hemodynamic response at 1 minimal alveolar concentration (Lenz et al., 1998).
We relied on T2-weighted scans for CBV mapping in mice, as T2-weighted scans generate images with superior contrast compared with T1-weighted scans at high fields. Three scout scans were first acquired so we could position the subsequent T2-weighted images along the standard anatomical orientations in a reproducible manner. Optimal horizontal images were determined empirically by repositioning the animal to ensure that the animal's brain was located at the center of the MRI coils. Shimming was performed to optimize B0 field homogeneity. By running the auto-shim procedure, the three linear shim channels (x, y, and z) were automatically adjusted by means of an iterative software routine that maximized the area of the free inductive decay. T2-weighted images were obtained with a fast spin echo (FSE) sequence with TR/effective TE = 2000 ms/70 ms, rapid acquisition with relaxation enhancement factor = 16, FOV = 20 mm, acquisition matrix = 256 × 256, 16 slices, with a slice thickness = 0.6 mm, slice gap = 0.1 mm, and number of excitations (NEX) = 28. Each set of images required 15 min, and five sets of images were acquired sequentially. The first two sets were acquired precontrast, and the subsequent three sets were acquired postcontrast. Gadodiamide [Gd] (Omniscan, GE Healthcare) was injected (10 mmol/kg) via a 0.5 mm catheter placed intraperitoneally, and saline (2 ml) was injected intraperitoneally at the end of imaging to improve the clearance of the contrast agent.
Signal-to-noise ratio (SNR) was calculated as follows. First, the mean signal intensity (SI) of an appropriate region of interest (ROI) was measured in a precontrast baseline T2-weighted image. The average SD of an ROI of identical size as the surrounding air was then defined as noise. Subsequently, the SNR value was obtained using the following equation: SNR = mean SI − ROI (brain)/SD (air) ROI. Given the effect of Gd on the T2 signal, the contrast-to-noise ratio (CNR) was calculated as CNR = (mean ROI-SI pre − mean ROI-SI post)/SD (air) ROI pre.
ROI-rCBV data had a SNR with values between 17 and 25 and a CNR with values between 5 and 7. During imaging, acquisition CNR was also assessed by measuring the contrast-induced percentage change in signal in the thalamus (Th) (comparing the last postcontrast image to the precontrast image). If contrast-induced percentile change was <20%, an extra dose of 3 mmol/kg Gd was administered and a new postcontrast series was obtained 15 min later. If a 20% signal change was still not achieved, the images were rejected before analysis. Heart rate, respiratory rate, and SaO2 were continuously monitored using pulse oximetry (Model V33304, Sergivet). The probe was attached to the lower abdomen and normality of physiological parameters was used as criterion to continue with the imaging session. No significant differences were observed in the cardiovascular parameters monitored during MRI acquisition between controls and experimental groups in both ages.
An investigator blinded to subject grouping performed all image processing. Although anesthesia and soft head fixation effectively minimized head motion, the AIR program was used to coregister the images. A Gnu plot was generated to assess the quality of the coregistration, and an individual study was rejected if a shift >1 in plane voxel dimension was detected. CBV was mapped as changes of transverse relaxation rate (ΔR2) induced by the contrast agent (CA). Note that R2 = 1/T2. When the contrast agent reaches uniform distribution, then CBV maps can be measured from steady-state T2-weighted images as follows:
where TE is the effective echo time, Spre is the T2-weighted signal before CA administration, and Spost is the T2-weighted signal after CA reaches steady state. We have previously studied the kinetics of intraperitoneal gadolinium-generated CBV maps in C57BL/6J mice and identified the 37.5 min time point as the optimum postcontrast time interval (Moreno et al., 2006). The derived ΔR2 maps were then divided by 4 voxels with the highest ΔR2 measured from the posterior cerebral vein, yielding rCBV maps. We have published a discussion on the necessity for normalization of CBV maps (Moreno et al., 2006, 2007).
Additional fMRI methods: normative rCBV template
Individual rCBV maps were normalized as described above and subsequently were masked to include only the cerebrum before being introduced to the template-defining groupwise registration. Briefly, the template was generated using an instantiation of a bidirectional log-domain diffeomorphic registration procedure optimized by an asymmetric cost function, fully described by Sabuncu et al. (2009). Accounting for the asymmetry in a source–template coregistration yields more robust registration. The objective function used here accounted for such asymmetry by introducing a simple correction factor to the bidirectional objective function: the Jacobian determinant of the warp. The total number of images included was 43 (see Fig. 6). Note that these mice are not only the WT animals used for this study, but include mice used in other studies developed in our laboratory.
Figure 6.

Comparison of the standardized rCBV template against conventional 2DG slice. Qualitative assessment of the images reveals high concordance of 2DG slice signals (bottom) with in vivo rCBV MRI maps (top) at similar anatomical levels. See Materials and Methods for details.
Regions of interest selection
Horizontal slices
Striatum—dorsal striatum.
The lateral boundary follows the ventromedially facing concavity of the external capsule, which is inserted between its dorsal, lateral, and anterior margins and the neocortex (Neo). The medial boundary is the lateral ventricle (Ven), and globus pallidus, ventrally overlaps with the ventral st. and with the extended amygdala caudally. Given these anatomical references, a slice corresponding to the stereotaxic coordinates [in mm: interaural = 4.36, bregma = −5.64, based on the Mouse Brain Library (MBL) C57/BlJ6 atlas (www.mbl.org)] was selected to identify a dorsal st. ROI.
Motor cortex.
Primary motor cortex (PMC; M1) was identified in an axial slice corresponding to the stereotaxic coordinates (in mm; interaural = 6.26, bregma = −3.24), based on the MBL C57/BlJ6 atlas (www.mbl.org).
Prefrontal cortex.
This structure is composed of the anterior cingulate, agranular insular cortex, and orbitofrontal cortex. A slice at the same level than motor cortex was selected to identify the prefrontal cortex (PFC) ROI. The temporal auditory cortices (Au1–2, Aud, based on mbl.org atlas) were identified in the same slice.
Hippocampus.
A slice acquired through the mid-body of the hippocampal formation provides optimal visualization of hippocampal morphology and internal architecture. The external morphology of the hippocampus (Hc) was manually traced, as was the internal architecture that follows the hippocampal sulcus and the internal white matter tracts (Fig. 1A,B) [corresponding to the stereotactic coordinates: interaural = 4.36 mm, bregma = −8.64 mm (www.mbl.org)].
Figure 1.
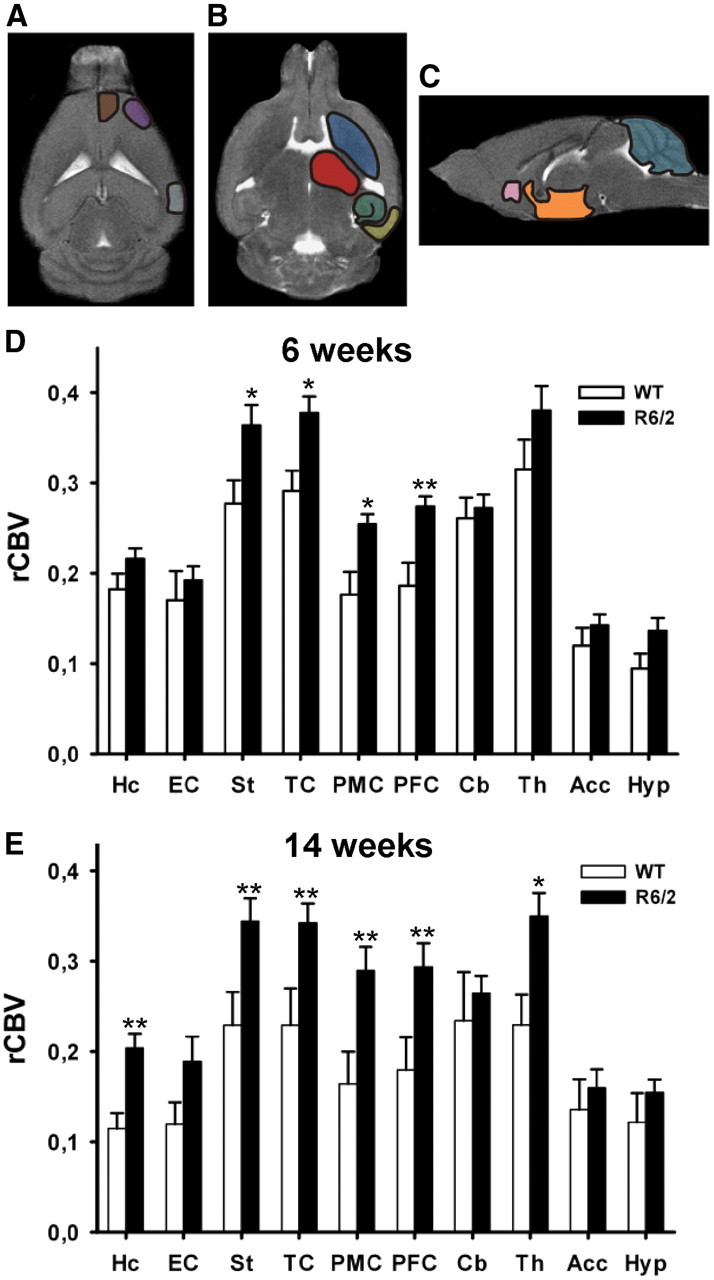
Abnormal cerebral blood volumes in HD mice. A–C, Horizontal (A, B) and sagittal (C) sections of T2-weighted images from a 6-week-old WT C57BL/6J mouse. Regions of interest were identified within: Hc (green), EC (yellow), st. (dark blue), TC (gray), PMC (purple), PFC (brown), Cb (light blue), Th (red), Acc (pink), and Hyp (orange). D, E, Mean normalized rCBVs and SD were measured from each region of interest in R6/2 and WT mice in 6-week-old (D) and 14-week-old mice (E). Note that both at 6 and 14 weeks there were significant larger rCBV values in R6/2 mice, compared with WT mice in specific regions. *p ≤ 0.05, **p ≤ 0.01.
Entorhinal cortex.
At the same levels as the hippocampus, the lateral boundary follows the gray/white junction of the perirhinal cortex; the medial boundary is the medial aspect of the temporal lobe; the superior boundary is the beginning of the collateral sulcus; the inferior boundary is the lateral tip of the brain.
Thalamus.
The thalamus was indentified at the same level as Hc and entorhinal cortex (EC), following the MBL atlas (www.mbl.org).
Sagittal slices
Nucleus accumbens.
The nucleus accumbens (Acc) is beneath the rostral caudate–putamen, and the boundaries are formed by the external capsule [corresponding to the stereotactic coordinates: bregma = 0.3–1.5 mm, lateral = 1.1 mm, ventrodorsal (VD) = 6–4.8 mm (based on Allen Brain Atlas)].
Cerebellum.
This structure was identified in a slice at the same level as Acc.
Hypothalamus.
The hypothalamus (Hyp) was identified in the same slice as Acc (VD = 6–5 mm; bregma = 0 to −2 mm; lateral = 1.1 mm).
Structural imaging
The MR images generated for functional analysis were used to obtain anatomical volumes as well. 2D FSE imaging was used to generate brain volumes using the ITK-SNAP program (Yushkevich et al., 2006), which allows for active contour generation. For the present work, manual boundary drawing was used, which involved slice-by-slice boundary drawing on available orthogonal views. This method has a coupling cursor between 2D slices and the 3D display, which significantly helps to reduce slice-by-slice jitter that occurs in this type of segmentation. Manual segmentation was performed by three highly trained raters using a standard anatomical atlas. We had previously compared 2D FSE- and 3D gradient echo-generated structural data; although there was a high correlation between 2D and 3D MRI measurements (r = 0.87; Moreno et al., 2011), 2D images consistently provided slightly higher volumes. The volumes measured in 2D images were obtained by multiplying the pixel size by the interslice distance (SI) of 0.7 mm. A slight overestimation may have resulted because the volume from where the signal is obtained reflects a smaller slice thickness (ST; 0.6 mm). Therefore, we calculated the average height in the slice dimension for a given ROI (Hs) and multiplied the 2D volumes by the following correction factor, as follows: [1 − (1 − ST/SI)/Hs)]. For instance, for Hs = 1.2: (1 − (0.6/0.7)/1.2 = 0.88; for Hs = 2.34: (1 − (1 − 0.6/0.7)/2.34) = 0.94. We therefore used this correction factor in all data presented. Both rCBV-ROIs and anatomical ROI segmentations were compared among the three highly trained raters using common intraclass correlation statistics. The analysis showed high agreement among the raters for all the ROIs analyzed with values between 0.887 and 0.986.
Blood–brain barrier permeability measurements
DCE MR images were acquired using the protocol described in Vlachos et al. (2010). In short, a gradient echo pulse sequence was used in the temporal DCE MR images before and after I.P. administration of Gd. Images were acquired with a T1-weighted 2D FLASH sequence of a 192 × 128 matrix size (reconstructed to 256 × 128), a resolution of 130 × 130 μm2 (reconstructed to 98 × 130 μm2), a flip angle of 70°, TR of 230 ms, TE of 2.9 ms, and a slice thickness of 0.6 mm without any interslice gap. The NEX was equal to four, and the acquisition time was 88 s. The Gd bolus was manually injected at a rate of ∼10 μl/s. Mice were imaged in the same 9.4 T MRI system described above. Reference region model (RRM) was used for the quantitative assessment of permeability. RRM requires a reference region concentration profile, similar to the examined region, to be fitted optimally and estimate the Ktrans [the transfer rate constant from the intravascular system to the extravascular space (ES)] values correctly. The epicranial muscle was selected as the reference region because of its intrinsic homogeneity in their anatomic structure and its similar longitudinal relaxation time to the gray matter. All the images were filtered before the concentration fitting, using the N-D filtering function of the Image Processing ToolboxTM in Matlab R2008b (MathWorks). Major vessels were not taken into account in the fitting wherever possible, by avoiding the corresponding regions where Gd concentration followed an exponential decaying pattern. Permeability maps and Ktrans were then calculated using methods described by Yankeelov et al. (2005) and Vlachos et al. (2010).
The general kinetic model is described by:
where Ct is the tracer concentration in the ES, t is the time, Cp is the tracer concentration in the blood plasma, and Kep is the transfer rate constant from the ES to the intravascular system.
The RRM model is described by:
where Cref and Cp are the Gd concentrations in the reference region and the blood plasma, respectively, Kref-trans is the transfer rate constant from reference region to extravascular space, and Kref-ep is the transfer rate constant from reference region to intravascular space. Combining Equation 1 with Equation 2, Cp can be eliminated and the temporal concentrations of Ct and Cref are then fitted using Levenberg–Marquardt algorithm, yielding relative permeability values. The Ktrans value is finally calculated using the product of the relative permeability and the corresponding reference region permeability.
Electrophysiology
Horizontal hippocampal brain slices, which contain auditory temporal cortex (TC), lateral and medial entorhinal cortex, subicular complex, CA1, CA3, and DG of 400 μm thickness were prepared. This slice has an orientation that is similar to the middle hippocampus MRI slice used. Experiments were done in an interface chamber (Fine Scientific Tools). The artificial CSF (aCSF) contained the following (in mm): 157 Na+, 136 Cl−, 5 K+, 1.6 Mg2+, 2 Ca2+, 26 HCO3−, and 11 d-glucose. Slices were perfused with aCSF continuously bubbled with 95% O2/5% CO2, to maintain pH near 7.4, and the temperature was set at 34°C. Platinum stimulating electrodes connected to a stimulus isolation unit (Grass S88) were used to evoke normal EPSPs between superficial layers of EC (stimulated) to subiculum (Sub; recorded) (data not shown). In all experiments, the slices were allowed to recover from the isolation procedure for at least 1.5 h before the beginning of the experiments. Borosilicate electrodes of 2–3 MΩ filled with 150 mm NaCl were used to measure local field potentials (LFPs). Extracellular recordings were performed using an Axoclamp 2B amplifier (Molecular Devices), filter (0.1 Hz to 10 kHz using −6 dB/octave). Voltage signals were digitized and store in a PC using a digidata 1200 A (Molecular Devices) for off-line analysis. Data were analyzed using the Neuromatic routines run in an Igor platform (Wavemetrics).
[14C] 2-deoxyglucose procedure
Each animal was injected intraperitoneally with 125 μCi/Kg body weight [14C] 2DG; specific activity 55 mCi/mm; Perkin-Elmer Life Science). The traditional 2DG method was performed as outlined before (Sokoloff et al., 1977). After 45 min of 2DG circulation, the animals were killed with a lethal dose of sodium pentobarbital (60 mg, i.p.). At that time, blood samples were obtained. All samples were kept cold on ice until pipetted into scintillation fluid. Plasma 14C was determined (LS1800 scintillation counter, Beckman). The brain was removed and frozen in 2-methylbutane at −20°C for 5 min, coated with matrix, and stored at −70°C. Brains were sectioned horizontally at 20 μm and stained with thionin, which binds to acidic proteins and nucleic acids. Sections were exposed to KODAK MinR film along with 14C standards (GE Healthcare) for 15–30 d. Films were analyzed for local cerebral glucose metabolism using the MCID M6 Elite system (Imaging Research). Final tissue 2DG concentration was calculated. We determined the cerebral glucose consumption in gray matter of PMC, PFC, auditory TC, dorsal st., Th, Hc, EC, cerebellum (Cb), and Acc using standard horizontal figure plates atlas (Paxinos and Franklin, 2001). Measures were also obtained in corpus callosum. Structures were identified bilaterally in four consecutive sections at 20 μm intervals, except for cerebellum and corpus callosum, which were drawn as a single ROI in the four sections. Reported are the mean values for gray matter normalized to the value of corpus callosum. Additionally, cell counts (thionin-labeled cells in 1.22 mm2) of three consecutive sections on both sides of PMC, PFC, and st. ROIs were performed.
Additional 2DG analysis methods: generating a composite 2DG image
Three adjacent 20 μm 2DG maps corresponding to equivalent levels of the rCBV-MRI atlas were used. Each of the three slices representing an equivalent MRI level were transformed to the central image within the level using a 2-D 3 df linear spatial transformation, generating a mean image. 2DG values were normalized to the average 2DG signal in the corpus callosum (see Fig. 6).
Seizures analysis
Population audiogenic seizure (AGS) sensitivity was determined by exposing mice to a high-intensity siren of 1800–6300 Hz (frequency peak) with an average sound pressure level of 125 dB at 11 cm (Personal Alarm, Model 49-417, Tandy Corporation) for up to 10 min in an empty plastic box with a sound-absorbent tile lid under which the siren was mounted (Yan et al. (2004)). Mice were tested between 03:00 P.M. and 05:00 P.M. for possible circadian variation. They were placed individually in the bell chamber and allowed to explore for 15 s; the bell was then rung for 60 s. None of the mice tested had previous exposure to acoustic stimulation. Mice were videotaped throughout the sound exposure. Video recordings were analyzed in slow motion by the experimenter and independently by a second rater who was blind to genotype. Animals having seizures in Table 1 were those exhibiting a score ≥ 1. Seizures were counted and rated according to the Racine scale (Racine, 1972) and classified as follows: grade 1, mouth movements; grade 2, head nodding; grade 3, forelimb clonus; grade 4, rearing with clonus; grade 5, full motor seizures (tonic-clonic). The number of seizures was counted as the number of episodes with the maximum grade of each seizure being used to designate each episode. Thus, if a mouse exhibited a grade 4 seizure, which included forelimb clonus and mouth movements, it was counted as a grade 4 seizure. Seizure grades were compared between groups using a nonparametric Mann–Whitney U test. Seizures were also grouped as severe (grades 4–5) and mild–moderate (grades 1–3), and then compared using the same nonparametric test. In both cases, the result was identical.
Table 1.
R6/2 mice have increased susceptibility to audiogenic seizures
| Group | Clinical seizures |
||
|---|---|---|---|
| Number of mice with seizures | Racine scale | Deaths | |
| WT | 1 | 1 | 0 |
| 1 | 2 | ||
| R6/2 | 2 | 3 | 2 |
| 4 | 4 | ||
| 2 | 5 | ||
Shown are each mouse that developed seizures of eight mice per group (WT and R6/2, n = 16). Note that all R6/2 mice had seizures with varying intensities; only two WT mice had abnormal behavior induced by the siren that met the criteria for ictal events.
Statistical methods
Repeated-measures ANOVA was used to identify ROI-specific genotype differences. The p values were adjusted for multiple comparisons using a false discovery rate correction. Akaike's information criterion was used to determine whether a heterogeneous model (allowing a separate variance term for each ROI) provided a better fit. t Tests and Mann–Whitney tests were used to compare distributions between groups, and Pearson correlation was used to test for associations. The specific selection of variables and methods for each experiment is described in the Results section. All repeated-measures analyses were implemented using PROC MIXED under SAS, version 9.2 (SAS Institute).
Results
Early and progressive increase in MRI-rCBV values in R6/2 mice
R6/2 mice and age-matched wild-type littermates were genotyped for CAG repeat number (see Materials and Methods) and were imaged at 6 and 14 weeks of age (n = 10 per genotype and age group, total n = 40); sex was equally distributed between the groups. rCBV maps were reconstructed from MR acquisitions before and after intraperitoneal injection of Gd contrast as previously described (Moreno et al., 2006, 2007). Data are presented as normalized ΔR2 values ≈ rCBV (see Materials and Methods). rCBV mapped from ΔR2 can be influenced even by relatively small changes in physiological parameters, particularly the final cerebral vascular concentration of the contrast agent. To circumvent such variability when comparing different groups of mice, ΔR2 measurements were normalized to the maximum (4 pixels) ΔR2 signal in the posterior cerebral vessels (an area determined to have the highest contrast agent concentration) (Moreno et al., 2006, 2007).
We first examined whether cerebral rCBV was compromised in 6-week-old R6/2. ROI analyses of rCBV included but were not restricted to brain structures commonly affected in human and mouse models of HD: the PMC, PFC, TC, dorsal st., Th, Hc, and EC. In the sagittal views, the regions of interest were as follows: Cb, Acc, and Hyp (Fig. 1A–C) (Aylward et al., 1998; Rosas et al., 2003; Bohanna et al., 2008; Lerch et al., 2008; Sawiak et al., 2009a).
Mean ROI rCBV values were compared between R6/2 mice and controls using repeated-measures ANOVA, and sex was included as covariate. The analysis revealed that 6-week-old R6/2 mice had significantly higher rCBV values in PFC (t(162) = 3.43; p = 0.008), PMC (t(162) = 2.75; p = 0.022), TC (t(162) = 2.83; p = 0.022), and st. (t(162) = 2.84; p = 0.022). Parallel in the 14-week-old group, recapitulated these results—PFC (t(162) = 3.69; p = 0.001), PMC (t(162) = 3.11; p = 0.006), TC (t(162) = 3.43; p = 0.003), and st. (t(162) = 3.64; p = 0.001)—and also demonstrated higher rCBV in Th (t(162) = 2.25; p = 0.043) and Hc (t(162) = 3.89; p = 0.001) (Fig. 1E). Nota bene: no sex effects were noted within these comparisons, and no age by genotype interaction was observed.
Furthermore, bivariate correlation analysis between rCBV values in R6/2 mice of both age groups and CAG repeat number showed no statistically significant correlation between groups. The results indicate that R6/2 mice develop early focal increases in brain rCBV. The striatum and neocortex, areas known to be affected early in humans with HD (Vonsattel et al., 1985; Rosas et al., 2003) were found to have abnormally high rCBV values in younger R6/2 mice. These differences progressively spread to other brain regions, most notably the thalamus and the hippocampus. Areas such as the entorhinal cortex—the hippocampus' main input—cerebellum, hypothalamus, or nucleus accumbens were unaffected.
In the steady-state rCBV method used here, it is assumed that the BBB remains intact (Lin et al., 1999). An in vivo Gd-based DCE MRI protocol to evaluate the integrity of BBB (Vlachos et al., 2010) in R6/2 mice and controls (n = 6 per group) was performed. In a general kinetic two-compartment model, the tissue is assumed to consist of the blood plasma and extracellular extravascular space, and the tracer exchange (Gd) between these two body compartments is defined by two transfer rate constants, Ktrans and Kep. Permeability maps were generated, and the Ktrans values were calculated (see Materials and Methods) for a predefined ROI (neocortex and striatum). Mean ROI Ktrans values were compared between R6/2 mice and controls using a t test. The analysis revealed that WT and R6/2 mice had negligible Ktrans values and were not significantly different in the regions analyzed: neocortex (0.00033 ± 0.00016 vs 0.0017 ± 0.0004 min, mean ± SD) and striatum (0.00021 ± 0.0001 vs 0.00022 ± 0.0000 min). These data indicate that the BBB in both groups has normal permeability values.
Structural abnormalities in R6/2 mice
To investigate whether the fMRI signal changes detected in R6/2 mice accompanied structural changes, we subjected the same horizontal 2D T2 images used for the fMRI analysis to ROI volumetric analysis in the following regions: Vens, Hc, Neo, st., Cb, and whole brain (WB) (Fig. 2A).
Figure 2.

Volumetric analysis of R6/2 and WT mice. A, Shown are horizontal sections of T2-weighted images from ventral to dorsal levels at 0.7 mm intervals, regions measured were as follows: Ven (red), Hc (green), Cb (orange), st. (blue), Neo (yellow), and WB. B, The volumes of R6/2 mice were not significantly different from WT controls in any of the brain regions analyzed at 6 weeks of age. C, The volumes of the neocortex, striatum, and hippocampus were significantly smaller in 14-week-old R6/2 mice compared with WT mice. D, A significant inverse linear correlation was found between prefrontal cortex normalized rCBV values and neocortical volumes. Values are given as mean volume (in cubic millimeters) and SD for the different areas. *p < 0.05.
Results from different regions were covaried with and separately normalized to whole-brain volume. Because the results of the statistical analyses using these normalized values did not vary substantially from those using raw values, only the raw values are reported.
As with rCBV, ROI volumetric analysis was performed in repeated-measures ANOVA, and sex was included as a covariate. Results in the 6-week-old group demonstrated no statistically significant ROI volume differences (Fig. 2B), while 14-week-old R6/2 mice showed significant volume loss in the striatum (18.76 ± 1.8 vs 23.43 ± 2.4 mm3, t(68) = 4.69; p < 0.001), hippocampus (19.19 ± 1.6 vs 22.87 ± 2.5 mm3, t(68) = 3.79; p = 0.001), and neocortex (101.94 ± 11.8 vs 126.40 ± 11.2, mm3, t(68) = 5.38; p < 0.001) when compared with WT mice (Fig. 2C). A significant age X genotype interaction on the progression of brain atrophy was observed in the hippocampus (F(3,140) = 4.62; p = 0.004), neocortex (F(3,140) = 12.3; p < 0.001), and striatum (F(3,140) = 15.01; p < 0.001).
While previous studies demonstrated cerebellar atrophy in R6/2 mice (Sawiak et al., 2009a,b), we only noted a trend toward cerebellar volume loss in 14-week-old R6/2 mice (50. 93 ± 3.7 vs 53.2 ± 3.0 mm3; t(68) = 1.47; p = 0.181).
Thus, structural MRI data reveal that R6/2 mice develop progressive, region-specific, and age-dependent brain atrophy.
Given the demonstration of focal functional and structural abnormalities, we sought a bivariate correlation between rCBV and ROI volumes in R6/2 and WT mice. A significant inverse relationship was observed in R6/2 mice between neocortical volumes and rCBV values in the PMC (Pearson correlation = −0.508, p = 0.012) and PFC (Pearson correlation = −0.512, p = 0.011) (Fig. 2D). These correlations imply that rCBV values in neocortex are higher in more atrophied brain regions. The influence of volumetric changes on rCBV abnormalities were evaluated in an ANOVA covarying for ROI volume. There was no observed effect in this covariate model, suggesting that rCBV changes in R6/2 are not likely to be influenced by structural changes.
Increased neuronal synchronized activity in R6/2 mice
Given that increases in fMRI signal components have been linked empirically and theoretically to increases in neuronal activity (Lauritzen, 2005), we sought to correlate LFPs to rCBV values. Previous experiments have shown that LFPs are correlated to CBF responses (Lauritzen, 2005; Chaigneau et al., 2007; Piilgaard and Lauritzen, 2009) and that rCBV is related to CBF (i.e., rCBV = B.rCBFA, where A and B are obtained by manipulating PCO2 levels) (van Zijl et al., 1998; Rostrup et al., 2005). LFPs were then measured in a separate group of R6/2 and control littermate mice from the same colony (6-week-old WT and R6/2 mice, n = 8 males per group, with similar CAG repeat number).
Horizontal brain slices including hippocampus, entorhinal cortex, and temporal cortices were prepared as described above (Fig. 3A). Recordings from wild-type mouse slices show occasional spontaneous LFPs in several of the regions analyzed in the rCBV and volumetric studies (Fig. 3B). A summary of the characteristics of the events in superficial layers of auditory TC, lateral EC (LEC), and two subregions of the hippocampus, Sub, and dentate gyrus [DG] can be seen in Figure 3, D and E. The frequency and duration of events increased after 40 min of the GABAA blocker picrotoxin (50 μm) exposure; these changes remained present and grossly stable for the duration of the recording (∼5 h).
Figure 3.

Characterization of spontaneous LFPs in hippocampus-entorhinal-temporal cortex slices from wild-type and R6/2 mice. A, Inset, A typical slice where the regions recorded are indicated B, Representative traces depicting spontaneous LFPs in the different regions in slices from wild-type mice. C, Similar traces as in B from R6/2 mice. D, LFPs durations comparing WT and R6/2 mice in the different regions recorded. E, Comparison of LFPs frequencies (mean values and SD) in slices from wild-type mice versus R6/2 mice. Note that there were significant differences in the frequency of events in all areas analyzed. In contrast, although the durations trend to higher values in mutant mice, only LECs showed significant differences.
Figure 3C shows typical recordings obtained from brain slices prepared from R6/2 mice. The occurrence of higher-frequency spontaneous LFPs observed (Fig. 3E) was significantly greater than that in WT recordings at TC (Mann–Whitney U test, p = 0.0082), Sub (Mann–Whitney U test, p = 0.0080), DG (Mann–Whitney U test, p = 0.0043), and LEC (Mann–Whitney U test, p = 0.016). Low-frequency (0.02–0.03 Hz) LFP events lasting ≥1.5 s, characteristic of interictal-like events, were evident in the TC of 40% of R6/2 mice; no such discharges were observed in WT mice. Figure 3, D and E, summarizes population data in the regions described above. Addition of picrotoxin to slice preparations introduced a 5–20 min period of variable activity followed by a statistically significant increase in the frequency of events in all areas analyzed throughout the recording (Fig. 4B,D). Further still, the LEC was the only region studied in the preparations that demonstrated prolonged synchronized discharges interspersed among the shorter regular rhythmic discharges induced by GABAA blockade (Fig. 4C,D) (Mann–Whitney U test, p = 0.0095). Prolonged discharges were considered to be extensions of shorter spontaneous discharges for two reasons: first, they occurred at the time point at which a shorter synchronized discharge would have occurred, as predicted by the ongoing rhythmicity of the waveform; and second, the morphology of the prolonged events resembles that of the shorter synchronized discharges. A summary of the picrotoxin effects in the different regions is presented in Figure 4, C and D. Significant increases in picrotoxin-induced LFP discharge frequency (all regions) and duration (LEC only) were events unique to R6/2 mice. Having established LFPs as indicators of spontaneous neuronal activity in R6/2 mice, we next addressed whether such observed hyperexcitablity in vitro results in a propensity toward epileptogenesis. The synchronized discharges seen in R6/2 mice LEC resemble seizure-like events (Fig. 4E) as reported previously in vitro in this region (Kovács et al., 2009), perhaps indicating an increased susceptibility to seizures in this mouse model. Accordingly, population AGS sensitivity was determined by exposing 6-week-old male R6/2 and WT littermate mice to a high-intensity siren (Musumeci et al., 2000). When exposed to a 125 dB alarm, R6/2 animals typically displayed initial signs of epileptic activity in the form of frenzied running and jumping (videos showing the responses are available on request). Seizures were counted and graded according to the Racine scale (Racine, 1972), and results are shown in Table 1. While all 6-week-old R6/2 mice developed seizures graded at least at level 3 on the Racine scale, including 25% of this group that developed generalized tonic-clonic seizures leading to death, no WT mice developed seizures graded higher than level 2 on the Racine scale (Mann–Whitney U test, p = 0.01).
Figure 4.

Prolonged epileptiform discharges in LEC in slices from R6/2 mice after GABAA receptor blockade. A, Shown are spontaneous LFPs after 30 min bath application of 50 μm picrotoxin in the regions indicated in WT mice, to the right of each trace, there is a characteristic LFP induced by blocking GABAA. B, Changes induced by picrotoxin in R6/2 mice differ significantly from WT mice; shown are representative recordings and close up views of single events in the different regions. C, D, Comparisons of LFPs duration and frequencies (mean values and SD) in the different regions between WT and R6/2 mice. E, Example of an epileptiform discharge induced by 50 μm picrotoxin in LEC in an R6/2 mouse; to the right are plots of the LFP ≥1.5 s in duration in this region. *p < 0.05, **p < 0.01.
In vivo measurement of local glucose utilization
As established by numerous studies (Reiman et al., 1996; Costa et al., 1999; Rapoport, 2000; Small et al., 2000a,b; Dixon et al., 2002; El Fakhri et al., 2003), rCBV is a correlate of oxygen consumption and therefore typically reflects regional energy metabolism. Glucose utilization is another indicator of energy metabolism. To evaluate glucose utilization, high-resolution in vivo [14C] 2DG uptake (Torres-Reverón et al., 2006) was measured in 6-week-old R6/2 mice and WT littermates (n = 6 males per group).
Twenty-micrometer-thick axial whole-brain slices were obtained and evaluated for 2DG uptake in all areas analyzed in the rCBV study, except for the hypothalamus, which demonstrated a sectioning artifact in >20% of the sampled slices (Fig. 5A). Mean local cerebral glucose utilization (LCGU) values were expressed in nanocuries per gram in each ROI, and data were normalized to corpus callosum LGCU to account for the variability of radiotracer concentration available to the brain (see Materials and Methods).
Figure 5.
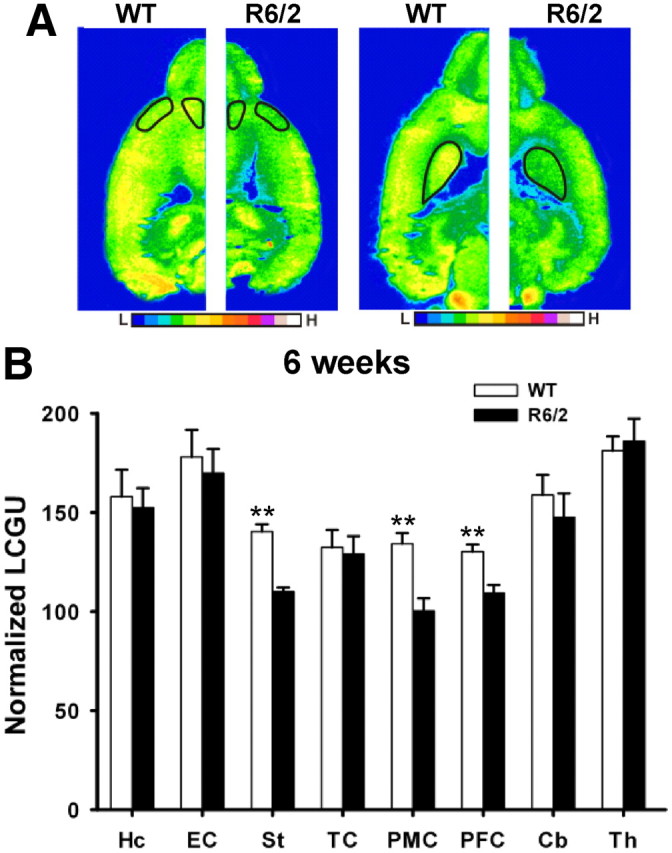
Decreased brain glucose uptake in R6/2 mice. A, Representative 2DG autoradiographic images (pseudocolor images) comparing 6-week-old WT and R6/2 mice, in basal conditions. ROIs are identified in the horizontal single-hemisphere slices at two different ventrodorsal levels as follows: PFC, PMC, and st. Calibration bars represent higher signals as warmer colors. B, Mean normalized glucose utilization and SD in several ROIs, as described above. *p < 0.05, **p < 0.01.
Repeated-measures ANOVA demonstrates that R6/2 mice had significantly lower glucose uptake in st. (110.14 ± 6.5 vs 140.38 ± 4.72, t(15) = 6.06; p < 0.001), PFC (109.21 ± 4.2 vs130.27 ± 4.6, t(15) = 4.26; p < 0.001), and PMC (100.33 ± 6.4 vs 134.25 +/−5.3, t(15) = 5.93; p < 0.001) (Fig. 5B). Whether observed reductions in metabolism arise from tissue loss in specific areas (Karow et al., 2010) was addressed by covarying the data analysis with cell number (see Materials and Methods) of the abnormal ROI. Covariation of LGCU results with this indicator of cell loss did not affect 2DG findings, and the average cell number was not found to be a significant predictor (F(1,15) = 0.4; p = 0.85). Though regional LGCU findings corroborated observations made in rCBV with respect to the focality of normal and abnormal metabolism (Figs. 1D, 5B), evidence for disrupted neurometabolic coupling was found. In fact, LGCU in the PMC, PFC, and st. was paradoxically low even though these regions demonstrated higher rCBV.
Discussion
Our main finding is that R6/2 mice develop early, region-specific metabolic abnormalities, particularly in the striatum and neocortex as detected by in vivo MRI and 2DG mapping. Further still, increased regional rCBV correlated well with increased neuronal excitability, manifested in vitro (slices) and in vivo (audiogenic seizures). We propose that this is indirect evidence of preserved neurovascular coupling in R6/2 mice. Brain metabolism requires glucose uptake and oxygen consumption. Neurohemodynamic coupling, however, is a product of both neurometabolic and neurovascular phenomena (Huppert et al., 2009), and our experiments show a paradoxical decrease in LGCU in R6/2 mice in regions with abnormally high rCBV values. This suggests that R6/2 mice have impaired neurometabolic coupling.
Measuring brain structure and function with MRI in R6/2 mice
Similar to our findings, atrophy in the striatum, cerebral cortex, and hippocampus has been previously reported in R6/2 mice using volumetric MRI (Sawiak et al., 2009a,b). The discrepancy from previous reports regarding cerebellar atrophy can be partially attributed to the accelerated disease progression in the R6/2 HD model (our cohort was 6- and 14-week-old vs 18 week-old mice).
To validate the physiological underpinnings of our fMRI findings, we performed experiments demonstrating the preserved integrity of the BBB in R6/2 mice and confirmed the validity of our steady-state rCBV findings. Both T2 and T2*-weighted images—each with its own advantages—can be used in rCBV Gd studies. We focused our report on T2-weighted changes as they provide a more accurate measure of the neuronal metabolism, to which microvascular CBV is most tightly coupled (Weisskoff et al., 1994; Simonsen et al., 2000).
In the present work, MRI-rCBV maps identified an early and progressive change in the HD group. While 6-week-old R6/2 mice showed focal increases of rCBV in different areas of the neocortex and striatum, older (14-week-old) mice also demonstrated rCBV elevation in the hippocampus and thalamus. Comparable to our findings in the young R6/2 mice, fMRI-BOLD studies in patients with >12 years to estimated onset of manifest HD (Zimbelman et al., 2007) exhibited an increased BOLD signal in several neocortical regions. In contrast to these findings in mice, patients demonstrated decreased activation in the striatum and cortical hyperactivation that converts to hypoactivation as one nears closer to onset of disease.
Correlation of structure and function with MRI
It has been proposed that brain tissue can display spurious metabolic decline, owing mainly to focal tissue loss (Powers et al., 2007). We found that anatomical volumes and normalized rCBV values were inversely correlated, and only significantly so in the neocortex of R6/2 mice. Covariation of rCBV group results with tissue loss did not affect the rCBV findings; this exemplifies the view that the relation between macrostructural and functional changes in microvasculature, such as rCBV is not straightforward. Finally, the lack of correlation between CAG number and rCBV values in R6/2 mice may be due in part to the low range of CAG values (243–262). Alternatively, it is possible that rCBV maps cannot detect more subtle differences in brain function related to the length of CAG repeats in R6/2 mice.
Neurovascular coupling in R6/2 mice
In contrast to several studies providing evidence that CBF and BOLD contrast signals correlate poorly with spiking activity (Logothetis et al., 2001; Kayser et al., 2004), CBF and BOLD signals have been shown to correlate strongly with LFPs, which perhaps indicate the level of neuronal synchronization in a circuit (Lauritzen, 2005; Chaigneau et al., 2007). Given the aforementioned consideration and the relationship between CBV and CBF (Rostrup et al., 2005), we expected that elevated regional rCBV might reveal increased baseline LFP activity, if neurovascular coupling to neuronal energy demand was indeed preserved in R6/2 mice. Our observation of spontaneous events resembling interictal discharges (Fig. 3C) and increased susceptibility to GABAA blocker-induced epileptiform discharges in R6/2 mice in different brain regions (Fig. 4B–E) suggests that this was the case.
The relationship of CBF or CBV to neuronal activity is often assessed simultaneously, particularly for evoked responses. Given the steady-state nature of rCBV measurements in our analysis, a separate evaluation of these two functions was informative.
Increased neuronal activity in 6-week-old R6/2 mice was also evidenced by increased susceptibility to audiogenic seizures. Note that complex discharges in cortical slices with shorter latencies to in vivo seizure onset induced by GABAA blockers in R6/2 mice have been reported (Cummings et al., 2009).
Mismatch between indictors of oxygen consumption and glucose utilization
2DG maps from 6-week-old R6/2 mice demonstrated a global decrease in average LCGU compared with WTs, contrasting against global increase in rCBV values of R6/2 mice at the same age. LCGU was significantly lower in R6/2 mice with and without accounting for regional atrophy in regions where abnormally high rCBV values were observed (Figs. 1D, 5B)—mainly st., PMC, and PFC. While TC demonstrated elevated rCBV, it revealed no significant difference in 2DG uptake. There was 100% concordance of the canonical relationship of rCBV to LGCU measures in those areas that showed no significant rCBV group differences. The lack of significance in TC LGCU values may be related to the difference in sensitivity of the techniques and/or the lower number of subjects in the 2DG experiments. These results were rather unexpected since previous studies found that basal rCBV values correlate with PET-FDG measures (González et al., 1995). Nevertheless, our results are consistent with reports that have recognized in HD patients (Antonini et al., 1996) and in mouse models (Tkac et al., 2007; Zhang et al., 2011) decreased brain glucose consumption and abnormal mitochondrial function in different organs (Mochel and Haller, 2011).
The mismatch of a functional brain imaging signal (rCBV) and glucose uptake (2DG) in R6/2 mice could be interpreted in at least three possible scenarios, which are not mutually exclusive. First, it is possible that multiregional neuronal loss and decrease in neuropil observed in R6/2 mice (Li et al., 2005) occurs at a rate faster than the observed microvasculature effects. It has been well documented that there is a mutual influence of nerves and blood vessels on the processes of angiogenesis and axonal guidance, respectively (Weinstein, 2005; Bell et al., 2010). Given this coordinated bidirectional influence, it can be expected that neuronal loss results in vascular reorganization. To this end, it is important to emphasize that the contrast-induced signal changed observed in our MRI sequence (fast spin echo − ΔR2) is heavily sensitive to changes in microvasculature, and particularly those in the venular system (van Zijl et al., 1998; Wu et al., 2003). Considering the capacitance of the postcapillary venules and the overcompensation of CBF and CBV responses to LFPs, it is feasible to envision relatively large rCBV in a structure despite its metabolic decline. Furthermore, this sustained activity can exist in the setting of impaired glucose utility, and perhaps the observed vascular effects serve to re-establish metabolic function in neurons with impaired glucose utilization. Second, it is also possible that decreased glucose utilization represents abnormal activity (silence) in interneuron populations. Though interneurons are believed to be relatively spared in HD (Vonsattel et al., 1985), recent reports have identified a reduction of cortical interneuronal function in R6/2 mice (Cummings et al., 2009). Decreasing interneuron metabolism would produce a robust effect in 2DG signal focally as, at least in the cortex, interneurons have stronger 2DG labeling relative to excitatory neurons (McCasland and Hibbard, 1997). Impaired interneuron function also provides a potential mechanism for the neuronal hyperexcitability observed in R6/2 mice. Finally, the abnormal brain glucose metabolism observed may also be related to dysfunction of glial cells. It has been shown that glia in R6/2 mice accumulate intranuclear htt. R6/2 glial cell dysfunction can contribute, for instance, to the inability to clear extracellular glutamate normally (Shin et al., 2005). It is therefore possible that decreased 2DG uptake represents, at least in part, the putative functional abnormalities observed in glial cells.
This possibility does not exclude the other two hypotheses, and in fact it provides an additional mechanism of increased neuronal excitability in R6/2 mice. The metabolic interaction between neurons and glia is complex and not free of controversies. Our results cannot conclude which of the cell types is more drastically affected. The current assumption is that glial energy needs range from 5% to 20% (Attwell and Laughlin, 2001; Rothman et al., 2003), whereas 80% to 95% of the energy needs concern the neuronal population. Other reports challenge this assumption by demonstrating equal amounts of 2DG taken up by the two cell populations in the resting brain (Nehlig et al., 2004). From these studies, it is clear that brain energy metabolism requires further research at the physiological level and in diseases such as HD.
The possibility that rCBV maps fail to indicate neuronal function appropriately is highly unlikely given the high spatial concordance between rCBV and 2-deoxyglucose maps in wild-type mice (Fig. 6). Since rCBV mapping may herald the earliest dysfunction seen in HD, it can potentially serve as a marker of disease progression and treatment efficacy in the setting of pharmaceutical interventions.
Footnotes
This work was supported in by awards from the CHDI Foundation, Inc. (formerly, High Q Foundation, Inc.) to H.M. and S.A.S. We thank K. Hess and F. Hua for animal MRI preparation and acquisition, and Dr. F. Vlachos for help with the dynamic contrast-enhanced MRI experiments.
The authors declare no competing financial interests.
References
- Antonini A, Leenders KL, Spiegel R, Meier D, Vontobel P, Weigell-Weber M, Sanchez-Pernaute R, de Yébenez JG, Boesiger P, Weindl A, Maguire RP. Striatal glucose metabolism and dopamine D2 receptor binding in asymptomatic gene carriers and patients with Huntington's disease. Brain. 1996;119:2085–2095. doi: 10.1093/brain/119.6.2085. [DOI] [PubMed] [Google Scholar]
- Attwell D, Laughlin SB. An energy budget for signaling in the grey matter of the brain. J Cereb Blood Flow Metab. 2001;21:1133–1145. doi: 10.1097/00004647-200110000-00001. [DOI] [PubMed] [Google Scholar]
- Aylward EH, Anderson NB, Bylsma FW, Wagster MV, Barta PE, Sherr M, Feeney J, Davis A, Rosenblatt A, Pearlson GD, Ross CA. Frontal lobe volume in patients with Huntington's disease. Neurology. 1998;50:252–258. doi: 10.1212/wnl.50.1.252. [DOI] [PubMed] [Google Scholar]
- Bell RD, Winkler EA, Sagare AP, Singh I, LaRue B, Deane R, Zlokovic BV. Pericytes control key neurovascular functions and neuronal phenotype in the adult brain and during brain aging. Neuron. 2010;68:409–427. doi: 10.1016/j.neuron.2010.09.043. [DOI] [PMC free article] [PubMed] [Google Scholar]
- Bohanna I, Georgiou-Karistianis N, Hannan AJ, Egan GF. Magnetic resonance imaging as an approach towards identifying neuropathological biomarkers for Huntington's disease. Brain Res Rev. 2008;58:209–225. doi: 10.1016/j.brainresrev.2008.04.001. [DOI] [PubMed] [Google Scholar]
- Chaigneau E, Tiret P, Lecoq J, Ducros M, Knöpfel T, Charpak S. The relationship between blood flow and neuronal activity in the rodent olfactory bulb. J Neurosci. 2007;27:6452–6460. doi: 10.1523/JNEUROSCI.3141-06.2007. [DOI] [PMC free article] [PubMed] [Google Scholar]
- Costa DC, Pilowsky LS, Ell PJ. Nuclear medicine in neurology and psychiatry. Lancet. 1999;354:1107–1111. doi: 10.1016/s0140-6736(99)06095-x. [DOI] [PubMed] [Google Scholar]
- Cummings DM, André VM, Uzgil BO, Gee SM, Fisher YE, Cepeda C, Levine MS. Alterations in cortical excitation and inhibition in genetic mouse models of Huntington's disease. J Neurosci. 2009;29:10371–10386. doi: 10.1523/JNEUROSCI.1592-09.2009. [DOI] [PMC free article] [PubMed] [Google Scholar]
- Dixon RM, Bradley KM, Budge MM, Styles P, Smith AD. Longitudinal quantitative proton magnetic resonance spectroscopy of the hippocampus in Alzheimer's disease. Brain. 2002;125:2332–2341. doi: 10.1093/brain/awf226. [DOI] [PubMed] [Google Scholar]
- El Fakhri G, Kijewski MF, Johnson KA, Syrkin G, Killiany RJ, Becker JA, Zimmerman RE, Albert MS. MRI-guided SPECT perfusion measures and volumetric MRI in prodromal Alzheimer disease. Arch Neurol. 2003;60:1066–1072. doi: 10.1001/archneur.60.8.1066. [DOI] [PubMed] [Google Scholar]
- González RG, Fischman AJ, Guimaraes AR, Carr CA, Stern CE, Halpern EF, Growdon JH, Rosen BR. Functional MR in the evaluation of dementia: correlation of abnormal dynamic cerebral blood volume measurements with changes in cerebral metabolism on positron emission tomography with fludeoxyglucose F 18. AJNR Am J Neuroradiol. 1995;16:1763–1770. [PMC free article] [PubMed] [Google Scholar]
- Gusella JF, Wexler NS, Conneally PM, Naylor SL, Anderson MA, Tanzi RE, Watkins PC, Ottina K, Wallace MR, Sakaguchi AY. A polymorphic DNA marker genetically linked to Huntington's disease. Nature. 1983;306:234–238. doi: 10.1038/306234a0. [DOI] [PubMed] [Google Scholar]
- Huppert TJ, Jones PB, Devor A, Dunn AK, Teng IC, Dale AM, Boas DA. Sensitivity of neural-hemodynamic coupling to alterations in cerebral blood flow during hypercapnia. J Biomed Opt. 2009;14 doi: 10.1117/1.3210779. 044038. [DOI] [PMC free article] [PubMed] [Google Scholar]
- Karow DS, McEvoy LK, Fennema-Notestine C, Hagler DJ, Jr, Jennings RG, Brewer JB, Hoh CK, Dale AM. Relative capability of MR imaging and FDG PET to depict changes associated with prodromal and early Alzheimer disease. Radiology. 2010;256:932–942. doi: 10.1148/radiol.10091402. [DOI] [PMC free article] [PubMed] [Google Scholar]
- Kayser C, Kim M, Ugurbil K, Kim DS, König P. A comparison of hemodynamic and neural responses in cat visual cortex using complex stimuli. Cereb Cortex. 2004;14:881–891. doi: 10.1093/cercor/bhh047. [DOI] [PubMed] [Google Scholar]
- Kovács R, Rabanus A, Otáhal J, Patzak A, Kardos J, Albus K, Heinemann U, Kann O. Endogenous nitric oxide is a key promoting factor for initiation of seizure-like events in hippocampal and entorhinal cortex slices. J Neurosci. 2009;29:8565–8577. doi: 10.1523/JNEUROSCI.5698-08.2009. [DOI] [PMC free article] [PubMed] [Google Scholar]
- Lauritzen M. Reading vascular changes in brain imaging: is dendritic calcium the key? Nat Rev Neurosci. 2005;6:77–85. doi: 10.1038/nrn1589. [DOI] [PubMed] [Google Scholar]
- Lenz C, Rebel A, van Ackern K, Kuschinsky W, Waschke KF. Local cerebral blood flow, local cerebral glucose utilization, and flow-metabolism coupling during sevoflurane versus isoflurane anesthesia in rats. Anesthesiology. 1998;89:1480–1488. doi: 10.1097/00000542-199812000-00026. [DOI] [PubMed] [Google Scholar]
- Lerch JP, Carroll JB, Spring S, Bertram LN, Schwab C, Hayden MR, Henkelman RM. Automated deformation analysis in the YAC128 Huntington disease mouse model. Neuroimage. 2008;39:32–39. doi: 10.1016/j.neuroimage.2007.08.033. [DOI] [PubMed] [Google Scholar]
- Lerch JP, Sled JG, Henkelman RM. MRI phenotyping of genetically altered mice. Methods Mol Biol. 2011;711:349–361. doi: 10.1007/978-1-61737-992-5_17. [DOI] [PubMed] [Google Scholar]
- Li JY, Popovic N, Brundin P. The use of the R6 transgenic mouse models of Huntington's disease in attempts to develop novel therapeutic strategies. NeuroRx. 2005;2:447–464. doi: 10.1602/neurorx.2.3.447. [DOI] [PMC free article] [PubMed] [Google Scholar]
- Lin W, Celik A, Paczynski RP. Regional cerebral blood volume: a comparison of the dynamic imaging and the steady state methods. J Magn Reson Imaging. 1999;9:44–52. doi: 10.1002/(sici)1522-2586(199901)9:1<44::aid-jmri6>3.0.co;2-7. [DOI] [PubMed] [Google Scholar]
- Logothetis NK, Pfeuffer J. On the nature of the BOLD fMRI contrast mechanism. Magn Reson Imaging. 2004;22:1517–1531. doi: 10.1016/j.mri.2004.10.018. [DOI] [PubMed] [Google Scholar]
- Logothetis NK, Pauls J, Augath M, Trinath T, Oeltermann A. Neurophysiological investigation of the basis of the fMRI signal. Nature. 2001;412:150–157. doi: 10.1038/35084005. [DOI] [PubMed] [Google Scholar]
- McCasland JS, Hibbard LS. GABAergic neurons in barrel cortex show strong, whisker-dependent metabolic activation during normal behavior. J Neurosci. 1997;17:5509–5527. doi: 10.1523/JNEUROSCI.17-14-05509.1997. [DOI] [PMC free article] [PubMed] [Google Scholar]
- Menalled LB, Patry M, Ragland N, Lowden PA, Goodman J, Minnich J, Zahasky B, Park L, Leeds J, Howland D, Signer E, Tobin AJ, Brunner D. Comprehensive behavioral testing in the R6/2 mouse model of Huntington's disease shows no benefit from CoQ10 or minocycline. PLoS One. 2010;5:e9793. doi: 10.1371/journal.pone.0009793. [DOI] [PMC free article] [PubMed] [Google Scholar]
- Mochel F, Haller RG. Energy deficit in Huntington disease: why it matters. J Clin Invest. 2011;121:493–499. doi: 10.1172/JCI45691. [DOI] [PMC free article] [PubMed] [Google Scholar]
- Moreno H, Hua F, Brown T, Small S. Longitudinal mapping of mouse cerebral blood volume with MRI. NMR Biomed. 2006;19:535–543. doi: 10.1002/nbm.1022. [DOI] [PubMed] [Google Scholar]
- Moreno H, Wu WE, Lee T, Brickman A, Mayeux R, Brown TR, Small SA. Imaging the Abeta-related neurotoxicity of Alzheimer disease. Arch Neurol. 2007;64:1467–1477. doi: 10.1001/archneur.64.10.1467. [DOI] [PubMed] [Google Scholar]
- Moreno H, Burghardt NS, Vela-Duarte D, Masciotti J, Hua F, Fenton AA, Schwaller B, Small SA. The absence of the calcium-buffering protein calbindin is associated with faster age-related decline in hippocampal metabolism. Hippocampus. 2011 doi: 10.1002/hipo.20957. [DOI] [PMC free article] [PubMed] [Google Scholar]
- Mueggler T, Baumann D, Rausch M, Staufenbiel M, Rudin M. Age-dependent impairment of somatosensory response in the amyloid precursor protein 23 transgenic mouse model of Alzheimer's disease. J Neurosci. 2003;23:8231–8236. doi: 10.1523/JNEUROSCI.23-23-08231.2003. [DOI] [PMC free article] [PubMed] [Google Scholar]
- Musumeci SA, Bosco P, Calabrese G, Bakker C, De Sarro GB, Elia M, Ferri R, Oostra BA. Audiogenic seizures susceptibility in transgenic mice with fragile X syndrome. Epilepsia. 2000;41:19–23. doi: 10.1111/j.1528-1157.2000.tb01499.x. [DOI] [PubMed] [Google Scholar]
- Nehlig A, Wittendorp-Rechenmann E, Lam CD. Selective uptake of [14C]2-deoxyglucose by neurons and astrocytes: high-resolution microautoradiographic imaging by cellular 14C-trajectography combined with immunohistochemistry. J Cereb Blood Flow Metab. 2004;24:1004–1014. doi: 10.1097/01.WCB.0000128533.84196.D8. [DOI] [PubMed] [Google Scholar]
- Paxinos G, Franklin KBJ. The mouse brain in stereotaxic coordinates. Ed 2. San Diego: Academic; 2001. [Google Scholar]
- Piilgaard H, Lauritzen M. Persistent increase in oxygen consumption and impaired neurovascular coupling after spreading depression in rat neocortex. J Cereb Blood Flow Metab. 2009;29:1517–1527. doi: 10.1038/jcbfm.2009.73. [DOI] [PubMed] [Google Scholar]
- Powers WJ, Videen TO, Markham J, McGee-Minnich L, Antenor-Dorsey JV, Hershey T, Perlmutter JS. Selective defect of in vivo glycolysis in early Huntington's disease striatum. Proc Natl Acad Sci U S A. 2007;104:2945–2949. doi: 10.1073/pnas.0609833104. [DOI] [PMC free article] [PubMed] [Google Scholar]
- Racine RJ. Modification of seizure activity by electrical stimulation. II. Motor seizure. Electroencephalogr Clin Neurophysiol. 1972;32:281–294. doi: 10.1016/0013-4694(72)90177-0. [DOI] [PubMed] [Google Scholar]
- Rapoport SI. Functional brain imaging to identify affected subjects genetically at risk for Alzheimer's disease. Proc Natl Acad Sci U S A. 2000;97:5696–5698. doi: 10.1073/pnas.120178897. [DOI] [PMC free article] [PubMed] [Google Scholar]
- Reiman EM, Caselli RJ, Yun LS, Chen K, Bandy D, Minoshima S, Thibodeau SN, Osborne D. Preclinical evidence of Alzheimer's disease in persons homozygous for the epsilon 4 allele for apolipoprotein E. N Engl J Med. 1996;334:752–758. doi: 10.1056/NEJM199603213341202. [DOI] [PubMed] [Google Scholar]
- Rosas HD, Koroshetz WJ, Chen YI, Skeuse C, Vangel M, Cudkowicz ME, Caplan K, Marek K, Seidman LJ, Makris N, Jenkins BG, Goldstein JM. Evidence for more widespread cerebral pathology in early HD: an MRI-based morphometric analysis. Neurology. 2003;60:1615–1620. doi: 10.1212/01.wnl.0000065888.88988.6e. [DOI] [PubMed] [Google Scholar]
- Rostrup E, Knudsen GM, Law I, Holm S, Larsson HB, Paulson OB. The relationship between cerebral blood flow and volume in humans. Neuroimage. 2005;24:1–11. doi: 10.1016/j.neuroimage.2004.09.043. [DOI] [PubMed] [Google Scholar]
- Rothman DL, Behar KL, Hyder F, Shulman RG. In vivo NMR studies of the glutamate neurotransmitter flux and neuroenergetics: implications for brain function. Annu Rev Physiol. 2003;65:401–427. doi: 10.1146/annurev.physiol.65.092101.142131. [DOI] [PubMed] [Google Scholar]
- Sabuncu MR, Yeo BT, Van Leemput K, Vercauteren T, Golland P. Asymmetric image-template registration. Med Image Comput Comput Assist Interv. 2009;12:565–573. doi: 10.1007/978-3-642-04268-3_70. [DOI] [PMC free article] [PubMed] [Google Scholar]
- Sawiak SJ, Wood NI, Williams GB, Morton AJ, Carpenter TA. Use of magnetic resonance imaging for anatomical phenotyping of the R6/2 mouse model of Huntington's disease. Neurobiol Dis. 2009a;33:12–19. doi: 10.1016/j.nbd.2008.09.017. [DOI] [PubMed] [Google Scholar]
- Sawiak SJ, Wood NI, Williams GB, Morton AJ, Carpenter TA. Voxel-based morphometry in the R6/2 transgenic mouse reveals differences between genotypes not seen with manual 2D morphometry. Neurobiol Dis. 2009b;33:20–27. doi: 10.1016/j.nbd.2008.09.016. [DOI] [PubMed] [Google Scholar]
- Shin JY, Fang ZH, Yu ZX, Wang CE, Li SH, Li XJ. Expression of mutant huntingtin in glial cells contributes to neuronal excitotoxicity. J Cell Biol. 2005;171:1001–1012. doi: 10.1083/jcb.200508072. [DOI] [PMC free article] [PubMed] [Google Scholar]
- Simonsen CZ, Ostergaard L, Smith DF, Vestergaard-Poulsen P, Gyldensted C. Comparison of gradient- and spin-echo imaging: CBF, CBV, and MTT measurements by bolus tracking. J Magn Reson Imaging. 2000;12:411–416. doi: 10.1002/1522-2586(200009)12:3<411::aid-jmri6>3.0.co;2-5. [DOI] [PubMed] [Google Scholar]
- Small GW, Ercoli LM, Silverman DH, Huang SC, Komo S, Bookheimer SY, Lavretsky H, Miller K, Siddarth P, Rasgon NL, Mazziotta JC, Saxena S, Wu HM, Mega MS, Cummings JL, Saunders AM, Pericak-Vance MA, Roses AD, Barrio JR, Phelps ME. Cerebral metabolic and cognitive decline in persons at genetic risk for Alzheimer's disease. Proc Natl Acad Sci U S A. 2000a;97:6037–6042. doi: 10.1073/pnas.090106797. [DOI] [PMC free article] [PubMed] [Google Scholar]
- Small SA, Nava AS, Perera GM, Delapaz R, Stern Y. Evaluating the function of hippocampal subregions with high-resolution MRI in Alzheimer's disease and aging. Microsc Res Tech. 2000b;51:101–108. doi: 10.1002/1097-0029(20001001)51:1<101::AID-JEMT11>3.0.CO;2-H. [DOI] [PubMed] [Google Scholar]
- Sokoloff L, Reivich M, Kennedy C, Des Rosiers MH, Patlak CS, Pettigrew KD, Sakurada O, Shinohara M. The [14C]deoxyglucose method for the measurement of local cerebral glucose utilization: theory, procedure, and normal values in the conscious and anesthetized albino rat. J Neurochem. 1977;28:897–916. doi: 10.1111/j.1471-4159.1977.tb10649.x. [DOI] [PubMed] [Google Scholar]
- Tian P, Teng IC, May LD, Kurz R, Lu K, Scadeng M, Hillman EM, De Crespigny AJ, D'Arceuil HE, Mandeville JB, Marota JJ, Rosen BR, Liu TT, Boas DA, Buxton RB, Dale AM, Devor A. Cortical depth-specific microvascular dilation underlies laminar differences in blood oxygenation level-dependent functional MRI signal. Proc Natl Acad Sci U S A. 2010;107:15246–15251. doi: 10.1073/pnas.1006735107. [DOI] [PMC free article] [PubMed] [Google Scholar]
- Tkac I, Dubinsky JM, Keene CD, Gruetter R, Low WC. Neurochemical changes in Huntington R6/2 mouse striatum detected by in vivo 1H NMR spectroscopy. J Neurochem. 2007;100:1397–1406. doi: 10.1111/j.1471-4159.2006.04323.x. [DOI] [PMC free article] [PubMed] [Google Scholar]
- Torres-Reverón A, Melnick SM, Stephenson SI, Dow-Edwards DL. Standardization of a novel blood-sampling method through the jugular vein for use in the quantified [14C] 2-deoxyglucose method. J Neurosci Methods. 2006;150:143–149. doi: 10.1016/j.jneumeth.2005.05.018. [DOI] [PubMed] [Google Scholar]
- van Zijl PC, Eleff SM, Ulatowski JA, Oja JM, Uluğ AM, Traystman RJ, Kauppinen RA. Quantitative assessment of blood flow, blood volume and blood oxygenation effects in functional magnetic resonance imaging. Nat Med. 1998;4:159–167. doi: 10.1038/nm0298-159. [DOI] [PubMed] [Google Scholar]
- Vlachos F, Tung YS, Konofagou EE. Permeability assessment of the focused ultrasound-induced blood-brain barrier opening using dynamic contrast-enhanced MRI. Phys Med Biol. 2010;55:5451–5466. doi: 10.1088/0031-9155/55/18/012. [DOI] [PMC free article] [PubMed] [Google Scholar]
- Vonsattel JP, DiFiglia M. Huntington disease. J Neuropathol Exp Neurol. 1998;57:369–384. doi: 10.1097/00005072-199805000-00001. [DOI] [PubMed] [Google Scholar]
- Vonsattel JP, Myers RH, Stevens TJ, Ferrante RJ, Bird ED, Richardson EP., Jr Neuropathological classification of Huntington's disease. J Neuropathol Exp Neurol. 1985;44:559–577. doi: 10.1097/00005072-198511000-00003. [DOI] [PubMed] [Google Scholar]
- Weinstein BM. Vessels and nerves: marching to the same tune. Cell. 2005;120:299–302. doi: 10.1016/j.cell.2005.01.010. [DOI] [PubMed] [Google Scholar]
- Weisskoff RM, Zuo CS, Boxerman JL, Rosen BR. Microscopic susceptibility variation and transverse relaxation: theory and experiment. Magn Reson Med. 1994;31:601–610. doi: 10.1002/mrm.1910310605. [DOI] [PubMed] [Google Scholar]
- Wu EX, Wong KK, Andrassy M, Tang H. High-resolution in vivo CBV mapping with MRI in wild-type mice. Magn Reson Med. 2003;49:765–770. doi: 10.1002/mrm.10425. [DOI] [PubMed] [Google Scholar]
- Wu W, Small SA. Imaging the earliest stages of Alzheimer's disease. Curr Alzheimer Res. 2006;3:529–539. doi: 10.2174/156720506779025161. [DOI] [PubMed] [Google Scholar]
- Yan QJ, Asafo-Adjei PK, Arnold HM, Brown RE, Bauchwitz RP. A phenotypic and molecular characterization of the fmr1-tm1Cgr fragile X mouse. Genes Brain Behav. 2004;3:337–359. doi: 10.1111/j.1601-183X.2004.00087.x. [DOI] [PubMed] [Google Scholar]
- Yankeelov TE, Luci JJ, Lepage M, Li R, Debusk L, Lin PC, Price RR, Gore JC. Quantitative pharmacokinetic analysis of DCE-MRI data without an arterial input function: a reference region model. Magn Reson Imaging. 2005;23:519–529. doi: 10.1016/j.mri.2005.02.013. [DOI] [PubMed] [Google Scholar]
- Yushkevich PA, Piven J, Hazlett HC, Smith RG, Ho S, Gee JC, Gerig G. User-guided 3D active contour segmentation of anatomical structures: significantly improved efficiency and reliability. Neuroimage. 2006;31:1116–1128. doi: 10.1016/j.neuroimage.2006.01.015. [DOI] [PubMed] [Google Scholar]
- Zhang SF, Hennessey T, Yang L, Starkova NN, Beal MF, Starkov AA. Impaired brain creatine kinase activity in Huntington's disease. Neurodegener Dis. 2011;8:194–201. doi: 10.1159/000321681. [DOI] [PMC free article] [PubMed] [Google Scholar]
- Zimbelman JL, Paulsen JS, Mikos A, Reynolds NC, Hoffmann RG, Rao SM. fMRI detection of early neural dysfunction in preclinical Huntington's disease. J Int Neuropsychol Soc. 2007;13:758–769. doi: 10.1017/S1355617707071214. [DOI] [PubMed] [Google Scholar]