

Abstract
Background
The mutation rate of single nucleotide polymorphisms (SNPs) is estimated to be 100,000 times lower than that of short tandem repeats (STRs), which makes SNPs very suitable for relationship testing. The SNPforID multiplex assay was the first SNP typing assay that was a real alternative to the commonly used STR kits in kinship and crime case work and the first SNP assay to be validated in a forensic laboratory accredited according to the ISO17025 standard.
Methods
A total of 54 crime case samples were typed with the SNPforID multiplex assay. 30 samples from relationship cases were sequenced in selected SNP loci.
Results
It was demonstrated that mixtures were easily detected with the SNPforID assay by analyzing the signal strengths of the detected alleles. Unusual imbalances in signal strengths that were observed in a few individuals could be explained by unexpected SNPs in one of the primer binding sites. A complicated relationship case with four closely related individuals is presented.
Conclusion
Mixtures can be detected with bi-allelic SNPs. The SNPforID assay is a very useful supplement to the STR kits in relationship testing.
Keywords: SNP, SNPforID, Forensic genetics, Relationship testing, DNA mixtures
Abstract
Hintergrund
Die Mutationsrate von Single-Nucleotide-Polymorphismen (SNPs) ist 100 000 Mal niedriger als die Mutationsrate von Short-Tandem-Repeats (STRs). Die kleine Mutationsrate macht SNPs sehr nützlich für die Abstammungsbegutachtung. Der SNPforID-Multiplex war der erste SNP-Typisierungstest, der eine gute Ergänzung und vielleicht ein echte Alternative zu STR-Kits in der Abstammungsbegutachtung war, und der erste forensische SNP-Test, der nach dem ISO17025-Standard akkreditiert worden ist.
Methoden
Insgesamt 54 Proben von Kriminalfällen wurden mit dem SNPforID-Multiplex-Test untersucht. Weiterhin wurden 30 Proben von Abstammungsfällen in ausgewählten SNP-Loci sequenziert.
Ergebnisse
Es wurde gezeigt, dass DNA-Mischungen leicht mit dem SNPforID-Test durch die Analyse der Signalstärke der detektierten Allele erkannt werden konnten. Ungewöhnliche Ungleichgewichte in SNP-Signal-stärken in einigen Proben konnten durch zusätzliche/unerwartete SNPs in einer der Primer-Bindungsstellen erklärt werden. Ein komplizierter Abstammungsfall mit vier eng verwandten Individuen wird als Beispiel vorgestellt.
Schlussfolgerung
DNA-Mischungen können mit bi-alleli-schen SNPs erkannt werden. Der SNPforID-Test ist eine sehr nützliche/wertvolle Ergänzung zu STR-Kits in der Abstammungsbegutachtung.
Introduction
The number of single nucleotide polymorphisms (SNPs) in the human genome is estimated to be 10–11 million with an average of 1 SNP per 275 base pairs (bp). The vast majority of SNPs have only two alleles, and the average mutation rate at a particular base pair position is extremely low (approximately 10–7 to 10–9). For these reasons, SNPs have been used extensively to map the history of populations and for studying the association between SNP markers and traits and diseases. Within the forensic community, SNPs have attracted a lot of attention in the last decade, and this is likely to continue as forensic genetic research now includes markers that reveal information about ethnic origin, physical traits, molecular pathology, etc. For human identification and relationship testing, SNPs have already proved to be valuable markers and SNPs are used by some laboratories in routine case work investigations. SNPs are mainly used as supplementary markers, but there are situations where SNPs may be the best choice of markers. If the DNA is highly degraded, there is a much higher chance of obtaining results with SNP markers than with short tandem repeat (STR) markers, because SNPs may be amplified on very short amplicons (<100 bp) [1, 2, 3, 4, 5]. Furthermore, the commonly used STR kits amplify 15–17 STRs, and one mutation is expected to occur in one of the loci typed with these kits in approximately 3% of all meioses. If 1–2 genetic inconsistencies are detected between a child and the alleged parents in a relationship case, it can be difficult to draw a conclusion because the inconsistencies may be mutations or indicate that one of the alleged parents may not be the true biological parent [6.–10]. In contrast, mutations occur 100,000 times less frequently in SNPs than in STRs, and inconsistencies caused by mutations in SNP loci are extremely rare.
The SNPforLD consortium (www.snpforid.org) developed a SNP typing assay for human identification purposes that made it possible to amplify 52 SNPs from diminutive amounts of genomic DNA [1]. All SNP loci were amplified in one PCR reaction, and the SNPs were analyzed by two single base extension (SBE) reactions and capillary electrophoresis. The SBE products were injected into the same capillary with 5-min intervals and analyzed in one data file [1, 11].
The main criteria for selection of the SNP loci in the SNPforID multiplex were i) that the SNPs were highly polymorphic in most human populations (heterozygosity > 0.32), ii) that the SNPs were not in linkage disequilibrium, iii) that the SNPs were unlikely to be associated with cellular functions or with STR loci commonly used in forensic genetics investigations, and iv) that all SNPs could be amplified by PCR in one reaction [1].
The sensitivity and the overall robustness of the SNPforID multiplex assay were improved when the assay was validated for forensic genetic case work according to the ISO 17025 standard. In the validation process, the number of SNPs typed with the assay was reduced from 52 to 49 to allow optimization of the SBE primer design and simplification of the analysis of the electropherograms [11]. With the improved assay, full SNP profiles were obtained from only 100 pg of genomic DNA [12]. The lengths of the PCR amplicons in the SNPforID multiplex ranged from 65 to 115 bp. Full SNP profiles were generated from highly degraded DNA samples, where it was not possible to amplify any or just a few STR loci with the commercial STR kits [1, 3, 5]. Typing data from populations on all six continents confirmed that the SNPs are polymorphic in all populations, and there was no evidence of linkage disequilibrium between any of the selected SNPs. The mean match probability ranged from 10–14 to 10–21, and the paternity indices ranged from 105 to 106 for trios [1, 11, 13, 14, 15, 16, 17]. More than 75 population groups have been typed for these SNPs since the assay was developed, and the allele frequencies are freely available at the SNPforID homepage [18].
Here, we address the issues of mixture identification with bi-allelic SNP markers and identification of silent SNP alleles, and we present an illustrative case example of how useful the SNPforID multiplex may be in complicated relationship cases.
Material and Methods
Sample Materials and DNA Preparations
50 trace samples and 4 reference samples from crime cases were selected. The 50 trace samples consisted of 30 single source samples and 20 two-person mixtures. The four reference samples were from the same case (fig. 1). In addition, 30 samples from paternity and immigration case work were selected for sequencing of individual SNP loci.
Fig. 1.
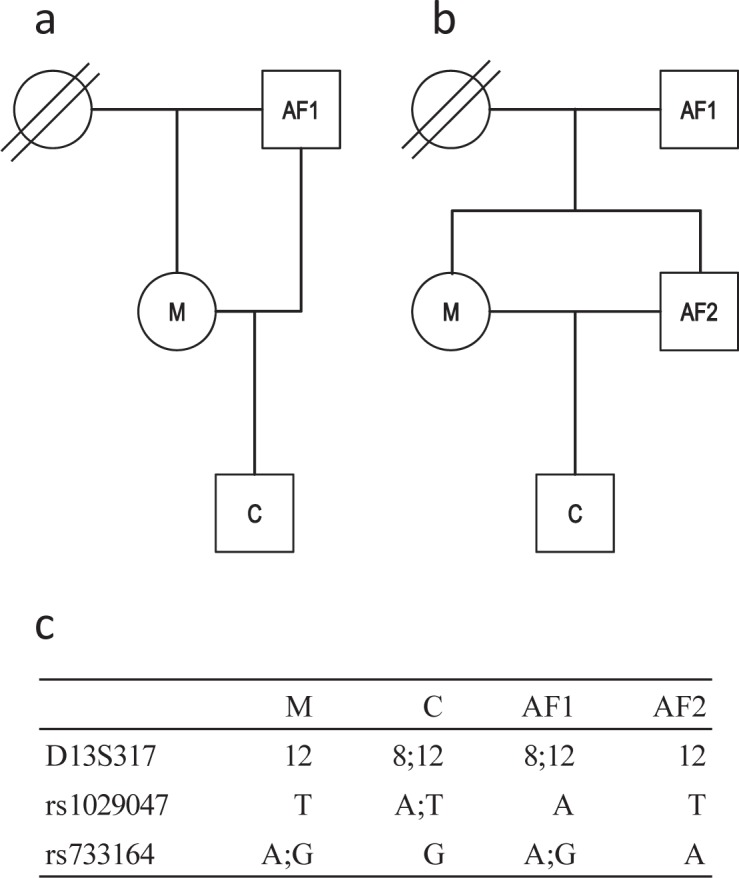
Case example. a Hypothesis H1: The father of the mother is the father of the child. b Hypothesis H2: The brother of the mother is the father of the child. c STR and SNP typing results at the three loci where mismatches were detected between C and AF2.
Reference samples and samples from paternity and immigration case work were collected as buccal swabs on FTA® cards (Whatman, Maidstone, UK) or as whole blood. PCR was performed on washed and dried 1.2 mm FTA card punches as previously described [11, 19]. DNA was isolated from whole blood using the EZ-1 DNA Investigator kit (Qiagen, Hilden, Germany) and an EZ1 Advanced XL (Qiagen) according to the manufacturer's instructions. DNA was isolated from the trace samples using Chelex-100 resin [19]. The work was approved by the Danish ethical committee (H-1–2011–081).
STR Analyses
The four reference samples in the case example were typed for 18 autosomal STRs (CSF1PO, D13S317, D16S539, D18S51, D19S433, D21S11, D2S1338, D3S1358, D5S818, D7S820, D8S1179, FGA, TH01, TPOX, vWA, F13A01, F13B, FESFPS) using the AmpFlSTR® Identifiler® PCR Amplification Kit (Applied Biosystems, Carlsbad, CA, USA) and the GenePrint® FFFL fluorescent STR kit (Promega, Madison, WI, USA).
For the AmpFlSTR Identifiler Kit, one 1.2 mm FTA card punch was mixed with 4 μl AmpFlSTR® PCR reaction mix (Applied Biosystems), 2 μl AmpFlSTR Identifiler primer set (Applied Biosystems), 0.2 μl AmpliTaq Gold® (Applied Biosystems), and 4 μl ddH2O. The following cycle program was used: denaturation and enzyme activation at 95 °C for 11 min, 24 cycles of 94 °C for 1 min, 59 °C for 1 min and 72 °C for 1 min, followed by 60 min at 60 °C. For the GenePrint FFFL kit, one 1.2 mm FTA card punch was mixed with 1 μl GoldST*R 10x buffer (Promega), 1 μl 10x primer mix (Promega), 0.08 μl AmpliTaq Gold (Applied Biosystems) and 8 μl ddH2O. The following cycle program was used: denaturation and enzyme activation at 95 °C for 11 min, 10 cycles of 94 °C for 1 min, 60 °C for 1 minand 70 °C for 1.5 min, followed by 14 cycles of 90 °C for 1 min, 60 °C for 1 min and 70 °C for 1.5 min, followed by 60 min at 60 °C. PCR reactions were performed in a GeneAmp® PCR system 9700 thermal cycler (Applied Biosystems). A total of 1.5 μl PCR product was mixed with 15 μl Hi-Di™ formamide (Applied Biosystems) and 0.3 μl GeneScan™ 500 HD Liz® size standard (Applied Biosystems) or 0.1 μl GeneScan™ 400 HD ROX™ size standard (Applied Biosystems), and analyzed on a 3130xl Genetic Analyzer (Applied Biosystems) with a 36 cm capillary array, POP-4™ polymer (Applied Biosystems) and 6 second injections at 3,000 V. Data were analyzed independently by two analysts using GeneScan® analysis software v. 3.7 and Genotyper® analysis software v. 3.7 (Applied Biosystems), and the results were compared. The minimum peak height was set to 50 relative fluorescence units (RFUs) for all dyes. All samples were analyzed at least twice, and the results from the two experiments were compared. If the results differed, the sample was analyzed a third time.
SNP Analyses
A total of 49 autosomal SNPs were amplified by PCR in 25 μl reactions containing one 1.2 mm FTA card punch or 1 μl DNA solution, 1x GeneAmp® PCR buffer I (Applied Biosystems), 8 mmol/l MgCl2 (Applied Biosystems), 700 μmol/l of each dNTP (GE Healthcare, Munich, Germany), 0.01–0.17 μμ of each primer (DNA Technology, Risskov, Denmark), and 2 U AmpliTaq Gold DNA polymerase (Applied Biosystems) [11]. The following cycle program was used: denaturation at 94 °C for 5 min followed by 35 cycles of 95 °C for 30 s, 60 °C for 30 s and 65 °C for 30 s followed by 7 min at 65 °C. PCRs were performed in a GeneAmp PCR system 9700 thermal cycler (Applied Biosystems). Excess of PCR primers and dNTPs were removed by addition of a freshly prepared mix of 0.75 μl (1 U/µl) shrimp alkaline phosphatase (Amersham Pharmacia Biotech, Piscataway, NJ, USA) and 0.023 μl (10 U/μl) Exonuclease I (Amersham Pharmacia Biotech) to 2.5 μl PCR product and incubation at 37 °C for 1 h followed by incubation at 75 °C for 15 min.
SBE reactions were performed in 8 μl reaction volumes containing 1 μl purified PCR product, 4 μl SNaPshot® reaction mix (Applied Biosystems), 1 μl SBE primer mix (DNA Technology) and 2 μl ddH2O. The SBE primer mix was diluted in 160 mmol/l ammonium sulphate (Sigma-Aldrich, St. Louis, MO, USA) to minimize primer-dimer artifacts. The SBE reaction was performed in GeneAmp PCR system 9700 thermal cyclers (Applied Biosystems) with 30 cycles of 96 °C for 10 s, 50 °C for 5 s, and 60 °C for 30 s. Excess nucleotides were removed by addition of 1 μl (1 U/μl) shrimp alkaline phosphatase to the SBE mix and incubation at 37 °C for 30 min followed by 75 °C for 15 min. 2 μl SBE products were mixed with 20 μl Hi-Di formamide (Applied Biosystems) and 0.1 μl GeneScan™ 120 Liz® size standard (Applied Biosystems). The SBE products were analyzed by capillary electrophoresis using 3130xl Genetic Analyzers (Applied Biosystems) with 36 cm capillary arrays and POP-4 polymer (Applied Biosystems) as previously described [1, 11]. Analysis was made using GeneScan Analysis 3.7 with peak thresholds set to 50 RFUs. Allele calls were made independently by two analysts using Genotyper 3.7 macros, where peaks detected in pre-defined allele windows with peak heights larger than 10% (blue color), 7% (green color) or 5% (yellow and red color) of the maximum peak height in the respective color were labeled with allele name, peak height, and size. Every phenotype call was evaluated based on the peak height(s) of the allele(s) according to pre-defined guidelines for allele calling [11]. The two independent analyses were compared. If the allele calls differed, the analyses of the electropherograms were repeated by both analysts. If the results differed after the second analysis, the results were failed, and the sample was investigated again. All samples were analyzed at least twice, and the results from the two experiments were compared. If the results differed, the sample was analyzed a third time.
DNA Sequencing
PCR primers were designed for 5 SNP loci (table 1) using Primer3 (http://frodo.wi.mit.edu/primer3/). One 1.2 mm FTA card punch or 1 μl DNA solution was mixed with 1x GeneAmp® PCR buffer I (Applied Biosystems), 2.5 or 3.5 mmol/l MgCl2 (Applied Biosystems), 400 μmol/l of each dNTP (GE Healthcare), 0.2 μmol/l of each primer (DNA Technology), and 2 U AmpliTaq Gold DNA polymerase (Applied Biosystems). The following cycle
Table 1.
Silent and partially silent alleles identified by sequencing
| Locus | Observation with SNP/orID assay† | Origin of samples | Primers for sequencing | Detected variation in SNP/orID primer |
|---|---|---|---|---|
| rs938283 | partially silent allele (T) | Somalia | forward-GGACTGAATCATGCCCTCTC | G→T in position −9 of the reverse |
| Congo | reverse-GAAGGCTTCTCTTTGGCTTG | PCR primer | ||
| rs2830795 | silent allele (A) | Congo | forward-ATAGGAAGGCTGCAGGTTGA | A→T in position −2 of the SBE primer |
| reverse-GGGGAGGTTGTCATCAGAGA | ||||
| rs1031825 | silent allele | Congo | forward-CCTGCATCTTCTTCCAGGAG | apparent deletion of locus‡ |
| reverse-TTAAGTGCCAAGCCCTATGC | ||||
| rs763869 | partially silent allele (C) | Denmark | forward-TAGGGACACAGCCAAACCAT | C→A in position −9 of the SBE primer |
| reverse-TTGAACAACACAACGACAAATG | ||||
| rs1029047 | partially silent allele (A) | Somalia | forward-GGAAATTTGTAGATCATTCTGGGTA | A→T in position −9 of the SBE primer |
| Congo | reverse-CACTGAAGTTTCAGGGCTCA |
The weakly amplified allele is shown in parents
No amplification was observed with either the SNP for ID or the newly designed PCR primer set
Calculation of Paternity Indices
Paternity indices (PIs) were calculated using DNAVIEW 28,103 and inhouse frequency databases for Danes. STR allele frequencies will be published elsewhere. SNP allele frequencies were previously published [1, 13]. Calculations were performed under the assumption that silent alleles exist. The frequency of silent alleles was set to (x + 1)/(n + 1), where × was the number of observed silent alleles and n was the total number of observed alleles. Six of the 49 SNPs are positioned on the same chromosome arm as another SNP in the multiplex [1, 11], and these SNP pairs will occasionally be inherited as haplotypes and not as independent loci. Only 43 SNPs, positioned at each end of the chromosomes, were used for calculation of PI. The mutation rate of STRs and SNPs were set to 0.003–0.004 and 0.000001, respectively.
Results
Mixture Determination
Lack of efficiency in identification of mixtures or contaminated samples has been mentioned as an important disadvantage of bi-allelic markers in forensic genetic investigations [20, 21, 22]. A sample typed with one of the standard STR kits with 10–17 STRs may easily be identified as a mixture, if more than two alleles are detected in several loci. This simple form of interpretation cannot be used for bi-allelic markers such as SNPs or insertion/deletion (indel) polymorphisms. Instead, it is necessary to analyze the relative signal strength(s) of the alleles in detail.
We developed a quality gauge on each phenotype call when the SNPforID assay was validated for relationship testing [11]. The quality gauge was based on the peak height(s) of the detected allele(s); e.g., for the locus rs1024116, the peak height ratio for heterozygous allele calls should be 1.1–2.8 (G/A), and the signal-to-noise ratio should be at least 10 and 5 for the G and A homozygous allele call, respectively. The purpose of the quality gauge was two-fold; firstly, to ensure a clear and quantitative distinction between heterozygous and homozygous allele calls, and secondly, to identify unusual phenotype calls by a simple and fast method that allows the person doing the analysis to focus on these individual results. An added bonus to the detailed analysis of every phenotype call was the important information about the sample that may be deduced by looking at the number of loci failing to fulfill the quality gauge. Many homozygous allele calls with low signal-to-noise ratios indicates that the sample was weakly amplified, which increase the risk of allele dropouts, whereas many heterozygous allele calls with unusual peak height ratios are clear indications of a mixture.
50 crime case samples were typed with the SNP for ID assay. 30 samples were single-source samples, and 20 samples were judged to be two-person mixtures based on previous STR analyses. All heterozygous allele calls from the 50 samples were collected, and the peak height ratios for each locus were normalized to one by dividing by the average peak height ratio of that locus [11]. As shown in figure 2, the normalized peak height ratios from the single-source samples were approximately one, as expected. In contrast, there was a large variation in the normalized peak height ratios from two-person mixtures (fig. 2b). Almost half of the peak height ratios did not fulfill the quality gauges, and for 163 of the 631 heterozygous allele calls the peak height ratios were two times higher or lower than the acceptable range. With single-source samples, we have never observed more than one locus where the peak height ratio was two times higher or lower than the acceptable range, and in each case the ratio could be explained by a mutation in one of the primer binding sites (table 1) [11, 13].
Fig. 2.

Normalized peak height ratios from a 30 single source samples b and 20 two-person mixtures typed with the SNP for ID multiplex assay. program was used: denaturation at 95 °C for 5 min followed by 30 cycles of 95 °C for 15 s, 60 °C or 58 °C for 15 s and 72 °C for 30 s followed by 5 min at 72 °C. PCR products were sequenced using the BigDye Terminator Kit (Applied Biosystems) as recommended by the manufacturer. The results were analyzed on a 3130xl Genetic Analyzer (Applied Biosystems) with a 36 cm capillary array and POP-4 polymer (Applied Biosystems).
It is sometimes possible to deduce the STR types of the contributors in simple mixtures. The resolution of mixed STR profiles has been described in detail previously [23, 24]. It involves an estimation of the number of individuals in the mixture, an estimation of the mixture proportion, and an analysis of all possible genotype combinations based on the signal strengths of the detected alleles. This type of analysis is not possible for mixed SNP (or indel) profiles. The mixture proportion or the number of contributors cannot be estimated from the SNP results alone. Even if that type of information was available from e.g. STR analyses, only the genotype of the major contributor may be deduced. Consider a 1:10 two-person mixture where both alleles are detected. If the peak height ratio is acceptable according to the quality gauge, it is likely that the major contributor is heterozygous at that locus. However, it is impossible to deduce the phenotype of the minor contributor. The minor contributor may be heterozygous or homozygous for either allele. If the peak height ratio in a 1:10 mixture is unacceptable, the major contributor is likely to be homozygous for the allele with the strongest signal. The minor contributor is likely to carry the allele with the weakest signal, but it is not possible to deduce whether the minor contributor is homozygous or heterozygous at that locus. If the two individuals contributed more or less equally to the mixture, neither of the profiles can be deduced. Consider a locus, where the detected peak height ratio is 3 and the expected ratio is 1. They may be achieved in two ways: i) a 3:1 mixture of two individuals that are homozygous for the two different alleles, or ii) a 2:1 mixture of a homozygous and heterozygous individual. If one of the contributors in the mixtures is known and the mixture proportion can be estimated accurately, it may be possible to deduce the bi-allelic genotypes. However, that will introduce bias into the analysis and therefore is not recommendable [24].
For complex mixtures with three or more individuals, the mixed SNP profile will be essentially useless. Both alleles are likely to be detected at a large number of loci, and any individual in the population will match the sample at these loci. Furthermore, deducing the individual SNP types, even for the major contributor, will be extremely difficult.
Silent and Partially Silent Alleles
Unusual peak height ratios were observed for some SNP loci during the validation of the SNPforID multiplex [11, 13] and during routine case work investigations. If the ratios were reproducible, and sometimes inheritable, the samples were selected for sequencing in order to determine the reasons for the unusual ratios. New PCR primer sets for five loci were designed (table 1), and the PCRs were optimized. The resulting fragments included the entire fragment amplified with the SNPforID multiplex and allowed sequencing of both the PCR and SBE primer sequences used in the SNPforID assay. Four SNPs in primer binding sites and one apparent deletion were identified in the 5 loci (table 1). Three of the SNPs were recently characterized by the 1,000 Genomes Project (www.genome.gov), whereas the SNP near the rs763869 locus was unknown. The deletion in the rs1031825 locus was detected in two related individuals (father and child). The individuals were apparently homozygous for the deletion since no signals from the SBE reaction and no amplification products were detected in either individual. The SNPs near the rs1029047 and the rs938283 loci were observed in 10 and 5 unrelated individuals of African descent, respectively. The other polymorphisms were only observed in one or two families.
Case Example
A complicated relationship case with four closely related individuals was investigated. There was strong suspicion of incest between the mother (M) of an unborn boy (C) and either her father (AF1) or her full sibling (AF2). The question raised was, whether the father or the brother of the mother was the father of the child (fig. 1). After the initial investigation of 18 autosomal STRs, neither AF1 nor AF2, could be excluded as the father, and both men were included according to the Danish rules of reporting a PI > 104 (table 2). One genetic inconsistency between the child and AF2 or between the child and the mother was observed in D13S317 (fig. 1c). If a mutation had occurred, it would have been a 4-step mutation, which is a rare mutation event [25, 26]. Nevertheless, the results in D13S317 accounts for almost all of the difference in PI between AF1 and AF2, and it was not possible to deduce whether AF1 or AF2 was the father. Supplementary investigations of 49 SNPs using the SNP for ID multiplex were performed, and two additional mismatches were observed (fig. 1c). At the rs1029047 locus, there was a genetic inconsistency between the child and AF2 or between the child and the mother, and at the rs733164 locus, C and AF2 were homozygous for different alleles. The SNP results clearly indicated that AF2 was not the father, and the PI for AF2 was less than 1. Based on the combined STR and SNP results, it was reported that AF1 was more than 1 million times as likely to be the father as AF2.
Table 2.
Likelihood ratios
| 18 STRs | 43 SNPs | Combined | |
|---|---|---|---|
| PI (AF1) | 5.4 × 10⁸ | 1.3 × 10⁸ | 7.0 × 10¹⁶ |
| PI (AF2) | 1.9 × 10⁵ | 4.6 × 10⁻² | 8.9 × 10³ |
| LR = P(E|H1)/P(E|H2)† | 2.9 × 10³ | 2.8 × 10⁹ | 7.8 × 10¹² |
H1: AF1 is the father. H2: AF2 is the father.
AF1 was presumed to be the father of M and AF2 (PI was 4 × 10¹⁴ and 6 × 10¹⁶, respectively) in all calculations; however, there was a mismatch between AF1 and both M and AF2 at the rs1029047 locus (fig. 1c). Sequencing confirmed that AF1 was homozygous A at the rs1029047 locus, but heterozygous A/T at a position 9 bp upstream of rs1029047 (data not shown). This SNP (rs79672047) was reported to the NCBI dbSNP database in March 2011 by the 1,000 Genomes Project, and it was identified by sequencing in 10 unrelated individuals and 5 of their family members (table 1). Presumably, the rs79672047 T allele resulted in weak binding of the rs1029047 SBE primer to the PCR products. A very faint A signal was sometimes detected with the SNPforID multiplex in some individuals, but often the signal was lost completely. Sequencing revealed that M and AF2 were heterozygous at both the rs1029047 and the rs79672047 locus, and, apparently, AF1 passed on the rs79672047 T/rs1029047 A haplotype, which results in a silent rs1029047 A allele with the SNP for ID multiplex assay, to M and AF2, whereas AF1 passed on the normal rs79672047 A/rs1029047 A haplotype to the child C.
Discussion
The SNPforID multiplex assay was validated for relationship case work in our laboratory in 2007, where it replaced typing of variable number of tandem repeats (VNTRs) [11, 13]. Today, the assay is used in all cases that are not trios (woman-child-man) and in all cases where 1–2 mismatches were detected between the child and one of the alleged parents. Approximately 80 cases with SNP typing results are reported each year. Half are paternity cases, and the other half are immigration cases. The case example shown above is a good example of how useful the SNP for ID assay is in complicated relationship cases, and we recently published other case examples from our own laboratory [27, 28] and case examples from other laboratories that were reinvestigated with the SNPforID assay [29]. The assay itself has worked robustly after the improvements made during the validation [11], and the typing success rate for any SNP in any experiment since the assay was introduced in routine case work was 98%. Full SNP profiles were obtained in 78% of all experiments, which is 10–15% lower than the number of full STR profiles obtained with the AmpFlSTR Identifiler (unpublished data) and the Amp FlS TR Identifiler direct kits [30]. With a few exceptions (table 1), full SNP profiles from duplicate typings were reported for all individuals.
The introduction of the quality gauge on each phenotype call [11] greatly simplified the analyses of the electropherograms and standardized the process. Analysis is no longer an expert evaluation of the typing results. Instead, it can be documented how analysis should proceed and what guidelines apply to each phenotype call. Interlaboratory exercises within the SNPforID consortium [2] and the European DNA Profiling Group [31] revealed that most errors occurred in the analysis of the electropherograms. Clearly, it was inconvenient for the analyst that the alleles from the same locus appeared in separate windows and that the signal strengths of the two al eles were not balanced, which increased the risk of false interpretation of the results. The quality gauges overcome most of these problems. Unfortunately, there is no analysis software available, where the quality gauges may be defined. Instead, a text file must be exported from the analysis software, and the typing results must be analyzed in a simple spreadsheet. This is inconvenient and somewhat time-consuming. If the quality gauges could be defined in the analysis software, analysis would be simple and swift.
Identification of mixtures or contaminated samples is essential to all forensic genetic investigations. Clearly, it is easier to identify mixtures with highly polymorphic markers, such as STRs, than with bi-allelic markers. However, the results in figure 2 demonstrate that mixtures can be identified easily also with SNP markers. Two unrelated individuals from the Danish allele frequency database with 371 individuals have an average of 20–21 identical phenotypes (range 6–37). Thus, it is expected that mixed SNP profiles cannot fulfill the pre-defined quality gauges in many loci, which is confirmed by the results in figure 2. The experiment in figure 2 is used as a training set for new analysts in our laboratory. So far, the trained analysts have been able to identify all mixtures. Furthermore, we have been able to identify all mixtures in controlled two-person mixture experiments with mixture ratios from 1:1 up to 1:40 if there were at least 50–100 pg of the minor contributor in the mixture (data not shown) [11].
Today, the SNPforID multiplex is a routine investigation in our laboratory. It provides us with an assay that can solve most relationship cases with high statistical weight and with a very low risk of detecting a mutation. Furthermore, it makes it possible to type highly degraded sample materials. In combination, the SNPforID multiplex provides us with an assay that is very well suited for disaster victim identifications, where the samples from the victims may be highly degraded and the victims need to be identified via their relatives.
Disclosure Statement
The authors did not provide a conflict of interest statement.
Acknowledgements
We thank Nadia Jochumsen, Trine Hansen, Maibritt Sigvardt and Anja Jørgensen for technical assistance.
References
- 1.Sanchez JJ, Phillips C, Børsting C, Balogh K, Bogus M, Fondevilla M, Harrison CD, Musgrave-Brown E, Salas A, Syndercombe-Court D, Schneider PM, Carracedo A, Morling N. A multiplex assay with 52 single nucleotide polymorphisms for human identification. Electrophoresis. 2006;27:1713–1724. doi: 10.1002/elps.200500671. [DOI] [PubMed] [Google Scholar]
- 2.Musgrave-Brown E, Ballard D, Balogh K, Bender K, Berger B, Bogus M, Børsting C, Brion M, Fondevila M, Harrison C, Oguzturun C, Parson W, Phillips C, Proff C, Ramos-Luis E, Sanchez JJ, Diz PS, Rey B, Stradmann-Bellinghausen B, Thacker C, Carracedo A, Morling N, Scheithauer R, Schneider PM, Court DS. Forensic validation of the SNPforID 52-plex assay. Forensic Sci Int Genet. 2007;1:186–190. doi: 10.1016/j.fsigen.2007.01.004. [DOI] [PubMed] [Google Scholar]
- 3.Phillips C, Fondevila M, García-Magarinos M, Rodriguez A, Salas A, Carrecedo A, Lareu MV. Resolving relationship tests that show ambiguous STR results using autosomal SNPs as supplementary markers. Forensic Sci Int Genet. 2008;2:198–204. doi: 10.1016/j.fsigen.2008.02.002. [DOI] [PubMed] [Google Scholar]
- 4.Lou C, Cong B, Li S, Fu L, Zhang X, Feng T, Su S, Ma C, Yu F, Ye J, Pei L. A SNaPshot assay for genotyping 44 individual identification single nucleotides polymorphisms. Electrophoresis. 2011;32:368–378. doi: 10.1002/elps.201000426. [DOI] [PubMed] [Google Scholar]
- 5.Tomas C, Axler-DiPerte G, Budimlija ZM, Børsting C, Coble MD, Decker AE, Eisenberg A, Fang R, Fondevila M, Fredslund SF, Gonzalez S, Hansen AJ, Hoff-Olsen P, Haas C, Kohler P, Kriegel AK, Lindblom B, Manohar F, Maroñas O, Mogensen HS, Neureuther K, Nilsson H, Scheible MK, Schneider PM, Sonntag ML, Stangegaard M, Syndercombe-Court D, Thacker CR, Vallone PM, Westen AA, Morling N. Autosomal SNP typing of forensic samples with the GenPlex(tm) HID System: Results of a collaborative study. Forensic Sci Int Genet. 2011;5:369–375. doi: 10.1016/j.fsigen.2010.06.007. [DOI] [PubMed] [Google Scholar]
- 6.Wenk RE, Gjertson DW, Chiafari FA, Houtz T. The specific power of parentage exclusion in a child's blood relatives. Transfusion. 2005;45:440–444. doi: 10.1111/j.1537-2995.2005.04271.x. [DOI] [PubMed] [Google Scholar]
- 7.Poetsch M, Lüdcke C, Repenning A, Fisher L, Mályusz V, Simeoni E, Lignitz E, Oehmichen M, von Wurmb-Schwark N. The problem of single parent/ child paternity analysis – practical results involving 336 children and 348 unrelated men. Forensic Sci Int. 2006;159:98–103. doi: 10.1016/j.forsciint.2005.07.001. [DOI] [PubMed] [Google Scholar]
- 8.Von Wurmb-Schwark N, Mályusz V, Simeoni E, Lignitz E, Poetsch M. Possible pitfalls in motherless paternity analysis with related putative fathers. Forensic Sci Int. 2006;159:92–97. doi: 10.1016/j.forsciint.2005.07.015. [DOI] [PubMed] [Google Scholar]
- 9.Karlsson AO, Holmlund G, Egeland T, Mostad P. DNA-testing for immigration cases: the risk of erroneous conclusions. Forensic Sci Int. 2007;172:144–149. doi: 10.1016/j.forsciint.2006.12.015. [DOI] [PubMed] [Google Scholar]
- 10.Nothnagel M, Schmidtke J, Krawczak M. Potentials and limits of pairwise kinship analysis using autosomal short tandem repeat loci. Int J Legal Med. 2010;124:205–215. doi: 10.1007/s00414-009-0413-0. [DOI] [PubMed] [Google Scholar]
- 11.Børsting C, Rockenbauer E, Morling N. Validation of a single nucleotide polymorphism (SNP) typing assay with 49 SNPs for forensic genetic testing in a laboratory accredited according to the ISO 17025 standard. Forensic Sci Int Genet. 2009;4:34–42. doi: 10.1016/j.fsigen.2009.04.004. [DOI] [PubMed] [Google Scholar]
- 12.Rockenbauer E, Børsting C, Stangegaard M, Frank-Hansen R, Morling N. Successful STR and SNP typing of FTA-card samples with low amounts of DNA after DNA extraction using a Qiagen BioRobot(r) EZ1. Forensic Sci Int Genet Suppl. 2009;2:83–84. [Google Scholar]
- 13.Børsting C, Sanchez JJ, Hansen HE, Hansen AJ, Bruun HQ, Morling N. Performance of the SNPforID 52 SNP-plex assay in paternity testing. Forensic Sci Int Genet. 2008;2:292–300. doi: 10.1016/j.fsigen.2008.03.007. [DOI] [PubMed] [Google Scholar]
- 14.Porras L, Phillips C, Fondevilla M, Beltran L, Ortiz T, Rondon F, Barreto G, Larau MV, Henao J, Carrecedo A. Genetic variability of the SNPforID 52-plex identification SNP panel in Central West Columbia. Forensic Sci Int Genet. 2009;4:e9–e10. doi: 10.1016/j.fsigen.2008.12.003. [DOI] [PubMed] [Google Scholar]
- 15.Drobnic K, Børsting C, Rockenbauer E, Tomas C, Morling N. Typing of 49 autosomal SNPs by SNaPshot(r) in the Slovenian population. Forensic Sci Int Genet. 2010;4:e125–e127. doi: 10.1016/j.fsigen.2010.01.014. [DOI] [PubMed] [Google Scholar]
- 16.Santos C, Phillips C, Fondevilla M, Porras-Hurtado L, Carrecedo A, Souto L, Lareu MV. A study of East Timor variability using the SNPforID 52-plex SNP panel. Forensic Sci Int Genet. 2011;5:e25–e26. doi: 10.1016/j.fsigen.2010.03.006. [DOI] [PubMed] [Google Scholar]
- 17.Poulsen L, Børsting C, Tomas C. Typing of Amerindian Kichwas and Mestizos from Ecuador with the SNPforID multiplex. Forensic Sci Int Genet. 2011;5:e105–e107. doi: 10.1016/j.fsigen.2011.03.006. [DOI] [PubMed] [Google Scholar]
- 18.Amigo J, Phillips C, Lareu MV, Carrecedo A. The SNPforID browser: an online tool for query and display of frequency data from the SNPforID project. Int J Legal Med. 2008;122:435–440. doi: 10.1007/s00414-008-0233-7. [DOI] [PubMed] [Google Scholar]
- 19.Børsting C, Sanchez JJ, Morling N. Forensic genetic DNA typing with PCR-based methods. PCR. In: Hughes S, Moody A, editors. Method Express Series. Bloxham: Scion Publishing; 2007. pp. 123–142. [Google Scholar]
- 20.Gill P, Werrett DJ, Budowle B, Guerrieri R. An assessment of whether SNPs will replace STRs in national DNA databases – joint considerations of the DNA working group of the European Network of Forensic Science Institutes (ENFSI) and the Scientific Working Group on DNA Analysis Methods (SWGDAM) Sci Justice. 2004;44:51–53. doi: 10.1016/s1355-0306(04)71685-8. [DOI] [PubMed] [Google Scholar]
- 21.Butler JM, Coble MD, Vallone PM. STRs vs. SNPs: thoughts on the future of forensic DNA testing. Forensic Sci Med Pathol. 2007;3:200–205. doi: 10.1007/s12024-007-0018-1. [DOI] [PubMed] [Google Scholar]
- 22.Budowle B, van Daal A. Forensically relevant SNP classes. Biotechniques. 2008;44:603–610. doi: 10.2144/000112806. [DOI] [PubMed] [Google Scholar]
- 23.Clayton TM, Whitaker JP, Sparkes R, Gill P. Analysis and interpretation of mixed forensic stains using DNA STR profiling. Forensic Sci Int. 1998;91:55–70. doi: 10.1016/s0379-0738(97)00175-8. [DOI] [PubMed] [Google Scholar]
- 24.Gill P, Brenner CH, Buckleton JS, Carrecedo A, Krawczak M, Mayr WR, Morling N, Prinz M, Schneider PM, Weir BS. DNA commission of the International Society of Forensic Genetics: recommendations on the interpretation of mixtures. Forensic Sci Int. 2006;160:90–101. doi: 10.1016/j.forsciint.2006.04.009. [DOI] [PubMed] [Google Scholar]
- 25.Goedbloed M, Vermeulen M, Fang RN, Lembring M, Wollstein A, Ballantyne K, Lao O, Brauer S, Krüger C, Roewer L, Lessig R, Ploski R, Dobosz T, Henke L, Henke J, Furtado MR, Kayser M. Comprehensive mutation analysis of 17 Y-chromosomal short tandem repeat polymorphisms included in the AmpFlSTR Yfiler PCR amplification kit. Int J Legal Med. 2009;123:471–482. doi: 10.1007/s00414-009-0342-y. [DOI] [PMC free article] [PubMed] [Google Scholar]
- 26.Ballantyne KN, Goedbloed M, Fang R, Schaap O, Lao O, Wollstein A, Choi Y, van Duijn K, Vermeulen M, Brauer S, Decorte R, Poetsch M, von Wurmb-Schwark N, de Knijff P, Labuda D, Vézina H, Knoblauch H, Lessig R, Roewer L, Ploski R, Dobosz T, Henke L, Henke J, Furtado MR, Kayser M. Mutability of Y-chromosomal microsatellites: rates, characteristics, molecular bases, and forensic implications. Am J Hum Genet. 2010;87:341–353. doi: 10.1016/j.ajhg.2010.08.006. [DOI] [PMC free article] [PubMed] [Google Scholar]
- 27.Tomas C, Sanchez JJ, Castro JA, Børsting C, Morling N. Forensic usefulness of a 25 X-chromosome SNP marker set. Transfusion. 2010;50:2258–2265. doi: 10.1111/j.1537-2995.2010.02696.x. [DOI] [PubMed] [Google Scholar]
- 28.Børsting C, Morling N. Mutations and/or relatives? Six case work examples where 49 autosomal SNPs were used as supplementary markers. Forensic Sci Int Genet. 2011;5:236–241. doi: 10.1016/j.fsigen.2010.02.007. [DOI] [PubMed] [Google Scholar]
- 29.Børsting C, Morling N. Re-investigations of six unusual paternity cases by typing of autosomal single nucleotide polymorphisms. Transfusion. 2012;52:425–430. doi: 10.1111/j.1537-2995.2011.03260.x. [DOI] [PubMed] [Google Scholar]
- 30.Stene M, Buchard A, Børsting C, Morling N. Validation of the AmpFlSTR(r) Identifiler(r) Direct PCR amplification kit in a laboratory accreditated according to the ISO17025 standard. Forensic Sci Int Genet Suppl. 2011;3:e165–e166. [Google Scholar]
- 31.Sanchez JJ, Børsting C, Balogh K, Berger B, Bogus M, Butler JM, Carrecedo A, Court DS, Dixon LA, Eichmann C, Fondevila M, Gill P, Harrison CD, Hohoff C, Huel R, Ludes B, Parson W, Parsons TJ, Petkovski E, Phillips C, Schmitter H, Schneider PM, Vallone PM Morling N. Forensic typing of autosomal SNPs with a 29 SNP-multiplex – results of a collaborative EDNAP exercise. Forensic Sci Int Genet. 2008;2:176–183. doi: 10.1016/j.fsigen.2007.12.002. [DOI] [PubMed] [Google Scholar]