

Abstract
This study investigated the construct validity of measures of teacher-student support in a sample of 709 ethnically diverse second and third grade academically at-risk students. Confirmatory factor analysis investigated the convergent and discriminant validities of teacher, child, and peer reports of teacher-student support and child conduct problems. Results supported the convergent and discriminant validity of scores on the measures. Peer reports accounted for the largest proportion of trait variance and non-significant method variance. Child reports accounted for the smallest proportion of trait variance and the largest method variance. A model with two latent factors provided a better fit to the data than a model with one factor, providing further evidence of the discriminant validity of measures of teacher-student support. Implications for research, policy, and practice are discussed.
Keywords: teacher-student relationship, multi-trait multi-method, measurement, elementary students, convergent validity, discriminant validity
Extensive research documents links between the quality of students’ relationships with their teachers and children’s concurrent and future academic and social outcomes (for reviews see Hamre & Pianta, 2006). Children who experience supportive, positive relationships with their teachers have more positive attitudes toward school (Murray, Murray, & Waas, 2008); are more academically engaged and achieve more (Hughes, Luo, Kwok, & Loyd, 2008; Ladd, Birch, & Buhs, 1999); and are less likely to engage in substance abuse, early sex, and other risky behaviors (Resnick et al., 1997). Conversely, students whose relationships with teachers are characterized by low support and high conflict are at risk for grade retention (Pianta, Steinberg, & Rollins, 1995), peer rejection (Ladd et al., 1999), and externalizing behaviors (Hughes, Cavell, & Jackson, 1999; Meehan, Hughes, & Cavell, 2003; Silver, Measelle, Armstrong, & Essex, 2005). The benefits of a positive student-teacher relationship have been found with students ranging in age from preschool and kindergarten (Howes, Hamilton, & Matheson, 1994; Ladd et al., 1999) through adolescence (Resnick et al., 1997).
Importantly, the association between teacher-student relationship quality and subsequent adjustment holds when previous levels of student adjustment are statistically controlled (e.g., Hamre & Pianta, 2001; Hughes et al., 1999; Hughes et al., 2008; Ladd et al., 1999; Meehan et al., 2003). Cross-lag, longitudinal studies demonstrate that teacher student relationship quality and student adjustment most likely affect each other in a reciprocal manner (Doumen et al., 2008; Hughes et al., 2008).
Researchers have drawn from diverse theoretical perspectives in explaining an effect of teacher-student relationship quality on student adjustment. Attachment theorists posit that a secure relationship with one’s teacher may serve as a regulatory resource that permits young students to actively explore their environment and to cope more effectively with novel academic and social demands (Little & Kobak, 2003; Pianta & Stuhlman, 2004). According to social support and social-motivational theories (Deci & Ryan, 1985; Furrer & Skinner, 2003), students who perceive their teachers as meeting their basic psychological needs for competence, autonomy, and social relatedness are most likely to identify with school and invest in the school’s agenda (Skinner & Belmont, 1993).
Despite differences in the theoretical underpinnings of different measures of teacher report measures of teacher-student relationship quality (TSRQ), these measures consistently identify a positive dimension (i.e., close, warm, supportive) and a conflict dimension (Hughes, Gleason, & Zhang, 2005; Murray et al., 2008; Pianta, 1992), with some measures identifying a third dimension of dependency (Pianta, 1992) or intimacy (Hughes et al., 2005). Scores on the positive and conflict scales are moderately correlated with each other, and both conflict and support scores are predictive of changes in student academic and social adjustment (Hamre & Pianta, 2001; Liew, Chen, & Hughes, 2010; Meehan et al., 2003; Hughes et al., 2008).
Cross-informant agreement in reports of teacher-student relationship quality
The majority of published studies on TSRQ in grades 3 and younger have relied exclusively on teacher report of relationship quality. A reliance on teacher reports of TSRQ in studies of elementary students might be explained by researchers’ concern that students below grade 4 are not capable of providing reliable and valid information on relationship quality. Child report measures of TSRQ also yield separate support and conflict dimensions (Murray et al., 2008; Hughes, in press), and scores evince good internal consistency for children as young as preschool (Mantzicopoulos & Neuharth-Pritchett, 2003; Murray et al., 2008). However, the relatively few studies utilizing both teacher and child reports of TSRQ among students in grades K-2 show low correspondence between the two informants (Henriccson & Rydell, 2004; Hughes et al., 1999; Mantzicopoulos & Neuharth-Pritchett, 2003; Murray et al., 2008). For example, in a sample of 157 kindergarten children, child reports of four dimensions of teacher support and total support were not significantly correlated with teacher reports of these same dimensions (Murrary et al., 2008). With children in grades 3-6, correlations between student and teacher reports of teacher support range from .16 to .25 (Gest, Welsh, & Domitrovich, 2005; Hughes, Cavell, & Jackson, 1999; Rey et al., 2007).
The few studies that have examined correspondence between teacher reports of TSRQ and observer ratings (Doumen et al., 2009) or peer ratings (Hughes & Kwok, 2007) of teacher support provide evidence of cross-informant agreement. To the best of the authors’ knowledge, no published study has examined correspondence between child reports of TSRQ and reports of observer or peers.
The findings of low to moderate cross-informant agreement in ratings of the teacher-student relationship parallel those of studies on cross-informant agreement in ratings of student adjustment. For example, in a national sample of youth ages 9-15 years old, the average correlation between teachers and students across five behavioral scales and the total problems score on the Strengths and Difficulties Questionnaire (Goodman, 1997) was .23 (Goodman, 2001). Similar levels of agreement between teachers and students were obtained in other studies (Achenbach, McConaughy, & Howell, 1987;Achenbach & Rescorla, 2001). Few studies have examined teacher-peer agreement in ratings of student adjustment. In a study with academically at-risk first graders, agreement between teachers’ scores on the Strengths and Difficulties Questionnaire and peer ratings of the same constructs was .38 (Hughes & Kwok, 2007). Generally, agreement between raters is higher for ratings of externalizing behaviors than for ratings of internalizing behaviors.
Source effects in ratings of TSRQ and adjustment
Studies utilizing both teacher and child reports find stronger within-rater than across-rater correlations between measures of the teacher-student relationship and measures of child adjustment (Decker, Dona, & Christenson, 2007; Murray et al., 2008). For example, among students in grades 3-6, child reports of teacher support predicted child-reported psychosocial adjustment but did not predict teacher-reported measures of adjustment, whereas teacher report of teacher support had stronger associations with teacher-reported measures of adjustment than with child-report measures of adjustment(Rey et al., 2007). These findings suggest that at least some of the association between measures of the relationship and measures of student adjustment may be due to source variance.
Inside and outside perspectives on teacher-student relationship
Whereas child aggression or child social competence may be regarded as characteristics of a child, the teacher-student relationship is regarded as a dyadic construct (Pianta & Stuhlman, 2004). Teacher and student reports of the relationship offer perspectives from inside the relationship and reflect the participants’ generalized expectations for relationships, the interactional history of the relationship, and the actual, current provision of support and conflict. Thus, perceptions of the teacher-student relationship as supportive or close likely reflect not only enacted support and conflict within the relationship but also the participants’ mental representations of the relationship. According to this view, “perceptions of support tap both relationship-specific appraisals and relatively stable perceptions that others care for and value us” (Brock, Sarason, Sanghvi, & Gurung, 1998, p. 6).
Including a perspective from outside the relationship may shed light on the meaning of teacher and child perspectives of the relationship. In the current study peers provide an outside perspective. Our decision to use classmates as the third source on teacher-student support and child conflict is based on the reasoning that classmates have opportunities to witness the teacher’s interactions with each student in the class for several hours a day over an extended period of time. By third grade, peers are reliable reporters of both student characteristics (Realmuto, August, Sieler, & Pessoa-Brandao, 1997) and teacher differential behaviors toward students (Weinstein, Marshall, Sharp, & Botkin, 1987). Because peer sociometric ratings are based on perceptions of multiple raters, they may be less susceptible to rater-specific biases, thus evincing higher trait variance than teacher or child reports (Terry, 2000). Furthermore, as outsiders to the relationship, peers’ ratings of classmates’ relationships with the teacher may have less personal relevance for the peer rater than is the case for reports of those from “inside” the relationship, which could also contribute to greater trait variance.
It is important to note that a student’s perception of the teacher as accepting, trustworthy, and available, whether congruent with other sources of information on the relationship or not, might affect a child’s engagement in learning and academic self-concept. According to social motivational theory (Deci & Ryan, 1985; 1991; Furrer & Skinner, 2003), elementary students who report positive relationships with their teachers and peers report greater attachment to, liking for, and involvement in school as well as improved academic self concept, relative to students who report less positive relationships (Flook, Repetti, & Ullman, 2005; Gest et al., 2005; Murray et al., 2008; Guay, Boivin, & Hodges, 1999; Rey et al., 2007). In turn, these positive self views and engaged patterns of learning promote academic achievement (Chen, Hughes, Kwok, & Liew, 2010; Hughes et al., 2008; Ladd et al., 1999; Skinner & Belmont, 1993). Thus, low cross-informant agreement does not necessarily mean that student reports have little educational or clinical significance.
Purpose of study
The primary purpose of this study was to estimate the convergent and discriminant validity of teacher, student, and peer reports of teacher-student support, using multi-trait multi-method (MTMM) logic (Campbell & Fiske, 1959). Evidence of convergent validity is estimated by the degree to which different sources agree in their reports of teacher student support. Evidence of discriminant validity is estimated by the degree to which teacher, child, and peer reports of teacher student support are distinct from their ratings of a related but conceptually distinct construct. MTMM-based models require at least two traits to be assessed by multiple methods or sources. In the current study, child conduct problem was selected as the second trait. Child conduct problem was selected instead of teacher-student conflict for two reasons. First, peer ratings of teacher-student conflict were not available, due to ethical concerns expressed by both researchers and school personnel about asking students to nominate classmates with respect to negativity in the teacher-student relationship. Second, both teacher and peer reports of teacher-student conflict are strongly correlated with measures of child externalizing behaviors. Among teacher reports, correlations between teacher-student conflict and student conduct problems above .70 are common (Palermo, Hanish, Martin, Fabes, & Reiser, 2007; Silver et al., 2005). Peer perceptions of teacher-student relationship conflict and child conduct problems also evince limited distinctiveness (Doumen et al., 2008; Hughes, Cavell, & Willson, 2001).
In addition to analyzing the MTMM matrix (Campbell & Fiske, 1959) to investigate convergent and discriminant validity, confirmatory factor analysis estimated the degree to which teacher, student, and peer reports may be indicators of a common construct or trait (i.e., trait variance) versus measures of unique rater tendencies or characteristics (i.e., source variance). Consistent with previous research on agreement among informants on measures of behavior adjustment (Renk & Phares, 2004; Hill & Hughes, 2007; Goodman, 2001), we expected peer ratings would account for the most trait variance and that student ratings would account for the least trait variance. We also tested evidence of discriminant validity by testing whether a model in which support and conduct problems are distinct factors is a better fit to the data than a model in which support and conduct problems load on a common factor. Finally, we tested whether gender or race and ethnicity moderated the structural paths in the CFA.
A secondary purpose was to investigate the association between teacher, peer, and student ratings of support and five indices of child academic adjustment: scores on a standardized measure of reading and math achievement, teacher-rated behavior engagement, and child perceived reading and math competence. We expected to replicate earlier research findings of higher within source than between source correlations for teacher and child ratings (Decker et al., 2007; Murray et al., 2008; Rey et al., 2007)
We pursued these aims with a sample of first grade children whose scores on a test of literacy skills at entrance to first grade were below the median score for their school district (see below for details on participants). Because children who enter school with low academic readiness skills may be more likely than higher achieving students to encounter academic and social stressors at school, the availability of social support from teachers may be especially important to their academic motivation and achievement (Baker, 2006; Burchinal, Peisner-Feinberg, Pianta, & Howes., 2002; Hamre & Pianta, 2001).
Method
Participants
Participants were 709 (53.3% male) children attending one of three Texas school districts (1 urban and 2 small city). Participants were drawn from a larger sample of children participating in a longitudinal study examining the impact of grade retention on academic achievement. The larger sample was recruited across two sequential cohorts in 1st grade during Fall, 2001 and Fall, 2002 (Year 1). The data for the present study were collected 2 years later (Year 3) when 75% of participants were in third grade and 25% were in second grade. Children were eligible to participate in the larger longitudinal study if they scored below the median score for their district on a state approved district-administered measure of literacy when they were in first grade. School records identified 1,374 children as eligible to participate. Of these 1,374 children, written parental consent was obtained for 784 (57%). Children with and without consent to participate did not differ on age, gender, ethnicity, eligibility for free or reduced-price lunch, or the district-administered literacy test.
Of these 784 participants, 709 were still active in Year 3 (i.e., had not withdrawn from the study or moved to an unknown location or a school more than 200 miles from the school from which they were recruited) and had at least some data on analysis variables. No evidence of selective attrition was found for demographic or baseline measures of study variables. Of these 709 study participants, 470 had complete data and 239 were missing data on at least one study variable. After applying the Bonferroni correction for multiple tests to reduce the chance of Type I error, those with and without complete data did not differ on the eleven study variables which include teacher-rated support, teacher-rated conduct problem, teacher-rated engagement, peer-rated support, peer-rated conduct problem, child-rated support, child-rated conduct problem, child-rated self efficacies on reading and math, and academic achievements on reading and math. The overall rate of missingness for all the eleven analysis variables was 11.8%. Missingness for the eleven analysis variables were 6% (child reports), 23% (teacher reports), and 13% (peer reports)
Participants were Asian/Pacific Islander (N = 24), African American (N = 163), Hispanic (N = 270), Caucasian (N = 241), or other (N = 11). Children who spoke any Spanish were classified by the school as Limited English Proficient, or who were enrolled in bilingual education classrooms were tested for language proficiency with the Woodcock-Munoz Language Survey (Woodcock-Munoz-Sandoval, 1993). Children were subsequently tested in the language in which they demonstrated greater proficiency. In this study, 627 participants were tested in English and 82 were tested in Spanish. The 709 participants were nested within 317 classrooms. Based on the relatively small percentage of missing data and the equivalence of participants with complete data (N = 480) and incomplete data (N = 229) on all the demographic variables and study variables, the assumption that data were missing at random was deemed reasonable. Therefore, to maintain a constant sample size across analyses and to increase power, missing data were imputed using an Estimation Maximization (EM) algorithm estimation method within the NORM Version 2.03 software program (Schafer, 2000). Since parametric imputation usually uses 2 to 10 imputations (Rubin, 1987, p.15), ten different data sets were generated from the imputation in the present study.
Design Overview
Data were collected from teachers (questionnaires), classmates (sociometric interviews) and children (interviews and standardized achievement testing) during Year 3 (between Fall, 2003 and Fall, 2004 for cohorts 1 and 2, respectively). Teachers were mailed a questionnaire packet for each study participant in the Spring of the year. This packet included the measures of the teacher’s perception of the teacher-student relationship, the child’s academic achievement, child conduct, and the child’s behavior engagement in the classroom. Teachers received compensation for completing and returning the questionnaires. Research staff individually administered tests of reading and math achievement and interviewed students between November and May. Classmates’ perceptions of the teacher-student support as well as their perceptions of child conduct problems were obtained via individual interviews conducted at school between February and May.
Child Report Measures
Child ratings of teacher-student support
The Network of Relationships Inventory (NRI; Furman & Buhrmester, 1985) is a child-report measure of relationship quality informed by Robert Weiss’s (1974) theory of the provision of social support. Differences in provisions of support across different types of relationships (e.g., teacher, peers, parents) and developmental shifts in whom children rely on for support are consistent with developmental theory (Furman & Buhrmester, 1985; 1992). Sixteen 5-point, Likert-type items assess the level of six forms of social support (affection, admiration, intimacy, satisfaction, nurturance, and reliable alliance), and six 5-point items assess conflict in the teacher-student relationship. An exploratory factor analysis on the randomly selected half (392) of third-grade participants from the two cohorts of the larger study suggested three factors: Warmth (10 items, alpha = .87), Intimacy (6 items, alpha =.80), and Conflict (6 items, alpha = .79). Results of confirmatory factor analysis on the other half (392) of participants from the larger study found that the three-factor model provided an adequate fit for the data, χ2 (202) = 306.5, p < .01, comparative fit index (CFI) = .949, root-mean-square error of approximation (RMSEA) = .040. The 10-item child warmth scale (α = .87 for sample) was used as the measure of support because it best captures the provision of social support (e.g., warm and affectively positive interactions) and is more consistently related to other indices of child adjustment (Hughes & Villarreall, 2008). Example Warmth items include “How much does your teacher like or love you?” and “How much does your teacher treat you like you’re admired and respected”? In a sample of elementary students, the Child NRI warmth and conflict scales predicted children’s behavioral and academic performance, above prior levels of each (Hughes, in press).
Child-rated conduct problems
Children were individually administered the Perceived Competence Scale for Children (Harter, 1985). The scale includes 36 items, with 6 items measuring each of six constructs: scholastic competence, social acceptance, athletic competence, physical appearance, behavioral conduct, and global self-worth. Scores on the scale have demonstrated good factor structure, internal consistency, test-retest stability, and criterion-related validity (Muris, Meesters, & Figen, 2003). Only the 6-item behavioral conduct scale was used in this study (α = .70). Although this scale correlated in expected ways with other indices of adjustment, it has a significant link with social desirability (Muris et al., 2003), a type of response bias that contributes to source variance. The examiner presents each child with a pair of statements and asks the child to identify which statement is more like the child. In each pair, one statement depicts a child who is better behaved, and the other statement is of a less well-behaved child. Once a child chose a statement, he or she was asked to indicate the extent to which the statement is like him or her. Each statement has a 1-4 scored value, with a higher score indicative of more conduct problems. Example items are: “Some kids usually get in trouble because of things they do BUT other kids usually don’t do things that get them in trouble” and “ Some kids behave themselves very well BUT other kids often find it hard to behave themselves.”
Child-rated academic competency beliefs
Children’s perceived reading and math competencies were assessed with the Competence Beliefs and Subjective Task Values Questionnaire (Wigfield et al., 1997). The math and reading scale consist of 5 items each (alpha for sample .82 and .83 for reading and math, respectively). Among 3rd graders, children’s reports of competence have shown low to moderate correlations with teachers’ ratings of competence (r = .23 and .27 for reading and math, respectively) and were moderately stable across 1 year. Children were asked to respond by pointing on a thermometer numbered 0 to 30. The end point and midpoint of each scale were also labeled with a verbal descriptor of the meaning of that scale point (e.g., the number 1 would be labeled with the words “not good at all,” or “one of the worst”, the number 15 would be labeled with the word “ok”, and the number 30 would be labeled with the words “very good” or “one of the best”).
Teacher Report Measures
Teacher Network of Relationships Inventory (TNRI)
The TNRI was developed from the child version of the NRI. Specifically, items were rephrased so that teachers report their provision of support to the student and conflict in the relationship with the child. Some items were reworded so that the focus of the item was on the child rather than on the teacher’s behavior, in order to reduce the threat of the question and minimize teachers’ tendency to respond in a socially desirable manner (Caplan, 1970). For example, an item on the child version asks “How much does your teacher treat you like you’re admired and respected?’ The comparable item on the teacher version is “This child gives me many opportunities to praise him/her.” Similarly, the item on the child version that reads “How much does your teacher really care about you?” was reworded as “I look forward to spending time with this child.” Other items were changed minimally (e.g., from “How satisfied are you with your relationship with your teacher?” to “I am satisfied with my relationship with this child” and “How sure are you that your relationship with your teacher will last in spite of fights” to “It is easy to mend the relationship with this child after a disagreement or conflict.” Earlier exploratory and confirmatory factor analysis (Hughes et al., 2005) with the larger longitudinal sample identified three factors: Warmth (13 items; alpha = .96), Intimacy (3 items, alpha = .86) and Conflict (6 items, alpha = .91). For consistency with the child report measure, only the 13 item Warmth Scale is used in the current study. Scores on the TNRI support scale have demonstrated good predictive and concurrent validity, with support being positively associated with changes in peer acceptance, behavioral engagement, and reading and math achievement and negatively associated with aggression (Liew et al., 2010; Meehan, et al., 2003; Hughes & Kwok, 2006; Hughes et al., 2007; Hughes, in press).
Teacher-rated conduct problems
Teachers completed the Strengths and Difficulties Questionnaire (SDQ; Goodman, 1997), a brief screening measure for psychopathology. Each item is rated on a 0-2 scale (i.e., not true, somewhat true, certainly true). The SDQ yields five scales comprised of 5 items each. Only the Conduct Problems scale was used in the current study (α = .82 for sample). Example items include “Generally well behaved, usually does what adults request” and “Often fights with other children or bullies them.” Scores on the scale have demonstrated good internal consistency, inter-coder agreement, and convergent and discriminant validity. In a study of first grade students, scores from the teacher version of the Conduct Problems correlated .47 with parent scores on a parallel form and .50 with peer nominations of aggression (Hill & Hughes, 2007).
Teacher-rated behavior engagement
This 10-item scale (α = .95 for sample) asks teachers to rate students’ efforts, attention, persistence, and cooperative participation in learning on a 5 point Likert-type scale. Example items are “Perseveres until the task if finished”, and “Sets and works toward goals.” Scores on this measure have demonstrated good evidence of construct validity (Chen et al., 2010; Hughes et al., 2008).
Peer report measures
Peer nominations for teacher-student support and child conduct problems
Peer perceptions of the teacher-student support and of children’s level of conduct problems were assessed using well-established peer nomination procedures (Masten, Morison, & Pellegrini, 1985; Realmuto et al., 1997). Consent for participation in the peer nominations was requested from parents of all children in classrooms in which a child participating in the longitudinal study was enrolled. An average of 13 students (SD = 3.08) provided nominations in each classroom. The mean classroom percentage of students participating in the sociometric administrations was .70 (SD = .14; range = 40% to 100%).
Children were presented with several descriptors and asked to name as few or as many classmates who are like the description. The teacher support item states: “These children get along well with their teachers. They like to talk to their teachers, and their teachers enjoy spending time with them.” Two items assess conduct problems. The aggression item states: “These children start fights, say mean things, or hit others.” The trouble item states “Some kids get into trouble a lot.” In each case the child is asked “What kids in your class are like this?” A child’s score for each item was obtained by summing all nominations received for that item. Although only children with written parent consent to participate in the sociometric assessment provided ratings and nominations, all children in the class were eligible to be nominated. Scores were standardized within classrooms. A composite conduct problem score was calculated as the mean of the aggression and trouble items (r = .77).
Academic Achievement
The WJ-III Tests of Achievement (Woodcock, McGrew, & Mather, 2001) is an individually administered measure of academic achievement. The WJ-III Broad Reading W Scores (letter-word identification, reading fluency, passage comprehension subtests) and the WJ-III Broad Math W Scores (calculations, math fluency, and math calculation skills subtests) were used. W scores are based on the Rasch measurement model. Researchers have demonstrated the reliability and construct validity of scores on the WJ-III and its predecessor (Woodcock & Johnson, 1989; Woodcock et al., 2001). Children more proficient in Spanish than English were administered the comparable Spanish test of achievement, the Batería –III (Woodcock, Munoz-Sandoval, McGrew, Mather, & Schrank, 2004).
Overview of Data Analytic Approach
In the present study, we measured two dimensions with three sources for a total of six measured variables. First, the MTMM matrix was produced and analyzed. The MTMM provides an intuitive method of disentangling trait effects from potential method effects, of which reporting source is a component, by examining the convergence of ratings of the same trait by different informants (monotrait-heteromethod) and the divergence of ratings of different traits by the same informant (heterotrait-monomethod). The MTMM matrix, although intuitively appealing, has been widely criticized and largely replaced by confirmatory factor analytic methods that provide statistical estimates of trait and source variance (Kenny & Kashy, 1992). Thus we also employed confirmatory factor analysis to estimate source and trait effects of teacher, child, and peer reports of teacher-student support and child conduct problems. The so called “complete” CFA model, the Correlated Trait Correlated Method model (CTCM) model, most closely models MTMM theory (Cole, 1987). However, persistent estimation problems with this model make it an impractical approach for most uses (Eid, Lischetzke, Nussbeck, & Trierweiler, 2003; Lance, Noble, & Scullen, 2002). Indeed, the CTCM model failed to converge in our sample for any of the 10 imputed datasets. Consequently we used the Correlated Uniqueness (CU) Model, which is known to result in higher convergence rates and more stable parameter estimates (Corten, Saris, Coenders, Veld, Aalberts, & Kornelis, 2002; Kenny & Kashy, 1992). The hypothesized CU model is presented in Figure 1. In the CU model, method variance is represented as error, and errors for items sharing the same method are correlated. Therefore, the correlated error terms provide an index of method effects. A finding of larger unique covariances among the error terms is interpreted as greater method effects.
Figure 1. The CU model.

Note. ‘conductP’ indicates conduct problem; ‘T’ indicates teacher rating; ‘P’ indicates peer rating; ‘C’ indicates child rating. Factor correlation and pattern coefficients are completely standardized, but residual covariances are unstandardized.
To provide statistical evidence of divergent validity of the two traits in the current study, we compared our hypothesized CU model with a model that was identical except that all 6 indicators measured one general trait instead of the original two traits (named single-trait model in the following section). Since the CU model and the single-trait model were not nested models, we used the AIC and BIC statistics to compare them.
The 709 students were nested within 317 classrooms. To take into account the dependency among the observations (students) within clusters (classrooms), the 10 sets of imputed data were pulled and analyzed with a CU model using the Type = Imputation under DATA command and Type=Complex feature under ANALYSIS command in Mplus Version 5.1 (Muthen & Muthen, 2007); this Type=Complex feature accounted for the nested structure of the data by adjusting the standard errors of the estimated coefficients.
Results
Descriptive and Correlational Statistics
All study variables were examined for issues of outliers and normality properties. No outliers were identified and values for skewness (range from −.79 to 1.60) and kurtosis (range from −1.99 to 1.86) for all variables were within acceptable ranges as suggested by West and colleagues (West, Finch, & Curran, 1995). We also examined the multivariate normality of our data via Amos (Version 18) with the kurtosis equal to 6.70. Additionally, the estimation method we used for the analysis (Type=Complex in Mplus) is a robust estimation method which is robust for the violation of the normality assumption. Thus, it is unlikely the departure from multivariate normality in our data would lead to biased results given the above information.
Table 1 reports correlations between measures of teacher support completed by teachers, students, and peers and the five indices of academic adjustment. As expected, teacher and peer reports of support correlated significantly with teacher-reported behavioral engagement but not with child-reported variables. Also as expected, child report of support correlated with child perceived academic competency in reading and math. Notably, child reported support also correlated significantly with teacher-rated engagement. No source of report of teacher-student support correlated significantly with academic achievement.
Table 1.
Correlations between Measures of Support and the Five Indices of Academic Adjustment
| T- Support | P- Support | C- Support | Mean | SD | |
|---|---|---|---|---|---|
| Math | .10 | .04 | −.05 | 486.68 | 11.15 |
| Reading | .10 | .06 | −.02 | 477.43 | 19.51 |
| Math SE | −.05 | −.05 | .16 | 22.54 | 6.31 |
| Reading SE | −.03 | .06 | .18 | 22.18 | 6.27 |
| T-Engagement | .66 | .36 | .13 | 2.82 | .68 |
| M | 3.97 | −.19 | 3.60 | ||
| SD | .88 | .84 | .86 |
Note. Above are the average results from the 10 imputed data sets with N=709. SE = Self Efficacy; T = Teacher Rating; P = Peer Rating; C = Child Rating; Bold indicates p < .01.
Table 2 reports descriptive statistics (i.e., means and standard deviations) and inter-correlational statistics for the six MTMM variables as well as gender and ethnicity. Statistically significant correlations between gender and the six variables measured on the two dimensions indicated that females were rated to have more support and less conduct problems than males by all the three informants. Caucasian and Hispanic children were rated lower on conduct problems than African American children by teachers and peers. Results in Table 2 indicated that teacher-student support is significantly and negatively correlated with conduct problem within and across the three informants.
Table 2.
Descriptive and Correlational Statistics for Study Variables
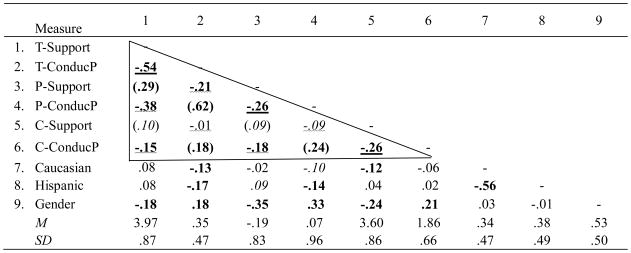 |
Note. Above are the average results from the 10 imputed data sets with N=709. Gender is a dummy variable with female coded as 0 and male coded as 1. Caucasian and Hispanic are the dummy coded variables for Ethnicity with African American children as the reference group. Correlations in parentheses indicate convergent validity coefficients (monotrait-heteromethod); underlined correlations indicate discriminant validity coefficients (heterotrait-monomethod); and wavy underlined correlations indicate common method effects (heterotrait-heteromethod). The correlations in the triangle is called MTMM matrix. T = Teacher Rating; P = Peer Rating; C = Child Rating; ConducP = Conduct Problem. Bold indicates p < .01; italics indicate p < .05; regular font indicates p > .05.
The MTMM matrix can be easily seen within the triangle in Table 2. Monotrait–heteromethod (same trait, different informants) correlations were in the low to moderate range (mean r = .25), with the highest convergence occurring between teachers’ and peers’ report on Conduct Problem (r = .62) and the lowest convergence between children and peers’ ratings on Support (r =.09). The heterotrait–monomethod (different traits, same informant) correlations varied from −.21 to −.54 (mean r = −.34). The heterotrait–heteromethod (different traits, different informants) correlations (mean r = −.17) were lower than the correlations of both the monotrait–heteromethod and the heterotrait–monomethod. The findings of low to moderate monotrait–heteromethod supported the convergent validity; and the findings of low to moderate heterotrait–monomethod suggested the discriminant validity, of child, teacher, and peer reports of teacher-student support.
CU model results
The CU model is presented in figure 1. This CU model provided an adequate fit to the pulled MTMM data, χ2 (5) = 13.13, p = .022, CFI = .988, RMSEA = .047, SRMR = .023, AIC = 8941.541, BIC = 9041.946. The effect size for this chi-square test from the null hypothesis was 0.27. These statistics indicated a sufficient model fit to the MTMM data.
As Kenny and Kashy (1992) suggested, the convergent validity can be examined by checking the pattern coefficients while the discriminant validity can be examined by checking the covariances between the traits. The estimated parameters using the CU model (Figure 1) with a MTMM approach are reported in Table 3, as well as the intraclass correlation coefficients (ICCs) of the 6 measured variables. In Table a, structural coefficients are reported right after estimated pattern coefficients. All pattern coefficients were statistically significant, ranging from .163 to .927. The magnitude of pattern coefficients across the two traits was relatively more consistent for teacher and child reports than peer reports. Peer ratings had the largest overall mean pattern coefficient (mean λ = .714) and a range from .500 for Support to .927 for Conduct Problems. Child ratings had the smallest overall mean pattern coefficient (mean λ = .216), with a range from .163 for Support to .268 for Conduct Problem. Teacher ratings had a mean pattern coefficient of .639 with a range from .617 to .662.
Table 3.
Estimated Parameters for the MTMM Data: Correlated Uniqueness Model
| Variable | ICC | Pattern and Structural Coefficients | Variance and Covariances of Errors | ||||||||||
|---|---|---|---|---|---|---|---|---|---|---|---|---|---|
| 7 (PC) | 7(SC) | 8 (PC) | 8(SC) | 1 | 2 | 3 | 4 | 5 | 6 | ||||
| 1. T-support | .271 | .617** | 0.587 | 0 | −.401 | .465** | |||||||
| 2. T-conducp | .071 | 0 | −.451 | .662** | .659 | −.113** | .124** | ||||||
| 3. P-support | .014 | .500** | .510 | 0 | −.349 | 0 | 0 | .523** | |||||
| 4. P-conducp | .006 | 0 | −.628 | .927** | .919 | 0 | 0 | .039 | .127 | ||||
| 5. C-support | .033 | .163** | .156 | 0 | −.107 | 0 | 0 | 0 | 0 | .722** | |||
| 6. C-conducp | .031 | 0 | −.181 | .268** | .265 | 0 | 0 | 0 | 0 | −.128** | .406** | ||
| Factor Correlation
|
|||||||||||||
| 7.Support | -- | ||||||||||||
| 8.Conduct Problem | −.665** | -- | |||||||||||
Note. N=709. Values of 0 and 1.00 were fixed a priori. Pattern coefficients were completely standardized, but variance and Covariances of errors were unstandardized. T = Teacher Rating; P = Peer Rating; C = Child Rating; conducp = Conduct Problem; PC = Pattern Coefficient; SC = Structural Coefficient.
p < .01, two-tailed.
Parameters obtained from the CU model provided some evidence for the convergent validity of the two constructs: the indicators were all statistically significantly loaded on the two traits of Support and Conduct Problem. The covariance between the two traits was −.665, which did not offer strong evidence of discriminant validity. A strong assumption of the CU model is that the relations between methods are fixed to be zero (orthogonal). This limitation might lead to increased factor covariance and therefore downwardly biased discriminant validity (Kenny and Kashy, 1992). This downward bias of discriminant validity is obvious given the correlations in the MTMM matrix: the highest correlation between the two constructs was −.38 among different informants and −.54 within the same informant, both statistics of which are smaller than the covariance between the two traits.
As a further test of the distinctiveness of the two constructs, we compared our original CU model with a single trait model. The model fit results for the single trait model (χ2 (6) =50.852, CFI = .931, RMSEA = .102, SRMR = .037, AIC = 8975.234, BIC =9071.075, effect size from the null hypothesis of χ2 test = 0.56) indicated that the data in our study were better described by a multidimensional construct than a single trait, even though the multiple dimensions were moderately correlated with each other. This model comparison offered additional evidence of discriminant validity of the two traits in our study.
The covariance of the correlated errors for variables measured with the same method represented the method effect. In the bracket of the right portion of Table 3, error variances are reported on the diagonals and covariances are reported below the error variances. As shown in Table 3, the error covariances indicated that both teacher ratings and child ratings had statistically significant method effects while there was no evidence of method effect to peer ratings.
According to Conway’s (1998) approach, the mean trait variance for each informant can be calculated by averaging squared pattern coefficients on the informant; and the method variance for each informant is the error covariance for items sharing the same informant. Table 4 contains the mean trait variance and method variance for each informant.
Table 4.
Mean Proportions of Trait Variance and Method Variance Estimated with the CU Model
| Mean trait variance | Method variance (absolute value of unique covariance) | |
|---|---|---|
| Teacher | .409a | .113 |
| Peer | .555a | .039 |
| Child | .049a | .128 |
| Overall mean proportion | .338b | .093c |
Note.
Average squared trait pattern coefficients for each informant;
Average the sum of trait variance across informants;
Average the sum of method variance across informants.
As shown in Table 4, the overall mean proportion of trait variance was more than 3 times the overall mean proportion of method variance. The overall mean trait variance explained one third of the total variance, and the overall mean method variance explained less than one tenth, which suggested that the residual variance (variance of random error) was quite large. Within each informant, results indicated that peer-rated source was the best, because it has the largest mean trait variance and the smallest method variance, with a trait variance more than 14 times of method variance (55.5% vs. 3.9%). Teacher ratings also had a greater proportion of trait variance (40.9%) to method variance (11.3%), although the ratio of trait variance to method variance (ratio = 3.62) was much lower than that of peer ratings. Comparing to peer and teacher ratings, child ratings showed very poor measurement properties (ratio =.383). The mean trait variance was the smallest (4.9%) whereas the method variance (12. 8%) was the largest among the three informants.
Gender and Ethnic Differences
Multi-group comparison analysis was conducted within MPLUS to examine whether gender or ethnicity moderated the model fit of the MTMM structure. Nine chi-square difference tests were conducted (six on pattern coefficients, three on method effects) for comparing different gender and ethnic groups separately, and the critical p value for these comparisons was adjusted by the Bonferroni correction to prevent the inflated Type I error. Only the loading/path from the “Support” factor to “Peer-rated Support” was found significantly different between gender and ethnic groups in a few of the imputed datasets (1 out of 10 for testing the gender difference while 2 out of 10 for testing the ethnic group difference). Thus, the proposed CU model could be viewed as mostly invariant across different gender and ethnic groups given that only one loading was found to be different between these groups in just a few imputed datasets.
Discussion
This study examined the convergent and discriminant validity of measures on teacher-student relationship and child conduct problem with three different informants with an ethnically diverse sample of relatively low-achieving students. It is the first study to apply the multi-trait multi-method approach to the measurement of teacher-student support. The MTMM matrix found stronger agreement between teachers and peers than between child and either of the other informants for measures of teacher-student support and child conduct problem. Indeed, child reports of teacher-support were not significantly correlated with either teacher or peer reports of support. Conversely, and consistent with prior research on teacher-child agreement, child reports of conduct problems were modestly and significantly correlated with teacher and peer reports of conduct problems.
The correlated uniqueness model provided an adequate fit to our multitrait-multimethod data and provided evidence of both convergent and discriminant validity. The pattern coefficients of the six measures were all statistically significant. Peer ratings had the largest trait effects and negligible method effects. Compared to both teachers and peers, child ratings had small trait effects and large method effects. The two-trait model fit our MTMM data much better than the one-trait model, which suggested our MTMM structured data have convergent and discriminant validity.
Child perceptions of the relationship may be developmentally consequential, even if they do not agree with others’ perceptions. According to social-motivational theories (Furrer & Skinner, 2003), a child’s perception of the teacher as psychologically available to and affectively positive toward the child, whether congruent with other sources or not, may promote the child’s academic self-efficacy, sense of school belonging, and engagement. The bivariate correlations between children’s perceptions of support and child reports of academic self efficacy and teacher reports of behavioral engagement are consistent with this view. Although the association of child perceptions of support with perceived academic competence could be a result, in part, of method effects, the association with teacher-rated engagement cannot be explained by method effects. Stronger, but not conclusive, evidence that child perceptions of support affect children’s academic motivation and achievement is provided in a recent study with this same longitudinal sample. Specifically, child reports of teacher support in grades 2 and 3 predicted children’s levels of academic self-efficacy and reading and mathematics achievement the following year, above IQ and prior levels of the outcomes (Blinded, in press).
The finding that peer reports of the teacher’s provision of social support to students had the greatest trait variance and smallest method effect suggests that peer reports may be an under-utilized and valid method for assessing teacher-student support. Peer ratings aggregate judgments across many different peers, which should increase their reliability. Relative to teacher ratings, peer ratings would be particularly appropriate in longitudinal studies of teacher support, because they are less affected by individual rater effects. From a practical point of view, however, peer ratings are expensive and difficult to obtain, as they require canvassing all students in a classroom and obtaining parent consent to administer. Thus their use is more likely in research studies than in clinical assessments.
Study Limitations and Recommendations for Future Research
Results need to be interpreted in the context of certain study limitations. One limitation of the current study is the fact that the measures of teacher support and child conduct problems differed across informants. Although the teacher-report of support was developed from the child report of the Network of Relationships Inventory, items were reworded to reduce teachers’ tendency to respond in a socially desirable manner. For example, asking teachers “how much do you really care about this child” was deemed likely to elicit highly positive responses from teachers. However, the fact that several items were nearly identical across the teacher and child measure of support, and the high internal consistency reliability for both measures, provides some assurance that items are similar across the two scales. Nevertheless, method variability most likely increased variance attributed to the reporting source. The development of a parallel version of teacher-student relationships represents an important direction for future research.
Study attrition and missing data are additional limitations. With respect to study attrition, although attrition analyses revealed no differences between children for whom parent permission was not obtained or who attrited from the study by Year 3, one cannot rule out that they differed on unobserved variables. With respect to missing data, we used state-of-the–art methods for handling the relatively small percentage of missing data (Enders, 2010). The use of an academically at-risk sample limits generalization to students who are at low-risk of academic failure. Previous research has found stronger effects of the teacher-student relationship for students at-risk for academic problem (Burchinal et al., 2002). It will be important to determine if study findings generalize to samples that represent the entire span of academic ability. Future research is also needed to investigate the longitudinal associations between different informants on teacher-student relationships and children’s school adjustment and the respective processes that mediate these effects.
Conclusions
Psychologists have long recognized the importance of children’s peer relationships at school to their academic, behavioral, and social adjustment (Dodge & Pettit, 2003; Ladd, 1999). Recent research suggests that children’s relationships with teachers at school also have implications for their adjustment. Thus psychologists who take an ecological approach to child assessment may choose to assess children’s relational support at school with teachers as well as peers. Teacher ratings of support are economical to obtain, and the current study supports their convergent and discriminant validity. Child reports of the relationship offer information that is not redundant with information obtained from teachers and peers. Furthermore, to the degree that children perceive their teacher as emotionally supportive and available to them, they exert greater effort in the classroom and are more confident of their academic abilities. Thus, to obtain a complete picture of teacher-student relationship support, it is important to include both the teacher’s and the child’s perception.
Acknowledgments
This research was supported in part by grant to Jan N. Hughes from the National Institute of Child Health and Human Development (R01 HD39367).
Footnotes
The data reported in this study partially overlaps with data reported in Hughes, J. N. (in press). Longitudinal effects of teacher and student perceptions of teacher-student relationship qualities on academic adjustment. Elementary School Journal.
Contributor Information
Yan Li, Department of Educational Psychology, Texas A&M University.
Jan N. Hughes, Department of Educational Psychology, Texas A&M University
Oi-man Kwok, Department of Educational Psychology, Texas A&M University.
Hsien-Yuan Hsu, Center for Educational Research and Evaluation, National Taiwan Normal University, Taiwan.
References
- Achenbach TM, McConaughy SH, Howell CT. Child/adolescent behavioral and emotional problems: Implications of cross-informant correlations for situational specificity. Psychological Bulletin. 1987;101:213–232. [PubMed] [Google Scholar]
- Achenbach TM, Rescorla LA. Manual for the ASEBA School-Age Forms and Profiles. Burlington, VT: University of Vermont, Research Center for Children, Youth, & Families; 2001. [Google Scholar]
- Baker JA. Contributions of teacher-child relationships to positive school adjustment during elementary school. Journal of School Psychology. 2006;44:211–229. [Google Scholar]
- Bowlby J. Attachment and loss: Vol. III. Loss, sadness, and depression. New York: Basic Books; 1980. [Google Scholar]
- Brock DM, Sarason IG, Sanghvi H, Gurung RAR. The perceived acceptance scale: Development and validation. Journal of Social and Personal Relationships. 1998;15:5–21. [Google Scholar]
- Burchinal MR, Peisner-Feinberg E, Pianta R, Howes C. Development of academic skills from preschool through second grade: family and classroom predictors of developmental trajectories. Journal of School Psychology. 2002;40:415–436. [Google Scholar]
- Buyse E, Verschueren K, Verachtert P, Van Damme J. Predicting school adjustment in early elementary school: Impact of teacher-child relationship quality and relational classroom climate. The Elementary School Journal. 2009;110:119–141. [Google Scholar]
- Campbell DT, Fiske DW. Convergent and discriminant validation by the multitrait-multimethod matrix. Psychological Bulletin. 1959;56(2):81–105. [PubMed] [Google Scholar]
- Caplan G. The theory and practice of mental health consultation. New York: Basic Books; 1970. [Google Scholar]
- Chen Q, Hughes JN, Kwok O, Liew J. Joint Contributions of Peer Acceptance and Peer Academic Reputation to Achievement in Academically At Risk Children: Mediating Processes. Journal of Applied Developmental Psychology. 2010;31:448–459. doi: 10.1016/j.appdev.2010.09.001. [DOI] [PMC free article] [PubMed] [Google Scholar]
- Cole DA. Utility of confirmatory factor analysis in test validation research. Journal of Consulting and Clinical Psychology. 1987;55:584–594. doi: 10.1037/0022-006X.55.4.584. [DOI] [PubMed] [Google Scholar]
- Conway JM. Estimation and uses of the proportion of method variance for multitrait-multimethod data. Organizational Research Methods. 1998;1:209–222. [Google Scholar]
- Corten IW, Saris WE, Coenders G, Veld WVD, Aalberts CE, Kornelis C. Fit of different models for multitrait-multimethod experiments. Structural Equation Modeling. 2002;9:213–232. [Google Scholar]
- Deci EL, Ryan RM. Intrinsic motivation and self-determination in human behavior. New York: Plenum; 1985. [Google Scholar]
- Deci EL, Ryan RM. A motivational approach to self: Integration in personality. In: Dienstbier RA, editor. Nebraska symposium on motivation, 1990. Lincoln, NE: University of Nebraska Press; 1991. pp. 237–288. [PubMed] [Google Scholar]
- Decker DM, Dona DP, Christenson SL. Behaviorally at-risk African American students: The importance of student-teacher relationships for student outcomes. Journal of School Psychology. 2007;45:83–109. [Google Scholar]
- Dodge KA, Pettit GS. A biopsychosocial model of the development of chronic conduct problems in adolescence. Developmental Psychology. 2003;39:349–371. doi: 10.1037//0012-1649.39.2.349. [DOI] [PMC free article] [PubMed] [Google Scholar]
- Doumen S, Verschueren K, Buyse E, Buyse E, Germeijs V, Luyckx K, et al. Reciprocal relations between teacher-child conflict and aggressive behavior in kindergarten: A three-wave longitudinal study. Journal of Clinical Child and Adolescent Psychology. 2008;37:588–588. doi: 10.1080/15374410802148079. [DOI] [PubMed] [Google Scholar]
- Doumen S, Verschueren K, Buyse E, De Munter S, Max K, Moens L. Further examination of the convergent and discriminant validity of the Student-Teacher Relationship Scale. Infant and Child Development. 2009;18:502–520. [Google Scholar]
- Eid M, Lischetzke T, Nussbeck FW, Trierweiler LI. Separating trait effects from trait-specific method effects in multitrait–multimethod models: A multiple-indicator CT-C (M-1) model. Psychological Methods. 2003;8:38–60. doi: 10.1037/1082-989x.8.1.38. [DOI] [PubMed] [Google Scholar]
- Enders CK. Applied missing data analysis. New York, NY: Guilford; 2010. [Google Scholar]
- Evans GW. The environment of childhood poverty. American Psychologist. 2004;59:77–92. doi: 10.1037/0003-066X.59.2.77. [DOI] [PubMed] [Google Scholar]
- Flook L, Repetti RL, Ullman JB. Classroom social experiences as predictors of academic performance. Developmental Psychology. 2005;41:319–327. doi: 10.1037/0012-1649.41.2.319. [DOI] [PubMed] [Google Scholar]
- Furman W, Buhrmester D. Children’s perceptions of the personal relationships in their social networks. Developmental Psychology. 1985;21:1016–1024. [Google Scholar]
- Furman W, Buhrmester D. Age and sex differences in perceptions of networks of personal relationships. Child Development. 1992;63(1):103–115. doi: 10.1111/j.1467-8624.1992.tb03599.x. [DOI] [PubMed] [Google Scholar]
- Furrer C, Skinner E. Sense of relatedness as a factor in children’s academic engagement and performance. Journal of Educational Psychology. 2003;95:148–162. [Google Scholar]
- Gest SD, Welsh JA, Domitrovich CE. Behavioral predictors of changes in social relatedness and liking school in elementary school. Journal of School Psychology. 2005;43:281–301. [Google Scholar]
- Goodman R. The Strengths and Difficulties Questionnaire: A research note. Journal of Child Psychology and Psychiatry. 1997;38:581–586. doi: 10.1111/j.1469-7610.1997.tb01545.x. [DOI] [PubMed] [Google Scholar]
- Goodman R. Psychometric properties of the Strengths and Difficulties Questionnaire. Journal of Child Psychology and Psychiatry. 2001;40:791–799. doi: 10.1097/00004583-200111000-00015. [DOI] [PubMed] [Google Scholar]
- Guay F, Boivin M, Hodges EVE. Predicting change in academic achievement: A model of peer experiences and self-system processes. Journal of Educational Psychology. 1999;91:105–115. [Google Scholar]
- Hamre BK, Pianta RC. Early teacher-child relationships and the trajectory of children’s school outcomes through eighth grade. Child Development. 2001;72:625–638. doi: 10.1111/1467-8624.00301. [DOI] [PubMed] [Google Scholar]
- Hamre BK, Pianta RC. Student-teacher relationships. In: Bear GC, Minke KM, editors. Children’s needs III: Development, prevention, and intervention. Washington, DC: National Association of School Psychologists; 2006. pp. 59–71. [Google Scholar]
- Harter S. Unpublished manuscript. University of Denver; 1985. Manual for the Perceived Competence Scale for Children. [Google Scholar]
- Hill CR, Hughes JN. Further evidence of the convergent and discriminant validity of the Strengths and Difficulties Questionnaire. School Psychology Quarterly. 2007;22:380–406. doi: 10.1037/1045-3830.22.3.380. [DOI] [PMC free article] [PubMed] [Google Scholar]
- Howes C, Hamilton CE, Matheson CC. Children’s relationships with peers: Differential associations with aspects of the teacher-child relationship. Child Development. 1994;65:253–263. doi: 10.1111/j.1467-8624.1994.tb00748.x. [DOI] [PubMed] [Google Scholar]
- Hughes JN. Longitudinal effects of teacher and student perceptions of teacher-student relationship qualities on academic adjustment. Elementary School Journal. doi: 10.1086/660686. in press. [DOI] [PMC free article] [PubMed] [Google Scholar]
- Hughes JN, Cavell TA, Jackson T. Influence of teacher-student relationships on aggressive children’s development: A prospective study. Journal of Clinical Child Psychology. 1999;28:173–184. doi: 10.1207/s15374424jccp2802_5. [DOI] [PubMed] [Google Scholar]
- Hughes JN, Cavell TA, Willson V. Further support for the developmental significance of the quality of the teacher-student relationship. Journal of School Psychology. 2001;39(4):289–301. [Google Scholar]
- Hughes JN, Kwok O. The influence of student-teacher and parent-teacher relationships on lower achieving readers’ engagement and achievement in the primary grades. Journal of Educational Psychology. 2007;99:39–51. doi: 10.1037/0022-0663.99.1.39. [DOI] [PMC free article] [PubMed] [Google Scholar]
- Hughes JN, Luo W, Kwok O, Loyd L. Teacher-student support, behavior engagement, and achievement: A three year longitudinal study. Journal of Educational Psychology. 2008;100:1–14. doi: 10.1037/0022-0663.100.1.1. [DOI] [PMC free article] [PubMed] [Google Scholar]
- Hughes JN, Villarreal V. Concurrent and Longitudinal Effects of Multiple Perceptions of Teacher –Student Relationship on School Adjustment. Presented at International Association of School Psychologists; Utrecht, the Neatherlands. Jul, 2008. [Google Scholar]
- Hughes JN, Yoon J, Cavell TA. Child, Teacher, and Peer Reports of Teacher-Student Relationship. Cross-Informant Agreement and Relationship to School Adjustment; Paper presented at the biennial meeting of the Society for Research in Child Development; Albuquerque, NM. 1999. Apr, [Google Scholar]
- Kenny DA, Kashy DA. Analysis of the multitrait-multimethod matrix by confirmatory factor analysis. Psychological Bulletin. 1992;112:165–172. [Google Scholar]
- Ladd GW, Birch SH, Buhs ES. Children’s social and scholastic lives in kindergarten: Related spheres of influence? Child Development. 1999;70:1373–1400. doi: 10.1111/1467-8624.00101. [DOI] [PubMed] [Google Scholar]
- Lance CE, Noble CL, Scullen SE. A critique of the correlated trait-correlated method and correlated uniqueness models for multitrait-multimethod data. Psychological Methods. 2002;7:228–244. doi: 10.1037/1082-989x.7.2.228. [DOI] [PubMed] [Google Scholar]
- Liew J, Chen Q, Hughes JN. Child Effortful Control, Teacher-student Relationships, and Achievement in Academically At-Risk Children: Additive and Interactive Effects. Early Childhood Research Quarterly. 2010;25:51–64. doi: 10.1016/j.ecresq.2009.07.005. [DOI] [PMC free article] [PubMed] [Google Scholar]
- Little M, Kobak R. Emotional security with teachers and children’s stress reactivity: A comparison of special-education and regular-education classrooms. Journal of Clinical Child & Adolescent Psychology. 2003;32:127–138. doi: 10.1207/S15374424JCCP3201_12. [DOI] [PubMed] [Google Scholar]
- Mantzicopoulos P, Neuharth-Pritchett S. Development and validation of a measure to assess head start children’s appraisals of teacher support. Journal of School Psychology. 2003;41(6):431–451. [Google Scholar]
- Masten AS, Morison P, Pellegrini DS. A revised class play method of peer assessment. Developmental Psychology. 1985;21:523–533. [Google Scholar]
- Matsumura LC, Slater SC, Crosson A. Classroom climate, rigorous instruction and curriculum, and students’ interactions in urban middle schools. The Elementary School Journal. 2008;108:293–312. [Google Scholar]
- Meehan BT, Hughes JN, Cavell TA. Teacher-Student Relationships as Compensatory Resources for Aggressive Children. Child Development. 2003;74:1145–1157. doi: 10.1111/1467-8624.00598. [DOI] [PubMed] [Google Scholar]
- Muris P, Meesters C, Fijen P. The Self-Perception Profile for Children: Further evidence for its factor structure, reliability, and validity. Personality and Individual Differences. 2003;35:1791–1802. [Google Scholar]
- Murray C, Murray KM, Waas GA. Child and teacher reports of teacher–student relationships: Concordance of perspectives and associations with school adjustment in urban kindergarten classrooms. Journal of Applied Developmental Psychology. 2008;29:49–61. [Google Scholar]
- Muthén LK, Muthén BO. Mplus user’s guide. Los Angeles: Muthén and Muthén; 2007. [Google Scholar]
- Palermo F, Hanish LD, Martin CL, Fabes RA, Reiser M. Preschoolers’ academic readiness: What role does the teacher-child relationship play? Early Childhood Research Quarterly Special Issue: Early Childhood Research Quarterly. 2007;22:407–422. doi: 10.1016/j.ecresq.2007.04.002. [DOI] [PMC free article] [PubMed] [Google Scholar]
- Pianta RC, editor. Beyond the parent: The role of other adults in children’s lives. San Francisco: Jossey-Bass; 1992. pp. 121–129. [Google Scholar]
- Pianta RC, Stuhlman MW. Teacher-child relationships and children’s success in the first years of school. School Psychology Review. 2004;33:444–458. [Google Scholar]
- Pianta RC, Steinberg MS, Rollins KB. The first two years of school: Teacher-child relationships and deflections in children’s classroom adjustment. Development and Psychopathology. 1995;7:295–312. [Google Scholar]
- Realmuto GM, August GJ, Sieler JD, Pessoa-Brandao L. Peer assessment of social reputation in community samples of disruptive and nondisruptive children: Utility of the revised class play method. Journal of Clinical Child Psychology. 1997;26:67–76. doi: 10.1207/s15374424jccp2601_7. [DOI] [PubMed] [Google Scholar]
- Renk K, Phares V. Cross-informant ratings of social competence in children and adolescents. Clinical Psychology Review. 2004;24:239–254. doi: 10.1016/j.cpr.2004.01.004. [DOI] [PubMed] [Google Scholar]
- Resnick MD, Bearman PS, Blum RW, Bauman KE, Harris KM, Jones J, Tabor J, Beuhring T, Sieving RE, Shew M, Ireland M, Bearinger LH, Udry JR. Protecting adolescents from harm: Findings from the National Longitudinal Study on Adolescent Health. Journal of the American Medical Association. 1997;278:823–832. doi: 10.1001/jama.278.10.823. [DOI] [PubMed] [Google Scholar]
- Rey RB, Smith AL, Yoon J, Somers C, Barnett D. Relationships between teachers and urban African American children: The role of informant. School Psychology International. 2007;28(3):346–364. [Google Scholar]
- Weiss RS. The provisions of social relationships. In: Rubin Z, editor. Doing unto others. Englewood Cliffs, NJ: Prentice-Hall; 1974. [Google Scholar]
- Rubin DB. Multiple Imputation for Nonresponse in Surveys. New York: Wiley; 1987. [Google Scholar]
- Schafer JL. NORM: Multiple imputation of incomplete multivariate data under a normal model (Version 2.03) Computer statistical software. 2000 available from http://www.stat.psu.edu/~jls/misoftwa.html.
- Silver RB, Measelle JR, Armstrong JM, Essex MJ. Trajectories of classroom externalizing behavior: Contributions of child characteristics, family characteristics, and the teacher-child relationship during the school transition. Journal of School Psychology. 2005;43:39–60. [Google Scholar]
- Skinner E, Belmont M. Motivation in the classroom: Reciprocal effects of teacher behavior and student engagement across the school year. Journal of Educational Psychology. 1993;85:571–581. [Google Scholar]
- Terry R. Recent advances in measurement theory and the use of sociometric techniques. In: Cillessen AHN, Bukowski WM, editors. Recent advances in the measurement of acceptance and rejection in the peer system: New directions for child and adolescent development. 88 . San Francisco: Jossey-Bass; 2000. pp. 27–53. [DOI] [PubMed] [Google Scholar]
- Weinstein RS, Marshall HH, Sharp L, Botkin M. Pygmalion and the student: Age and classroom differences in children’s awareness of teacher expectations. Child Development. 1987;58:1079–1093. [PubMed] [Google Scholar]
- West SG, Finch JF, Curran PJ. Structural equation models with nonnormal variables: Problems and remedies. In: Hoyle RH, editor. Structural equation modeling: Concepts, issues, and applications. Thousand Oaks, CA: Sage Publications; 1995. pp. 56–75. [Google Scholar]
- Wigfield A, Eccles JS, Yoon KS, Harold RD, Arbreton AJA, Freedman-Doan C, et al. Change in children’s competence beliefs and subjective task values across the elementary school years: A 3-year study. Journal of Educational Psychology. 1997;89:451–469. [Google Scholar]
- Woodcock RW, Johnson MB. Woodcock-Johnson Psycho-educational Battery-Revised. Allen, TX: DLM Teaching Resources; 1989. [Google Scholar]
- Woodcock RW, Munoz-Sandoval AF. Woodcock-Munoz Language Survey. Itasca, IL: Riverside; 1993. [Google Scholar]
- Woodcock RW, Munoz-Sandoval AF, McGrew K, Mather N, Schrank F. Bateria III Woodcock-Munoz. Riverside, CA: Riverside Publishing; 2004. [Google Scholar]
- Woodcock RW, McGrew KS, Mather N. WJ-III Tests of Achievement. Itasca, IL: Riverside Publishing; 2001. [Google Scholar]