

Abstract
Clinical inhibitor amprenavir (APV) is less effective on HIV-2 protease (PR2) than on HIV-1 protease (PR1). We solved the crystal structure of PR2 with APV at 1.5 Å resolution to identify structural changes associated with the lowered inhibition. Furthermore, we analyzed the PR1 mutant (PR1M) with substitutions V32I, I47V, and V82I that mimic the inhibitor binding site of PR2. PR1M more closely resembled PR2 than PR1 in catalytic efficiency on four substrate peptides and inhibition by APV, whereas few differences were seen for two other substrates and inhibition by saquinavir (SQV) and darunavir (DRV). High resolution crystal structures of PR1M with APV, DRV, and SQV were compared with available PR1 and PR2 complexes. Val/Ile32 and Ile/Val47 showed compensating interactions with SQV in PR1M and PR1, however, Ile82 interacted with a second SQV bound in an extension of the active site cavity of PR1M. Residues 32 and 82 maintained similar interactions with DRV and APV in all the enzymes, whereas Val47 and Ile47 had opposing effects in the two subunits. Significantly diminished interactions were seen for the aniline of APV bound in PR1M and PR2 relative to the strong hydrogen bonds observed in PR1, consistent with 15- and 19-fold weaker inhibition, respectively. Overall, PR1M partially replicates the specificity of PR2 and gives insight into drug resistant mutations at residues 32, 47, and 82. Moreover, this analysis provides a structural explanation for the weaker antiviral effects of APV on HIV-2.
Keywords: HIV/AIDS, drug resistance, aspartic protease, antiviral inhibitors, molecular recognition
Introduction
Acquired immunodeficiency syndrome (AIDS) is a major health challenge with a global estimate of over 30 million people infected with HIV and 1.8 million deaths in 2009.1 Anti-retroviral treatment has increased survival of HIV-infected patients, however, long-term therapy is compromised by the selection of drug resistance mutations and the high genetic diversity of the virus. There are two major types: HIV-1 and HIV-2; the more common HIV-1 is subdivided into the four groups of M, N, O, and P as well as several subtypes. HIV-2 infections account for more than 1 million people, or about a third of the HIV prevalence in West Africa2, 3 and are spreading into other continents.4, 5 Treatment of HIV-2 infections employs the drugs developed for HIV-1, however, several drugs are less effective on HIV-2.2, 3 A further therapeutic quandary is posed by the drug resistant mutations arising in HIV-2 and co-infections of HIV-1 and HIV-2.2, 6
HIV-1 protease (PR1) is a very effective drug target for AIDS treatment because its activity is essential for hydrolyzing the viral Gag and Gag-Pol precursor polyproteins during the maturation of infectious virus.7 PR1 inhibitors illustrate the success of structure-guided drug designs. Several hundred crystal structures are available for wild type and mutant PR1 complexes with the clinical drugs and many other inhibitors.8 Currently, nine FDA approved PR1 inhibitors are used in Highly Active Antiretroviral Therapy (HAART). Some of these clinical inhibitors, such as amprenavir (APV) and nelfinavir (NFV), show lower efficacy on HIV-2 infections and weaker inhibition of HIV-2 protease (PR2).2, 7, 9 PR1 and PR2 share 39–48% amino acid sequence identity depending on the strain of virus and similar overall structure.3, 10–12 The two enzymes differ in their cleavage site sequences in the viral precursors and in their specificity for peptide substrates and inhibitors, especially at the P2 positions of peptide substrates.13, 14 The sequence differences between PR1 and PR2 are expected to be responsible for the differences in efficacy of inhibitors and include substitutions observed in resistance of HIV-1 to the current drugs (Fig. 1).15 In particular, the binding site for clinical inhibitors differs only in the conservative substitution of hydrophobic residues Val32, Ile47, and Val82 in PR1 by Ile32, Val47, and Ile82 in PR2. Earlier studies showed that PR1 bearing the substitutions, V32I, I47V, and V82I, altered the inhibition but not the binding mode of a tripeptide inhibitor.16, 17 These residues are the sites of drug resistance mutations V32I, I47V, and various substitutions of Val82 in HIV-1 (Fig. 1).15
Figure 1.
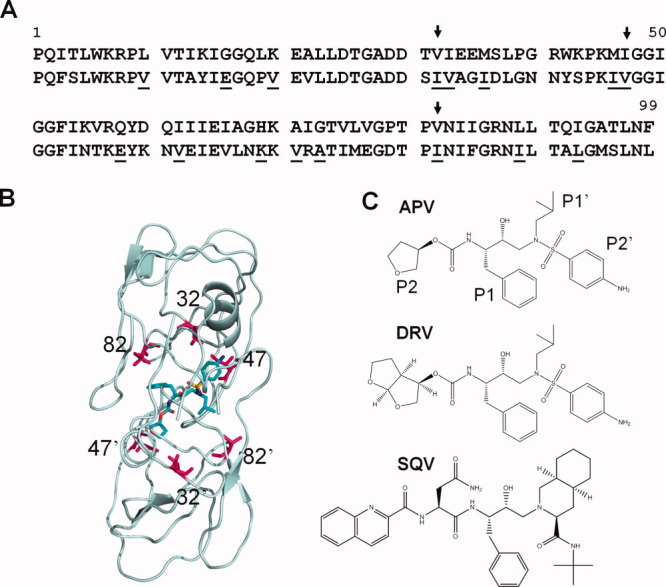
A: Amino acid sequences of HIV PR1 (upper line) and PR2 (lower line). PR2 residues associated with drug resistance in PR1 are underlined. Arrows indicate the amino acid differences in the inhibitor binding site Val/Ile32, Ile/Val47, and Val/Ile82. B: Location of residues 32, 47, and 82 (magenta) in PR dimer with SQV (cyan). C: Chemical structures of APV, DRV, and SQV with groups P2-P2′ labeled for APV. [Color figure can be viewed in the online issue, which is available at wileyonlinelibrary.com.]
In contrast to PR1, very few crystal structures are available for PR2 complexes with clinical inhibitors. We have shown that DRV, which maintains antiviral potency on HIV-1 and HIV-2 infections, demonstrates similar binding mode in PR1 and PR2 crystal structures, as does indinavir (IDV).11, 12 Here, we report the crystal structure of PR2 with APV, which by comparison with our PR1–APV structure18 helps explain the lower efficacy of this inhibitor on HIV-2 infections. Furthermore, we constructed the PR1 mutant with substitutions of the three PR2 residues that differ in the inhibitor-binding site (V32I, I47V, and V82I; designated PR1M) to investigate the importance of these residues in the substrate specificity and binding of clinical inhibitors. The inhibitors APV, DRV and SQV were selected due to their distinct effects on the two types of virus. HIV-2 strains were shown to be susceptible to DRV19 and to SQV,20, 21 while natural resistance to APV was found for several HIV-2 strains.20–22 Thus, crystallographic and kinetic analysis of PR1M, PR1 and PR2 will improve our understanding of the differences in inhibitor potency. Furthermore, this knowledge can be exploited in the design of broader-spectrum inhibitors targeting the natural variants of PR1, PR2 and their drug resistant mutants.
Results
Substrate specificity and inhibition
The three enzymes were assessed for hydrolysis of peptides representing natural cleavage sites of HIV-2 precursor polyproteins. Also, peptides were tested with variants of the P2 and P4 positions of the HIV-1 MA-CA cleavage site (between the MA and CA proteins in the precursor) that distinguish the substrate specificities of retroviral PRs.14, 23 Two peptides represent the HIV-2 cleavage sites CA/p2 (KARLM↓AEALK, where ↓ indicates the position of the cleaved peptide bond) and p2/NC (IPFAA↓AQQRK). Four peptides were selected with different amino acids (Val and Leu) at the P2 and P4 positions in the HIV-1 MA/CA cleavage site (VSQNY↓PIVQ) to explore the variation due to the substitutions of residues 32, 47, and 82 that differ in the substrate binding cavities of PR1 and PR2 (Fig. 1). Kinetic parameters are summarized in Table I. The Km values showed low variation ranging from 0.07 to 0.57 mM over the measured PRs and substrates. Significant differences were observed only for hydrolysis of the HIV-2 p2/NC peptide where the Km values were identical for PR1M and PR2 and 4-fold lower than that for PR1. The kcat values for different substrates exhibited a wider range covering two orders of magnitude from 0.06 to 5.1 s−1. Values of kcat for PR1M were closer to those of PR2 for substrates (2), (4), and (6), however, the three PRs had kcat values in the same range for substrates (1) and (3).
Table I.
Kinetic Parameters Obtained for Oligopeptide Substrates
| Peptide | Protease | Km (mM) | kcat (s−1) | kcat/Km (mM−1s−1) | Relative kcat/Km | |
|---|---|---|---|---|---|---|
| (1) HIV-2 CA/p2 | KARLM↓AEALK | PR1a | 0.13 | 0.3 | 2.3 | 1.0 |
| PR2a | 0.08 | 1.2 | 15.0 | 6.5 | ||
| PR1M | 0.09 | 0.6 | 6.6 | 2.9 | ||
| (2) HIV-2 p2/NC | IPFAA↓AQQRK | PR1a | 0.28 | 0.3 | 1.1 | 1.0 |
| PR2a | 0.07 | 0.8 | 11.4 | 10.4 | ||
| PR1M | 0.07 | 1.2 | 16.3 | 14.8 | ||
| (3) HIV-1 MA/CA | VSQVY↓PIVQ | PR1 | 0.24 | 2.6 | 10.8 | 1.0 |
| PR2b | 0.43 | 2.5 | 5.8 | 0.5 | ||
| PR1M | 0.35 | 3.0 | 8.6 | 0.8 | ||
| (4) HIV-1 MA/CA | VSQLY↓PIVQ | PR1b | 0.12 | 0.4 | 3.3 | 1.0 |
| PR2b | 0.17 | 3.4 | 20.0 | 6.1 | ||
| PR1M | 0.38 | 5.1 | 8.6 | 2.6 | ||
| (5) HIV-1 MA/CA | VVQNY↓PIVQ | PR1 | 0.19 | 0.16 | 0.8 | 1.0 |
| PR2c | N.D. | N.D. | 0.6 | 0.8 | ||
| PR1M | 0.23 | 0.18 | 0.8 | 1.0 | ||
| (6) HIV-1 MA/CA | VLQNY↓PIVQ | PR1c | 0.40 | 0.06 | 0.2 | 1.0 |
| PR2c | 0.57 | 0.6 | 1.0 | 5.0 | ||
| PR1M | 0.32 | 0.26 | 0.8 | 4.0 |
The kcat/Km value is the most useful for comparing the specificity of different enzymes. PR2 had significantly greater catalytic efficiency by 5- to 10-fold compared to PR1 for substrates (1), (2), (4), and (6). Similarly, PR1M mutant showed 2.6–15-fold higher kcat/Km values relative to PR1. PR1M and PR2 shared similar kcat/Km values for substrate (2) representing the HIV-2 p2/NC site and substrate (6). However, PR1M showed kcat/Km values intermediate between the values for PR1 and PR2 for substrates (1) and (4). The three enzymes had indistinguishable kcat/Km values (less than two-fold difference) for substrates (3) and (5). The PR1M mutant showed no preference for the Val or Leu at P2 in peptides (3) and (4), although P2 Leu was favored by PR2 and Val by PR1. Leu at the P4 position was preferred over Val in peptides (5) and (6) for PR2 and PR1M, although the opposite trend was observed for PR1. Overall, the kinetic parameters of PR1M mutant were more comparable to those of PR2 rather than PR1.
The catalytic activities of the HIV proteases were inhibited by APV, DRV and SQV (Table II). The results for PR1 and PR2 are similar to those reported using a chromogenic substrate based on the HIV-1 CA-p2 site.9 APV exhibited good inhibition for PR1 while PR1M and PR2 were more poorly inhibited with Ki values of 15 and 19-fold higher than for PR1, respectively. DRV showed similar inhibition for PR1 and PR2, and 6-fold weaker inhibition of the mutant. SQV showed similar inhibition constants for all three enzymes with differences of no more than 2-fold. Both SQV and DRV retain antiviral potency for HIV-2 and HIV-1 infections. Overall, APV is the least effective among three inhibitors for PR1M and PR2, which is consistent with the observations of natural resistance of HIV-2 to APV, and the 10-30 fold higher IC50 values of APV for HIV-2 infected compared to HIV-1 infected cells.3, 21
Table II.
Ki Values for Inhibitors (nM)
| DRV | SQV | APV | |
|---|---|---|---|
| PR1 | 0.04 | 0.11 | 0.17 |
| PR1M | 0.23 (6) | 0.24 (2) | 2.53 (15) |
| PR2 | 0.04 (1) | 0.07 (0.6) | 3.24 (19) |
Values relative to PR1 are shown in parentheses.
Crystallographic analysis
Crystal structures were solved for the PR2 with APV and of PR1M complexes with clinical inhibitors DRV, SQV, and APV (Table III). The asymmetric units contained one PR dimer with residues numbered 1–99 and 1′–99′. Three datasets were collected with high resolutions of 1.26–1.51 Å and were refined to final R-factors of 0.16–0.18. The PR1M-SQV complex had the lowest resolution of 1.88 Å and was refined to an R-factor of 0.19. Clear electron density was observed for all the residues in PR1M and PR2, inhibitor, solvent molecules and ions in all structures. The APV complex showed a single conformation of inhibitor in both PR1M and PR2, although the P2′ aniline group had two alternate positions in PR1M (Fig. 2). Two alternate orientations of DRV were refined in the active site cavity of PR1M-DRV, as described previously.24 An extra SQV molecule was observed in an extension of the usual binding site in the structure of PR1M-SQV, as described later. The crystal structure of PR1M-APV, obtained from crystals grown in potassium iodine solution, was refined with 21 iodide ions, while one sodium and two chloride ions were observed in the PR1M-DRV crystals grown with sodium chloride as precipitant. Iodide ions were identified by the high peaks in electron density maps, even at partial occupancy, abnormal B factors, and van der Waals contacts of 3.4–3.8  to nitrogen atoms, as noted in Reference18. The solvent in the PR2-APV structure comprised one sodium, eight chloride, seven zinc ions, and six imidazole molecules from the crystallization solution, as described for PR2-DRV.12
Table III.
Crystallographic Data Collection and Refinement Statistics
| Structures | PR1M-DRV | PR1M–SQV | PR1M-APV | PR2-APV |
|---|---|---|---|---|
| Space group | P21212 | P212121 | P21212 | C2 |
| Unit cell parameters | ||||
| a (Å) | 58.6 | 29.2 | 58.4 | 106.0 |
| b (Å) | 86.2 | 67.4 | 86.6 | 31.0 |
| c (Å) | 46.2 | 92.8 | 46.3 | 56.2 |
| β (°) | 90.0 | 90.0 | 90.0 | 91.66 |
| Resolution range (Å) | 50–1.42 | 50–1.88 | 50–1.26 | 50–1.51 |
| Unique reflections | 45,155 | 15,355 | 58,771 | 25,917 |
| Rmerge (%) overall (final shell) | 8.4 (33.6) | 10.8 (40.8) | 6.3 (36.1) | 8.1 (25.5) |
| I/σ(I) overall (final shell) | 16.2 (3.0) | 13.7 (2.2) | 14.5 (2.1) | 12.8 (2.9) |
| Completeness (%) overall (final shell) | 90.9 (50.5) | 98.3 (87.5) | 91.3 (59.9) | 90.3 (63.3) |
| Data range for refinement (Å) | 10–1.42 | 10–1.88 | 10–1.26 | 10–1.51 |
| R (%) | 15.7 | 18.8 | 15.9 | 18.2 |
| Rfree (%) | 20.8 | 23.4 | 19.1 | 23.8 |
| No. of solvent atoms (total occupancies) | 178 (138.3) | 100 (83.0) | 162 (103.5) | 144 (124.7) |
| RMS deviation from ideality | ||||
| Bonds (Å) | 0.010 | 0.032 | 0.012 | 0.008 |
| Angle distance (Å) | 0.030 | 2.388* | 0.031 | 0.027 |
| Average B-factors (Å2) | ||||
| Main-chain atoms | 17.8 | 17.3 | 17.0 | 17.7 |
| Side-chain atoms | 24.3 | 22.5 | 23.8 | 23.0 |
| Inhibitor | 15.6 | 19.5 | 17.5 | 20.8 |
| Solvent | 27.9 | 20.3 | 24.6 | 24.6 |
RMS deviation in °
Figure 2.
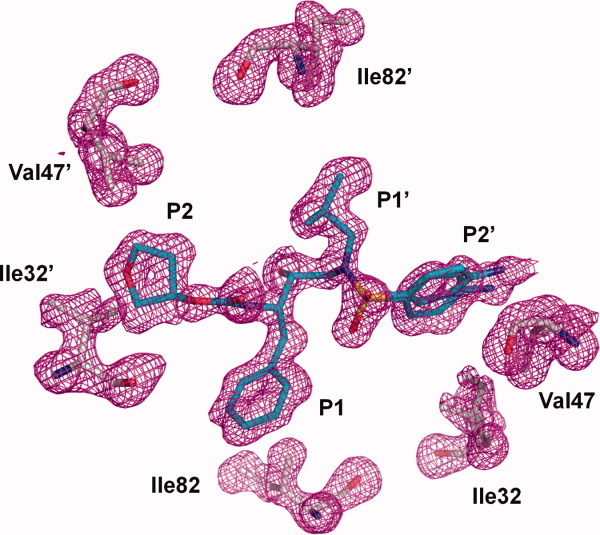
Omit electron density map for APV and mutated residues Ile32, Val47, and Ile82 in the two subunits of the PR1M dimer. The map was contoured at 2.2σ level. Ile82 and 82′ in the S1/S1′ subsites interact with P1′ and P1 groups of the inhibitor. Ile32/32′ and Val47/47′ contribute to the S2/S2′ subsites and interact with the P2 and P2′ groups of APV. [Color figure can be viewed in the online issue, which is available at wileyonlinelibrary.com.]
Second binding site for SQV in PR1M-SQV
The structure of PR1M in complex with SQV contained an extra SQV molecule (designated SQV-B) bound in an extension of the regular inhibitor binding pocket. This second SQV binding site has not been reported before. The P3 quinoline of SQV-B interacted with the aromatic P3 and P1 groups of SQV-A bound in the usual position in the active site cavity [Fig. 3(A)]. Hence, the SQV molecules alternate their orientation continuously though the adjacent binding pockets of the PR dimers packed in the crystal lattice [Fig. 3(B)]. Half of SQV-B interacted with the PR1M dimer while the other half interacted with two symmetry related dimers [Fig. 3(C)]. SQV-B formed a hydrogen bond with the side chain of Glu34′, a water-mediated interaction with the side chain of Arg8′, and hydrophobic interactions with Leu10′, Glu21′, Leu23′, Pro81′, and Ile82′. The residues Arg8, Pro81, Ile82, Gly48′, and Phe53′ from symmetry dimer 1 and Trp42, Pro44 from symmetry dimer 2 formed a binding site for the other part of SQV-B. Two direct hydrogen bonds were formed between SQV-B oxygen atoms and the side chain of Arg8 of symmetry dimer 1 and a network of two water molecules linked it to Asn83. No hydrogen bond interactions were observed between SQV-B and symmetry related dimer 2. The minimal interactions of SQV-B with three symmetry related dimers suggested that it was likely a result of crystal packing. Interestingly, a second DRV binding site in a different location on the flap on one subunit was reported in HIV-1 PRV32I and PRM46L complexes25 in the same space group and similar cell parameters. The SQV-B interacts closely with mutated Ile82 in PR1M, which raises the question of whether SQV can bind to a similar second site in PR2. The majority of residues contacting SQV-B are identical in PR1 and PR2 [Fig. 1(A)], however, the hydrogen bond interaction of SQV-B with the side chain of Glu34 cannot occur for Ala34 in PR2, which lowers the probability of SQV binding at the equivalent site.
Figure 3.

SQV-B in the extended binding site of PR1M. A: Omit map for SQV-A and SQV-B. SQV-B interacts with SQV-A in an extension of the regular active site cavity. B: SQV-B molecule is surrounded by three PR1M dimers in the crystal lattice, colored in green, cyan, and magenta. The SQV-A occupying the regular binding pocket is colored by atom type, whereas the extra SQV-B is shown in red. The arrows represent the alternating orientations of SQV-A and SQV-B molecules. C: SQV-B interactions with PR1M dimer, symmetry-related dimer 1, and symmetry-related dimer 2. Mutated residues are in pink surface representation, SQV-A is in golden color, and the surfaces of the residues involved in polar or hydrophobic interactions are shown in green and blue, respectively. Water molecules are shown as red spheres. Hydrogen bonds are indicated by red dotted lines. [Color figure can be viewed in the online issue, which is available at wileyonlinelibrary.com.]
Comparison of PR-inhibitor structures
The interactions of the individual inhibitors were analyzed in their complexes with PR1M, wild-type PR1, and PR2 to understand the structural effects of the three mutations. The following structures were chosen for the comparison: PR1-DRV (2IEN at 1.30 Å resolution),24 PR1-APV (3NU3 at 1.02 Å resolution),18 PR1-SQV (2NMY at 1.10 Å resolution),26 and PR2-DRV (3EBZ at 1.20 Å resolution).12 The PR1M and PR1 dimers are almost identical with small RMSDs of ∼0.2 Å for the pairs of structures in the same space group and unit cell, whereas larger differences of 0.7–0.8 Å were apparent between structures with non-isomorphous unit cells. The largest difference of 1.1 Å was shown by PR2-DRV and PR2-APV structures compared with the corresponding PR1M complexes, due in part to the different space groups. The majority of interactions with each inhibitor were conserved in the three enzymes. Therefore, the detailed structural analysis focusing on differences around residues 32, 47, and 82 is described separately for each inhibitor.
SQV complexes with PR1M and PR1
The PR1M and PR1 structures superimposed with the relatively large RMSD of 0.67 Å with the largest shifts of 2–3 Å for the surface residues 35–40. No suitable crystals were obtained for PR2 with SQV. Comparison of the SQV interactions is complicated by the second SQV-B found in PR1M (Fig. 3). SQV-A was bound within subsites S3 to S2′ of PR1M and showed almost identical hydrogen bond interactions to those described for PR1-SQV.26 The minor exception was that SQV had a shorter hydrogen bond to the main chain carbonyl oxygen of Gly27 in PR1M with a distance of 3.2 Å compared to the weaker interaction with longer separation of 3.6 Å for PR1. A similar shorter interaction was described in the SQV complex with another mutant PRL76V,27 however, the interaction in PR1M may be influenced by the aromatic-aromatic interactions of the adjacent P1 and P3 groups of SQV-A with the quinoline rings of SQV-B [Fig. 3(A)].
The hydrophobic interactions at the sites of the three mutations are illustrated in Figure 4. The larger side chain of Ile32 added two hydrophobic interactions with the P2 Asn group of SQV-A in PR1M, whereas both Ile47 and Val47 formed hydrophobic contacts with the P2 group [Fig. 4(A)]. Slight differences were seen in the other subunit resulting in one less hydrophobic contact of Ile32′ with the t-butyl group at P2′ of SQV-A in the mutant compared to the wild-type PR [Fig. 4(B)]. Ile82 in PR1M formed more contacts with the P1′ decahydroisoquinoline ring compared to Val82 in PR1 [Fig. 4(C)]. In the other subunit, the methyl of the Ile82′ has shifted to make van der Waals contacts with the benzene ring at P1 of the second SQV-B [Fig. 3(D)]. The quinoline ring of SQV-A adjusted by about 15 degrees rotation to fit the SQV-B molecule. Pro81′ had shifted to interact with the P3 group of SQV-B while retaining hydrophobic contacts with the P1 and P3 groups of SQV-A [Fig. 4(D)]. Overall, the structural adjustment of the triple mutant to accommodate inhibitor binding was consistent with the similar inhibition constants observed for PR1M and PR1 with SQV of 0.24 and 0.11 nM, respectively.
Figure 4.
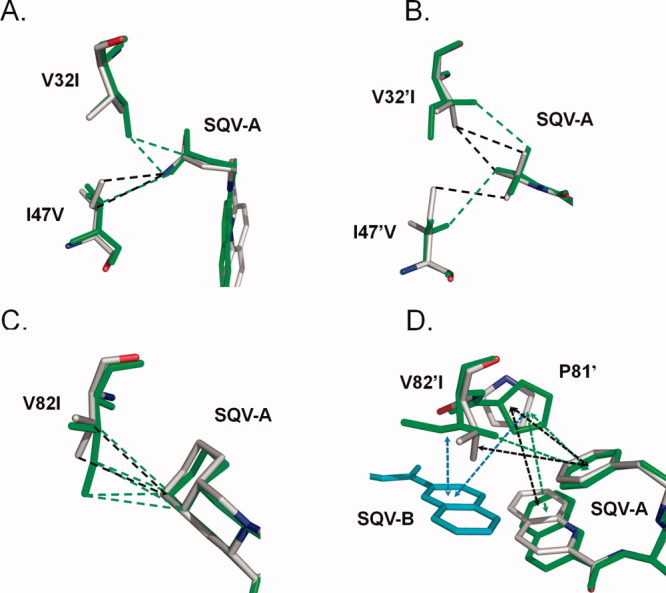
Comparison of PR1 and PR1M interactions with SQV. The PR1 structure is colored by atom type, while that of the triple mutant is shown in green bonds. Only the major conformation is shown for SQV and protein residues with alternate conformation in the PR1-SQV structure. SQV-A is the molecule bound in the regular active site cavity. Hydrophobic interactions (distances of 3.3–4.2 Å between non-hydrogen atoms) are indicated as dashed lines. Interactions with aromatic groups (CH…π) are indicated by dashed arrows. (A) Residues 32 and 47 of subunit A; (B) Residues 32′ and 47′ of subunit B; (C) Residue 82; (D) Residue 82′. SQV-B (cyan bonds) indicates the extra SQV molecule. [Color figure can be viewed in the online issue, which is available at wileyonlinelibrary.com.]
DRV complexes with PR1M, PR1, and PR2
DRV was bound in the active site cavity of PR1M in two alternate conformations with relative occupancy of 0.55/0.45 in the active site cavity. This structure was very similar to that of wild type PR1-DRV in the same space group with an overall RMSD on Cα atoms of only 0.16 Å. The PR1M-DRV complex superimposed on PR2-DRV (space group C2) with RMSD value of 1.1 Å, due to a large shift of 5–6 Å around residues 38–40 and 38′–40′, as described for comparison of the PR1-DRV and PR2-DRV crystal structures.12 Notably, the PR2-DRV crystal structure contained zinc ions and imidazole from the crystallization solution, although these solvent molecules were not close to the regions with large deviations.
The PR-DRV hydrogen bond interactions were essentially identical in the three enzymes. The minor exception was a slightly longer (3.4–3.5 Å) hydrogen bond interaction between one bis-THF oxygen of DRV and the amide of Asp30′ in PR1M compared with distances of 3.1–3.3 Å in the other structures. Structural changes at the mutation sites are illustrated in Figure 5. Only the major conformation of DRV is shown for PR1-DRV. Ile32 and 32′ in PR1M had alternate conformations of the side chains with relative occupancies of 0.6/0.4 and 0.5/0.5, respectively. The side chains of Val32 and the minor conformation of Ile32 exhibited hydrophobic interactions with the aniline ring of DRV. Val47 in PR1M had no contact with DRV, although Ile47 made two hydrophobic interactions with the aniline in PR1 [Fig. 5(A)]. In the other subunit, the minor conformation of Ile32′ in PR1M and Val32′ in PR1 formed similar hydrophobic contacts with the bis-THF group, while the side chain of Val47′ rotated to make hydrophobic contacts with the bis-THF group unlike Ile47′ of PR1 [Fig. 5(B)]. In comparison, the single mutant PRV32I-DRV25 showed similar interactions to those of the minor conformation of Ile32 in PR1M. The side chain of Ile82 rotated to form comparable hydrophobic interactions with the P1 group of DRV as seen for Val82 in PR1 [Fig. 5(C)]. Also, Ile82′ and Val82′ formed similar contacts with DRV in all structures.
Figure 5.
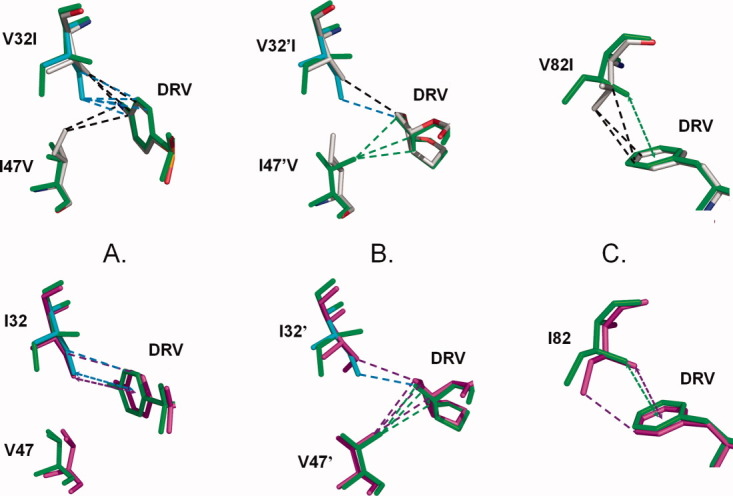
Structural comparison of DRV complexes with PR1M, PR1, and PR2. The PR1 structure is colored by atom type, PR1M is shown in green bonds with the minor conformations of Ile32 and 32′ in cyan, and PR2 is colored magenta. Only the major conformation of DRV is shown for PR1-DRV. Hydrophobic interactions are indicated as dashed lines. CH…π interactions are indicated by dashed arrows. PR1M is compared with PR1 in the upper panels and with PR2 in the lower panels. A: Residues 32 and 47 interactions with P2′ aniline of DRV; B: Residues 32′ and 47′ interactions with bis-THF at P2; and C: Residue 82 interactions with P1 of DRV. [Color figure can be viewed in the online issue, which is available at wileyonlinelibrary.com.]
In comparison of the PR2 and PR1M-DRV complexes, the side chain conformations of residues 32, 47, and 82 were preserved, except that the minor conformations of Ile32 and 32′ in the mutant most closely resembled the single conformation in PR2. Ile32 formed CH…π interactions with the aniline ring of DRV in both complexes. The majority of the hydrophobic contacts for residues 32 and 82 were essentially identical in PR1, PR2, and PR1M. Differences were observed in the DRV interactions of residue 47 [Fig. 5(B)]. Val47 had no hydrophobic interactions with the aniline of DRV in PR2 and PR1M, whereas two contacts were seen in PR1. The opposite was seen for the other subunit, where Val47′ showed three van der Waals contacts with bis-THF in PR2 and PR1M and no contacts in PR1. Overall, the slightly longer hydrogen bond interaction of the triple mutant with DRV was the only change that could help explain the 6-fold poorer inhibition of PR1M compared to PR2 and PR1.
APV complexes with PR1M, PR1, and PR2
The APV complex of PR1M was very similar in overall conformation to PR1-APV as shown by the low RMSD of 0.23 Å, whereas it had larger differences of 1.1 Å with the new structure of PR2-APV solved in the C2 space group. APV was seen in a single orientation in PR2 and PR1M, although the aniline group in PR1M-APV had two alternate conformations with an occupancy ratio of 0.6/0.4, as described for the PRV82A-DRV structure.24 Most of the PR2 and PR1M interactions with inhibitor were very similar to those of the major (0.7) occupancy conformation in the structure of PR1 with APV,18 with the exception of the interactions of the P2′ aniline group [Fig. 6(A)]. In PR2 and PR1M, Ile32 formed CH…π interactions with the aniline ring of APV, as occurred for the DRV complexes. In PR1M-APV, the major conformation of the aniline group retained the hydrogen bond interactions seen in the wild type complex with distances of 3.0–3.1 Å, however, no van der Waals contacts were formed with Val47 unlike the favorable hydrophobic interactions with Ile47 seen in the wild type PR1. The rotation of the minor conformation of the aniline restored favorable van der Waals interactions with Val47, concomitant with loss of the hydrogen bond interactions with the carbonyl oxygen and amide of Asp30 in PR1M (interatomic distances of more than 4.0 Å). In the other subunit, the THF group of APV retained van der Waals contacts with residues 32′ and 47′ in the three structures [Fig. 6(B)]. The hydrophobic interactions of Ile32 with APV are similar in PR2, PR1M and the single mutant PRV32I.18 The side chain of Ile82 formed good hydrophobic interactions with the aromatic ring of APV similar to those in the DRV complexes [Fig. 5(C)]. Residue 82′ in the other subunit showed similar hydrophobic contacts with APV in all structures, although Ile82′ is closer to APV in the PR2 complex [Fig. 6(C)]. In PR1M-APV, the most significant differences arose from the alternate conformations of the aniline ring of APV, which were accompanied by the loss of hydrophobic contacts with Val47 for the major conformation and the loss of two hydrogen bonds for the minor conformation. The loss of these interactions with APV is likely to contribute to the 15-fold weaker inhibition by APV observed for the PR1M compared with PR1.
Figure 6.
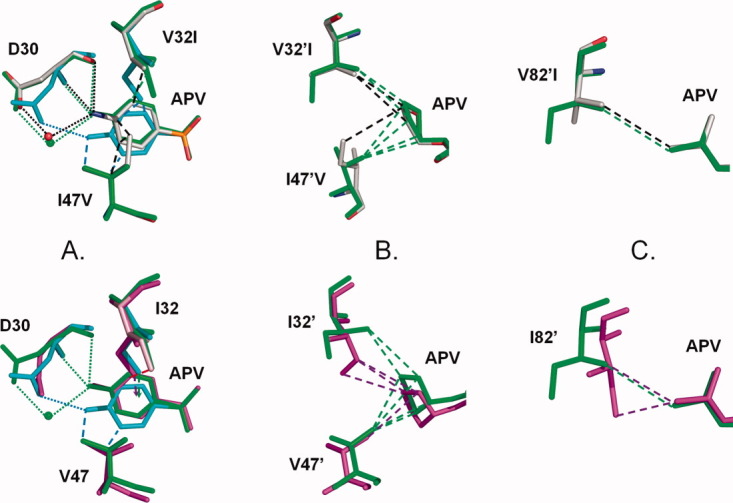
Comparison of PR1, PR2, and PR1M interactions with APV. The PR1 structure is colored by atom type, PR1M is shown in green bonds with the minor conformations of Ile32 and 32′ in cyan, and PR2 is colored magenta. Only the major (0.7 occupancy) conformation is shown for APV and PR1 residues in the wild type complex. Hydrogen bond interactions are shown as dotted lines, hydrophobic interactions are indicated as dashed lines, and CH…π interactions are indicated by dashed arrows. A: Asp30, residues 32 and 47 interactions with aniline of APV. The aniline group and Asp30 have two alternate conformations in PR1M -APV. The major conformations closely resemble the wild type structure with strong hydrogen bond interactions. The minor conformation (in cyan) has only one hydrogen bond and more hydrophobic interactions with Val47. B: Residue 32′ and 47′ interactions with the THF group of APV. C: Residue 82′ interactions with the P1′ group of APV. [Color figure can be viewed in the online issue, which is available at wileyonlinelibrary.com.]
The crystal structure of PR2-APV reveals notable changes in the hydrogen bond interactions of the aniline NH2 with Asp30 where two interatomic distances are significantly lengthened by about 0.5 Å to 3.6 and 3.7 Å (Fig. 7), which is outside of the normal range of 2.6–3.2 Å for strong hydrogen bonds.28 The elongated hydrogen bond is associated with a 1.2 Å shift of the carbonyl oxygen of Asp30 in the PR2-APV complex relative to its position in the PR1-APV complex. The altered interactions of the aniline group are consistent with the observed 19-fold weaker inhibition of PR2 relative to PR1.
Figure 7.

Hydrogen bond interactions of P2 and P2′ groups in PR1 and PR2 complexes with APV (A) and DRV (B). PR1 complexes are shown in grey and PR2 complexes in green bonds. The inhibitors are shown with Asp29 and 30. Dotted lines indicate hydrogen bonds with distances up to 3.4 Å, and broken lines indicate longer distances. The red arrow indicates the 1.2 Å shift of the carbonyl group of Asp30. [Color figure can be viewed in the online issue, which is available at wileyonlinelibrary.com.]
Discussion
Recognition and selectivity in enzyme/substrate and enzyme/inhibitor systems are a complex combination of strong local effects and weaker, but still significant, distal effects. This is clearly demonstrated in our results where the three mutations in PR1M which were chosen to mimic the inhibitor binding site of PR2 changed the specificity and inhibition from the PR1 toward the PR2 values, but did not match them exactly. The relative kcat/Km values in Table I show that the specificity of the PR1M enzyme roughly mirrors that of PR2, and the Ki values in Table II reproduce the trend seen in PR2, although the inhibition is measurably different for DRV. The biochemical similarities of PR1M and PR2 demonstrate the importance of residues 32, 47, and 82 for recognition. The differences between PR1M and PR2 are assumed to arise from distal effects due to over 50% difference in sequence (Fig. 1). Previously, differences in residues 31–37 were shown to make a major contribution to the inhibition and unusual mode of binding of a tripeptide analog in studies of chimeric enzymes.17 In fact, residues 33–44 vary in sequence and conformation among different groups and subtypes of PR1 although little effect on inhibition has been reported.29–31
Structurally, PR1M resembles PR1 more than PR2. However, PR1M and PR2 share very similar side chain conformations for Ile32, Val47, and Ile82 reflecting the importance of local effects for recognition. Our crystallographic analysis of the weak inhibitor APV with PR2 and the PR1M mutant representing the inhibitor binding site of PR2 helps explain the lower antiviral effectiveness of APV in HIV-2 infections compared to DRV or SQV. DRV and APV are chemically related and differ only in their P2 groups [Fig. 1(C)]. The bis-THF P2 group of DRV bears two oxygens and forms four hydrogen bonds with Asp29′ and Asp30′, while the THF group in APV forms only two hydrogen bonds24(Fig. 7). Despite these differences, the P2 groups of APV and DRV retain similar interactions in PR1 and PR2. In contrast, the P2′ group at the opposite end of DRV maintains similar interactions in the enzymes, whereas the identical P2′ aniline of APV shows differences [Figs. 6(A) and 7]. The altered interactions of the P2′ aniline group of APV appear to reflect less stable anchoring of the P2 THF group relative to the larger bis-THF of DRV in the binding sites of PR1 and PR2
These new structures show how drug resistant mutations of V32I, I47V, and V82I can alter the interactions with the P2 and P2′ groups of inhibitors. The diminished interactions of APV with Asp30 and Val47 in PR1M and PR2 are consistent with the observed 15- and 19-fold weaker inhibition, respectively, relative to PR1, and provide a structural explanation for the low antiviral potency on HIV-2 infections. In contrast, few structural changes were apparent for DRV and SQV complexes consistent with their sub-nanomolar inhibition of both enzymes and equivalent antiviral potency on HIV-1 and −2.3 Therefore, this analysis suggests a strategy for improved inhibitors of HIV-2 and drug resistant HIV-1 by introducing P2 or P2′ groups with enhanced interactions in the S2 and S2′ subsites.
Materials and Methods
Preparation of proteases
The optimized HIV-1 PR clone with mutations Q7K, L33I, and L63I to diminish the autoproteolysis of the PR1, as well as mutations C67A and C95A to prevent cysteine-thiol oxidation was used as the initial template for adding mutations.32 This optimized PR1 had almost identical kinetic parameters and stability as the mature PR. Plasmid DNA (pET11a, Novagen, Gibbstown, NJ) encoding PR1 was utilized to construct mutant PR1M with substitutions V32I/I47V/V82I by the Quick-Change mutagenesis kit (Stratagene, Santa Clara, CA). The PR1M mutant was expressed in Escherichia coli BL21 (DE3) and the protein was purified from inclusion bodies as described.33 The presence of the appropriate mutations was confirmed by DNA sequencing. PR2 was prepared as described.34
Enzyme kinetic assays
Assays were performed at 37°C using purified PRs and chemically synthesized oligopeptides. The reaction was initiated by the mixing of 5 μL (0.05–8 μM) purified wild-type or mutant PR with 10 μL incubation buffer [0.5 m potassium phosphate buffer, pH 5.6, containing 10% glycerol, 2 mM ethylenediaminetetraacetic acid (EDTA), 10 mM dithiothreitol, 4 m NaCl] and 5 μL 0.5–7 mM substrate. The reaction mixture was incubated at 37°C for 1 h and terminated by the addition of 180 μL 1% trifluoroacetic acid. Substrates and the cleavage products were separated using a reversed-phase HPLC (High-performance liquid chromatography) method described previously.32 Kinetic parameters were determined by fitting the data obtained at less than 20% substrate hydrolysis to the Michaelis–Menten equation using SigmaPlot 8.02 (San Jose, CA). The standard errors of the kinetic parameters were below 20%.
Active site titration of PR with SQV, APV, and DRV
The amount of active and correctly folded enzyme used in the assays was determined by active site titration using the PR1 inhibitor DRV. Active site titrations were performed by using the HPLC method with substrate VSQLYPIVQ (peptide 4) as described,35 except that 0.2 μL aliquot of the inhibitor (0–10 μM in dimethylsulfoxide) was added to the reaction mixture. Ki values were obtained from the IC50 values estimated from an inhibitor dose-response curve using the equation Ki = (IC50−[E]/2)/(1 + [S]/Km), where [E] and [S] are the PR and substrate concentrations, respectively.36
Crystallographic analysis
Crystals were grown at room temperature by the hanging drop vapor diffusion method. The protein (about 3.5 mg/mL) was preincubated with the clinical inhibitors at a molar ratio of 1:5. Each crystallization drop contained 1 μL protein and 1 μL reservoir solution. Crystals of suitable size for diffraction were obtained within 1 week. PR2-APV crystals grew from 1.5 m NaCl with 0.6 m imidazole/0.12 m zinc acetate buffer at pH 6. For PR1M-SQV, 0.1 m sodium acetate buffer, pH 5.0, 0.4 m potassium chloride as precipitant; for PR1M-APV, 0.1 m sodium citrate, phosphate buffer, pH 5.4, 4% dimethyl sulfoxide (DMSO) and 0.175 m potassium iodine as precipitant; For PR1M-DRV, the crystal was grown from 0.1 m sodium acetate buffer, pH 4.6 and 2M NaCl as precipitant. Crystals were cryo-cooled in liquid nitrogen after soaking in 30% glycerol to prevent freezing.
X-ray diffraction data for all the complexes were collected on the SER-CAT 22ID beamline of the Advanced Photon Source, Argonne National Laboratory (Argonne, IL). Data were processed using HKL-2000.37 The structures were solved by molecular replacement based on our published structures: PR2-DRV (3EBZ), PR1-SQV (2NMW), PRD30N-GRL98065 (2QCI), and PR1-DRV (2IEN) using AMoRe38 in CCP4i.39, 40 The lowest resolution structure of PR1M-SQV was refined using Refmac5 and isotropic B factors.41 The other structures were refined by SHELX-97.42 Structures were refitted using O43 and COOT.44 Alternate conformations for residues were modeled according to the electron density maps. Anisotropic B factors were refined and hydrogen atom positions were included in the last stage of refinement for the structures at better than 1.5 Å resolution. Structural figures were made using Bobscript45, 46 and PyMOL.47
Protein data bank accession numbers
The atomic coordinates and structure factors were deposited in the Protein Data Bank with accession codes: 3S56 for PR1M-SQV, 3S54 for PR1M-DRV (P21212), 3S43 for PR1M-APV, and 3S45 for PR2-APV.
Acknowledgments
This research was authored, in whole or in part, by National Institutes of Health staff. This research was supported, in whole or in part, by the Hungarian Science and Research Fund (OTKA K68288, K101591), the Intramural Research Program of the NIDDK, National Institutes of Health (NIH), Intramural AIDS-Targeted Antiviral Program of the Office of the Director, NIH, and grants GM062920 (ITW) and GM53386 (AKG) from the NIH. The authors thank the staff at the SER-CAT beamline at the Advanced Photon Source, Argonne National Laboratory, for assistance during X-ray data collection. Use of the Advanced Photon Source was supported by the US Department of Energy, Office of Science, Office of Basic Energy Sciences, under Contract No. W-31-109-Eng-38.
Glossary
Abbreviations:
- AIDS
acquired immunodeficiency syndrome
- APV
amprenavir
- DRV
darunavir
- HAART
Highly Active Antiretroviral Therapy
- HIV-1
human immunodeficiency virus type 1
- HIV-2
human immunodeficiency virus type 2
- IDV
indinavir
- PI
protease inhibitor
- PR
HIV protease
- PR1
HIV-1 protease
- PR1M
HIV-1 protease with V32I, I47V and V82I mutations
- PR2
HIV-2 protease
- RMSD
root mean square deviation
- SQV
saquinavir
- THF
tetrahydrofuran
References
- 1.AIDS at 30: Nations at the crossroads. Geneva, Switzerland: 2011. http://www.unaids.org. [Google Scholar]
- 2.Peterson K, Jallow S, Rowland-Jones SL, de Silva TI. Antiretroviral therapy for HIV-2 infection: recommendations for management in low-resource settings. AIDS Res Treat. 2011;2011:463704. doi: 10.1155/2011/463704. [DOI] [PMC free article] [PubMed] [Google Scholar]
- 3.Menendez-Arias L, Tozser J. HIV-1 protease inhibitors: effects on HIV-2 replication and resistance. Trends Pharmacol Sci. 2008;29:42–49. doi: 10.1016/j.tips.2007.10.013. [DOI] [PubMed] [Google Scholar]
- 4.Bock PJ, Markovitz DM. Infection with HIV-2. AIDS. 2001;15(Suppl 5):S35–S45. doi: 10.1097/00002030-200100005-00006. [DOI] [PubMed] [Google Scholar]
- 5.Barin F, Cazein F, Lot F, Pillonel J, Brunet S, Thierry D, Damond F, Brun-Vezinet F, Desenclos JC, Semaille C. Prevalence of HIV-2 and HIV-1 group O infections among new HIV diagnoses in France: 2003–2006. AIDS. 2007;21:2351–2353. doi: 10.1097/QAD.0b013e3282f15637. [DOI] [PubMed] [Google Scholar]
- 6.Maniar JK, Damond F, Kamath RR, Mandalia S, Surjushe A. Antiretroviral drug-resistant HIV-2 infection—a new therapeutic dilemma. Int J STD AIDS. 2006;17:781–782. doi: 10.1258/095646206778691059. [DOI] [PubMed] [Google Scholar]
- 7.Louis JM, Weber IT, Tozser J, Clore GM, Gronenborn AM. HIV-1 protease: maturation, enzyme specificity, and drug resistance. Adv Pharmacol. 2000;49:111–146. doi: 10.1016/s1054-3589(00)49025-3. [DOI] [PubMed] [Google Scholar]
- 8.Berman HM, Westbrook J, Feng Z, Gilliland G, Bhat TN, Weissig H, Shindyalov IN, Bourne PE. The Protein Data Bank. Nucleic Acids Res. 2000;28:235–242. doi: 10.1093/nar/28.1.235. [DOI] [PMC free article] [PubMed] [Google Scholar]
- 9.Brower ET, Bacha UM, Kawasaki Y, Freire E. Inhibition of HIV-2 protease by HIV-1 protease inhibitors in clinical use. Chem Biol Drug Des. 2008;71:298–305. doi: 10.1111/j.1747-0285.2008.00647.x. [DOI] [PubMed] [Google Scholar]
- 10.Gustchina A, Weber IT. Comparative analysis of the sequences and structures of HIV-1 and HIV-2 proteases. Proteins. 1991;10:325–339. doi: 10.1002/prot.340100406. [DOI] [PubMed] [Google Scholar]
- 11.Chen Z, Li Y, Chen E, Hall DL, Darke PL, Culberson C, Shafer JA, Kuo LC. Crystal structure at 1.9-A resolution of human immunodeficiency virus (HIV) II protease complexed with L-735,524, an orally bioavailable inhibitor of the HIV proteases. J Biol Chem. 1994;269:26344–26348. [PubMed] [Google Scholar]
- 12.Kovalevsky AY, Louis JM, Aniana A, Ghosh AK, Weber IT. Structural evidence for effectiveness of darunavir and two related antiviral inhibitors against HIV-2 protease. J Mol Biol. 2008;384:178–192. doi: 10.1016/j.jmb.2008.09.031. [DOI] [PMC free article] [PubMed] [Google Scholar]
- 13.Tozser J, Weber IT, Gustchina A, Blaha I, Copeland TD, Louis JM, Oroszlan S. Kinetic and modeling studies of S3–S3′ subsites of HIV proteinases. Biochemistry. 1992;31:4793–4800. doi: 10.1021/bi00135a008. [DOI] [PubMed] [Google Scholar]
- 14.Bagossi P, Sperka T, Feher A, Kadas J, Zahuczky G, Miklossy G, Boross P, Tozser J. Amino acid preferences for a critical substrate binding subsite of retroviral proteases in type 1 cleavage sites. J Virol. 2005;79:4213–4218. doi: 10.1128/JVI.79.7.4213-4218.2005. [DOI] [PMC free article] [PubMed] [Google Scholar]
- 15.Johnson VA, Brun-Vezinet F, Clotet B, Gunthard HF, Kuritzkes DR, Pillay D, Schapiro JM, Richman DD. Update of the drug resistance mutations in HIV-1: December 2010. Top HIV Med. 2010;18:156–163. [PubMed] [Google Scholar]
- 16.Hoog SS, Towler EM, Zhao B, Doyle ML, Debouck C, Abdel-Meguid SS. Human immunodeficiency virus protease ligand specificity conferred by residues outside of the active site cavity. Biochemistry. 1996;35:10279–10286. doi: 10.1021/bi960179j. [DOI] [PubMed] [Google Scholar]
- 17.Swairjo MA, Towler EM, Debouck C, Abdel-Meguid SS. Structural role of the 30′s loop in determining the ligand specificity of the human immunodeficiency virus protease. Biochemistry. 1998;37:10928–10936. doi: 10.1021/bi980784h. [DOI] [PubMed] [Google Scholar]
- 18.Shen CH, Wang YF, Kovalevsky AY, Harrison RW, Weber IT. Amprenavir complexes with HIV-1 protease and its drug-resistant mutants altering hydrophobic clusters. FEBS J. 2010;277:3699–3714. doi: 10.1111/j.1742-4658.2010.07771.x. [DOI] [PMC free article] [PubMed] [Google Scholar]
- 19.Desbois D, Roquebert B, Peytavin G, Damond F, Collin G, Benard A, Campa P, Matheron S, Chene G, Brun-Vezinet F, Descamps D. In vitro phenotypic susceptibility of human immunodeficiency virus type 2 clinical isolates to protease inhibitors. Antimicrob Agents Chemother. 2008;52:1545–1548. doi: 10.1128/AAC.01284-07. [DOI] [PMC free article] [PubMed] [Google Scholar]
- 20.Witvrouw M, Pannecouque C, Switzer WM, Folks TM, De Clercq E, Heneine W. Susceptibility of HIV-2, SIV and SHIV to various anti-HIV-1 compounds: implications for treatment and postexposure prophylaxis. Antivir Ther. 2004;9:57–65. [PubMed] [Google Scholar]
- 21.Rodes B, Sheldon J, Toro C, Jimenez V, Alvarez MA, Soriano V. Susceptibility to protease inhibitors in HIV-2 primary isolates from patients failing antiretroviral therapy. J Antimicrob Chemother. 2006;57:709–713. doi: 10.1093/jac/dkl034. [DOI] [PubMed] [Google Scholar]
- 22.Ntemgwa M, Brenner BG, Oliveira M, Moisi D, Wainberg MA. Natural polymorphisms in the human immunodeficiency virus type 2 protease can accelerate time to development of resistance to protease inhibitors. Antimicrob Agents Chemother. 2007;51:604–610. doi: 10.1128/AAC.00870-06. [DOI] [PMC free article] [PubMed] [Google Scholar]
- 23.Eizert H, Bander P, Bagossi P, Sperka T, Miklossy G, Boross P, Weber IT, Tozser J. Amino acid preferences of retroviral proteases for amino-terminal positions in a type 1 cleavage site. J Virol. 2008;82:10111–10117. doi: 10.1128/JVI.00418-08. [DOI] [PMC free article] [PubMed] [Google Scholar]
- 24.Tie Y, Boross PI, Wang YF, Gaddis L, Hussain AK, Leshchenko S, Ghosh AK, Louis JM, Harrison RW, Weber IT. High resolution crystal structures of HIV-1 protease with a potent non-peptide inhibitor (UIC-94017) active against multi-drug-resistant clinical strains. J Mol Biol. 2004;338:341–352. doi: 10.1016/j.jmb.2004.02.052. [DOI] [PubMed] [Google Scholar]
- 25.Kovalevsky AY, Liu F, Leshchenko S, Ghosh AK, Louis JM, Harrison RW, Weber IT. Ultra-high resolution crystal structure of HIV-1 protease mutant reveals two binding sites for clinical inhibitor TMC114. J Mol Biol. 2006;363:161–173. doi: 10.1016/j.jmb.2006.08.007. [DOI] [PMC free article] [PubMed] [Google Scholar]
- 26.Tie Y, Kovalevsky AY, Boross P, Wang YF, Ghosh AK, Tozser J, Harrison RW, Weber IT. Atomic resolution crystal structures of HIV-1 protease and mutants V82A and I84V with saquinavir. Proteins. 2007;67:232–242. doi: 10.1002/prot.21304. [DOI] [PubMed] [Google Scholar]
- 27.Louis JM, Zhang Y, Sayer JM, Wang YF, Harrison RW, Weber IT. The L76V drug resistance mutation decreases the dimer stability and rate of autoprocessing of HIV-1 protease by reducing internal hydrophobic contacts. Biochemistry. 2011;50:4786–95. doi: 10.1021/bi200033z. [DOI] [PMC free article] [PubMed] [Google Scholar]
- 28.Sarkhel S, Desiraju GR. N–H…O, O–H…O, and C–H…O hydrogen bonds in protein-ligand complexes: strong and weak interactions in molecular recognition. Proteins. 2004;54:247–259. doi: 10.1002/prot.10567. [DOI] [PubMed] [Google Scholar]
- 29.Sayer JM, Agniswamy J, Weber IT, Louis JM. Autocatalytic maturation, physical/chemical properties, and crystal structure of group N HIV-1 protease: relevance to drug resistance. Protein Sci. 2010;19:2055–2072. doi: 10.1002/pro.486. [DOI] [PMC free article] [PubMed] [Google Scholar]
- 30.Vergne L, Peeters M, Mpoudi-Ngole E, Bourgeois A, Liegeois F, Toure-Kane C, Mboup S, Mulanga-Kabeya C, Saman E, Jourdan J, Reynes J, Delaporte E. Genetic diversity of protease and reverse transcriptase sequences in non-subtype-B human immunodeficiency virus type 1 strains: evidence of many minor drug resistance mutations in treatment-naive patients. J Clin Microbiol. 2000;38:3919–3925. doi: 10.1128/jcm.38.11.3919-3925.2000. [DOI] [PMC free article] [PubMed] [Google Scholar]
- 31.Sanches M, Krauchenco S, Martins NH, Gustchina A, Wlodawer A, Polikarpov I. Structural characterization of B and non-B subtypes of HIV-protease: insights into the natural susceptibility to drug resistance development. J Mol Biol. 2007;369:1029–1040. doi: 10.1016/j.jmb.2007.03.049. [DOI] [PubMed] [Google Scholar]
- 32.Louis JM, Clore GM, Gronenborn AM. Autoprocessing of HIV-1 protease is tightly coupled to protein folding. Nat Struct Biol. 1999;6:868–875. doi: 10.1038/12327. [DOI] [PubMed] [Google Scholar]
- 33.Mahalingam B, Louis JM, Hung J, Harrison RW, Weber IT. Structural implications of drug-resistant mutants of HIV-1 protease: high-resolution crystal structures of the mutant protease/substrate analogue complexes. Proteins. 2001;43:455–464. doi: 10.1002/prot.1057. [DOI] [PubMed] [Google Scholar]
- 34.Louis JM, Ishima R, Aniana A, Sayer JM. Revealing the dimer dissociation and existence of a folded monomer of the mature HIV-2 protease. Protein Sci. 2009;18:2442–2453. doi: 10.1002/pro.261. [DOI] [PMC free article] [PubMed] [Google Scholar]
- 35.Tozser J, Blaha I, Copeland TD, Wondrak EM, Oroszlan S. Comparison of the HIV-1 and HIV-2 proteinases using oligopeptide substrates representing cleavage sites in Gag and Gag-Pol polyproteins. FEBS Lett. 1991a;281:77–80. doi: 10.1016/0014-5793(91)80362-7. [DOI] [PubMed] [Google Scholar]
- 36.Maibaum J, Rich DH. Inhibition of porcine pepsin by two substrate analogues containing statine: the effect of histidine at the P2 subsite on the inhibition of aspartic proteinases. J Med Chem. 1988;31:625–629. doi: 10.1021/jm00398a022. [DOI] [PubMed] [Google Scholar]
- 37.Otwinowski Z, Minor W. Processing of X-ray diffraction data in oscillation mode. Methods Enzymology. 1997;276:307–326. doi: 10.1016/S0076-6879(97)76066-X. [DOI] [PubMed] [Google Scholar]
- 38.Navaza J. A MoRe: an Automated Package for Molecular Replacement. Acta Crystallogr Sect A. 1994;50:157–163. [Google Scholar]
- 39.Collaborative Computational Project N. The CCP4 suite: programs for protein crystallography. Acta Cryst D. 1994;50:760–763. doi: 10.1107/S0907444994003112. [DOI] [PubMed] [Google Scholar]
- 40.Potterton E, Briggs P, Turkenburg M, Dodson EA. Graphical user interface to the CCP4 program suite. Acta Cryst D. 2003;59:1131–1137. doi: 10.1107/s0907444903008126. [DOI] [PubMed] [Google Scholar]
- 41.Murshudov GN, Vagin AA, Dodson EJ. Refinement of macromolecular structures by the maximum-likelihood method. Acta Crystallogr D. 1997;53:240–255. doi: 10.1107/S0907444996012255. [DOI] [PubMed] [Google Scholar]
- 42.Sheldrick GM. A short history of SHELX. Acta Crystallogr A. 2008;64:112–122. doi: 10.1107/S0108767307043930. [DOI] [PubMed] [Google Scholar]
- 43.Jones TA. Interactive electron-density map interpretation: from INTER to O. Acta Crystallogr D Biol Crystallogr. 2004;60:2115–2125. doi: 10.1107/S0907444904023509. [DOI] [PubMed] [Google Scholar]
- 44.Emsley P, Lohkamp B, Scott WG, Cowtan K. Features and development of Coot. Acta Crystallogr D Biol Crystallogr. 2010;66:486–501. doi: 10.1107/S0907444910007493. [DOI] [PMC free article] [PubMed] [Google Scholar]
- 45.Esnouf RM. An extensively modified version of MolScript that includes greatly enhanced coloring capabilities. J Mol Graph Model. 1997;15:132–134. doi: 10.1016/S1093-3263(97)00021-1. [DOI] [PubMed] [Google Scholar]
- 46.Esnouf RM. Further additions to MolScript version 1.4, including reading and contouring of electron-density maps. Acta Cryst. 1999;D55:938–940. doi: 10.1107/s0907444998017363. [DOI] [PubMed] [Google Scholar]
- 47.DeLano WL. The PyMOL Molecular Graphics System. 2002. http://www.pymol.org.
- 48.Tozser J, Gustchina A, Weber IT, Blaha I, Wondrak EM, Oroszlan S. Studies on the role of the S4 substrate binding site of HIV proteinases. FEBS Lett. 1991b;279:356–360. doi: 10.1016/0014-5793(91)80186-7. [DOI] [PubMed] [Google Scholar]