

Background: Intracellular NAD+ levels ([NAD+]i) regulate important cell functions.
Results: Lowering the [NAD+]i decreases, and increasing [NAD+]i enhances replenishment of ER Ca2+ stores, mitogen-induced [Ca2+]i increase, and functional responses in T cells through gating of TRPM2 by CD38-generated ADPR.
Conclusion: [NAD+]i regulates Ca2+ homeostasis and immune responses in T cells.
Significance: Strategies aimed at increasing [NAD+]i in T lymphocytes can potentiate immune responses.
Keywords: Calcium, Cd38, Lymphocyte, NAD, TRP Channels
Abstract
Intracellular NAD+ levels ([NAD+]i) are important in regulating human T lymphocyte survival, cytokine secretion, and the capacity to respond to antigenic stimuli. NAD+-derived Ca2+-mobilizing second messengers, produced by CD38, play a pivotal role in T cell activation.
Here we demonstrate that [NAD+]i modifications in T lymphocytes affect intracellular Ca2+ homeostasis both in terms of mitogen-induced [Ca2+]i increase and of endoplasmic reticulum Ca2+ store replenishment. Lowering [NAD+]i by FK866-mediated nicotinamide phosphoribosyltransferase inhibition decreased the mitogen-induced [Ca2+]i rise in Jurkat cells and in activated T lymphocytes. Accordingly, the Ca2+ content of thapsigargin-sensitive Ca2+ stores was greatly reduced in these cells in the presence of FK866. When NAD+ levels were increased by supplementing peripheral blood lymphocytes with the NAD+ precursors nicotinamide, nicotinic acid, or nicotinamide mononucleotide, the Ca2+ content of thapsigargin-sensitive Ca2+ stores as well as cell responsiveness to mitogens in terms of [Ca2+]i elevation were up-regulated. The use of specific siRNA showed that the changes of Ca2+ homeostasis induced by NAD+ precursors are mediated by CD38 and the consequent ADPR-mediated TRPM2 gating. Finally, the presence of NAD+ precursors up-regulated important T cell functions, such as proliferation and IL-2 release in response to mitogens.
Introduction
Nicotinamide phosphoribosyltransferase (Nampt)3 is the rate-limiting enzyme in the salvage pathway of NAD+ biosynthesis from nicotinamide (NAM) in human cells (1–3). Using NAM and 5-phosphoribosyl-1-pyrophosphate as substrates, Nampt catalyzes the synthesis of nicotinamide mononucleotide (NMN) and inorganic pyrophosphate. In the next step NAD+ generation is catalyzed by NMN-adenylyltransferases starting from NMN and ATP (4).
Nampt-mediated NAD+ biosynthesis appears to be especially important in immune cells, as shown by several lines of evidence. Nampt is up-regulated in T lymphocytes upon encounter with activating stimuli (5–8). Selective Nampt disruption, obtained by generating a mouse strain expressing a conditional Nampt allele in the lymphocyte lineage, results in an early arrest of thymocyte development and in the absence of mature T and B cells from peripheral lymphoid organs (9). In addition, pharmacological Nampt inhibition with FK866 is associated with lymphopenia in patients (10). In activated T lymphocytes, the functional consequences of Nampt inhibition by FK866 are exacerbated by the concomitant activation of NAD+ degrading enzymes, such as poly(ADP-ribose) polymerase (11). Hence, in these cells, massive NAD+ depletion, mitochondrial proton gradient (ΔΨm) dissipation, ATP shortage, and autophagic cell demise eventually result from protracted Nampt inhibition (11). In addition to being required for T cell survival, intracellular NAD+ appears to promote cytokine secretion, as already reported for TNF-α and IFN-γ (11, 12). In line with its effect on activated human T lymphocytes, FK866 reduces the clinical severity of experimental autoimmune encephalomyelitis, a prototypical model of T-cell mediated autoimmune disorder (11).
In addition to the salvage pathway from NAM, NAD+ synthesis in T lymphocytes can also take place starting from nicotinic acid (NA), which is substrate of the enzyme nicotinic acid phosphoribosyltransferase (Naprt1). This enzyme is present in human peripheral blood lymphocytes (PBLs) and, similarly to Nampt, is up-regulated in response to mitogenic stimulation (11, 13). Indeed, the addition of either NAM or NA rescues the NAD+ depletion caused by FK866 in human PBLs (11). Altogether, the strong increase in Nampt and Naprt1 levels in activated T lymphocytes (5–8, 11) and the fact that Nampt inhibition by FK866 negatively affects T cell function and survival (11) indicate that NAD+ availability is critically important for the capacity of human T lymphocytes to respond to antigenic stimuli. Accordingly, strategies aimed at lowering NAD+ levels have been proposed to treat immune disorders (11, 14).
The mechanisms through which NAD+ levels affect T cell function are complex, but NAD+-dependent signal transduction is likely one of the most relevant. NAD+-derived nucleotides and the activation of the signal transduction machinery that follows their generation play a pivotal role in T cell activation (15–17). The multifunctional ectoenzyme CD38 catalyzes the synthesis, starting from NAD+, of the calcium-mobilizing second messengers cyclic ADP-ribose (cADPR) and ADP-ribose (ADPR). The products of the CD38-catalyzed reactions regulate Ca2+ signal transduction in cell types as diverse as sea urchin oocytes and mammalian cells (17–20). It is well established that the control of intracellular free Ca2+ concentration ([Ca2+]i) is crucially important for the regulation of many immune cell functions, including proliferation, cytokine production, cell death, and apoptosis (21–27).
cADPR induces Ca2+ mobilization from ryanodine receptor-gated Ca2+ stores in the endoplasmic reticulum (ER), and at least in some cell types, it elicits extracellular Ca2+ influx (17, 19). ADPR activates TRPM2, a non-selective, Ca2+-permeable cation channel of the melastatin-related transient receptor potential (TRPM) ion channel subfamily by binding to the cytoplasmic NUDT9 domain (28).
In this study we investigated whether modifications of NAD+ levels in T lymphocytes would affect the intracellular Ca2+ homeostasis both in terms of mitogen-induced [Ca2+]i increase and of the state of ER calcium store replenishment. Intracellular NAD+ levels were lowered in these cells by FK866-mediated Nampt inhibition. Alternatively, NAD+ levels were increased by supplementing cells with the NAD+ precursors NAM, NA, and NMN.
EXPERIMENTAL PROCEDURES
Materials
FURA-2AM and Fluo-3AM were obtained from Calbiochem. FK866 was generously provided by the NIMH Chemical Synthesis and Drug Supply Program. [14C]NAD+ was obtained from Amersham Biosciences. 8-Br-ADPR was purchased from BioLog (Bremen, Germany). Coelenterazine n was obtained from ANASPEC (Fremont, CA). All other chemicals were obtained from Sigma.
PBL Isolation
Buffy coats, prepared from blood of healthy human volunteers and obtained from Galliera Hospital, Genova, Italy, were diluted with an equal volume of phosphate-buffered saline. Peripheral blood mononuclear cells were isolated by density centrifugation over Ficoll-Paque Plus (GE Healthcare), and contaminating erythrocytes were lysed by resuspending cells for a few minutes in the lysing buffer (0.3 m NH4Cl and 20 mm KHCO3). Peripheral blood mononuclear cells were resuspended in RPMI 1640, supplemented with 100 units/ml penicillin and 0.1 mg/ml streptomycin, and then cultured for 4 h. Non adherent (i.e. monocyte-depleted) PBLs (>70% CD3+ T cells) were recovered, resuspended at 2 × 10⁶ cells/ml in RPMI 1640 supplemented with 100 units/ml penicillin, 0.1 mg/ml streptomycin, and 10% FBS (complete medium) and used for subsequent experiments. Nicotinamide is present in RPMI 1640 medium at a 8 μm final concentration.
Cell Culture
The Jurkat T cell leukemia cell line was obtained from ATCC (LGC Standards s.r.l. Milano, Italy). Cells were grown in complete medium. The Bcl-2 overexpressing Jurkat cells and the control cells transfected with the empty vector were a gift of Dr. Claus Belka (Ludwig Maximilians Universität München, Department of Radiation Oncology, Munich, Germany) (29).
Viability Assays
PBL viability was determined as described in Bruzzone et al. (11) by propidium iodide staining and flow cytometry (FACS Calibur, BD Biosciences).
Fluorimetric Determination of Intracellular Calcium Levels
PBL or Jurkat cells (2 × 10⁶/ml), stimulated or not with phytohemagglutinin (PHA) (5 μg/ml) and/or treated for 24 h in the presence or absence of 33 nm FK866 or 0.1 mm NAM, NA, or NMN, were loaded with 10 μm FLUO-3AM or Fura-2AM for 45 min at 37 °C in RPMI medium, washed with Ca2+-containing Hanks' balanced salt solution (HBSS), and resuspended in the same solution at 2 × 10⁶ cells/ml. Alternatively, in some experiments, cells were washed and resuspended in Ca2+-free HBSS before thapsigargin (TG) addition. [Ca2+]i measurements with Fluo-3-loaded cells were performed in 96-well plates (105 cells/well). The basal fluorescence (excitation, 485 nm; emission, 520 nm) was adjusted to have a comparable (within a ±10% range) basal intensity in each well. Fluorescence was measured every 3 s with a fluorescence plate reader (Fluostar Optima, BMG Labtechnologies GmbH, Offenburg, Germany). The intensity of emitted light was plotted as a function of time. Calcium changes were calculated for each trace using the formula Δ/basal × 100, where Δ is the difference between the maximal fluorescence upon the addition of stimulus and the basal fluorescence (basal), normalized to the basal fluorescence (basal).
Fura-2-loaded cells were seeded on poly-l-lysine-coated, glass bottom, cell culture dish (Greiner Bio-One, Frickenhausen, Germany) and incubated for 20 min at 37 °C. [Ca2+]i measurements and calibrations were performed with a microfluorimetric system (Cairn Research, Faversham, Kent, UK).
Determination of Intracellular NAD+ and cADPR Levels
PBL or Jurkat cells were cultured as described above for 24 h and stimulated or not with PHA (5 μg/ml) in the presence or absence of FK866 (33 nm), NAM (0.1, 1, or 10 mm), NA (0.1 mm), or NMN (0.1 mm). At the end of each incubation, 1 ml of cells were withdrawn and centrifuged for 15 s at 16,000 × g. Cell pellets were lysed in 0.3 ml of 0.6 m perchloric acid at 4 °C. Cell extracts were centrifuged for 3 min at 16000 × g; the supernatants were collected, and an aliquot was diluted 200-fold in 100 mm sodium phosphate buffer, pH 8.0, for determination of NAD+ content, as described (30). Perchloric acid was removed from the rest of the supernatant by mixing the aqueous sample with 4 volumes of a solution containing 1,1,2-trichlorotrifluoroethane and tri-n-octylamine, and the cADPR content was determined as described (30). NAD+ and cADPR values were normalized on protein concentrations, determined by the Bradford assay.
Determination of Intracellular ATP Content
PBLs were cultured as described above for 24 h, stimulated or not with PHA (5 μg/ml), in the presence or absence of FK866 (33 nm), NAM (0.1 mm), NA (0.1 mm), or NMN (0.1 mm). At the end of the incubation, 1 ml of cells was withdrawn and centrifuged for 15 s at 16,000 × g. Cell pellets were lysed in 0.3 ml of 0.6 m perchloric acid at 4 °C, and the neutralized extracts were analyzed by HPLC (11). ATP values were normalized on protein concentrations, determined by the Bradford assay.
Measurements of ER Ca2+ Refilling
Freshly isolated PBLs (5 × 10⁶/cuvette) were transfected with the Nucleofector system (Amaxa GmbH, Cologne, Germany) using the Nucleofector program X-005, solution V, with 4 μg of plasmid encoding for the aequorin directed to the endoplasmic reticulum (erAEQ) to measure the ER Ca2+ concentration ([Ca2+]ER) (31). After electroporation, PBLs were resuspended at 2 × 10⁶ cells/ml in complete medium and incubated in 5% CO2 at 37 °C in the presence or absence of 0.1 mm NAM or NA. Twenty-four hours after transfection, cells were incubated for 1 h at 4 °C in KRB saline solution (Krebs-Ringer modified buffer: 125 mm NaCl, 5 mm KCl, 1 mm Na3PO4, 1 mm MgSO4, 5.5 mm glucose, 20 mm HEPES, pH 7.4) supplemented with coelenterazine n (5 μm), the Ca2+ ionophore ionomycin (5 μm), and 1 mm EGTA to obtain a drastic reduction of the lumenal Ca2+. At the end of the incubation, cells were washed with KRB supplemented with 2% BSA, resuspended in KRB, and rapidly transferred into a well in a white 96-well plate (2.5 × 10⁵ cells/well) set in a luminescence plate reader (Fluostar Optima, BMG Labtechnologies GmbH). CaCl2 (5 mm final concentration) was added, and the recording was immediately started. The instrument setting was as follow: well-mode, 1.00-s measurement interval time, 1.00-s interval time).
Production and Purification of [14C]ADPR
[14C]NAD+ (1μCi/100 μl) was incubated with 0.5 milliunits/ml NAD+ase (Sigma) for 6 h. The enzyme was then removed by filtration with a multiscreen vacuum manifold using Immobilon-P membrane plates (Millipore, Bedford, MA), and the incubation was subjected to an analytical phosphate HPLC analysis performed on a C18, 150 × 4-mm, 5-μm column (Waters, Milano, Italy) using the same conditions (buffers, gradient and flow rate) as in Basile et al. (32). Fractions were collected every minute, and the radioactive fraction (eluting at the same time of standard ADPR) was collected, dried, resuspended in water, and used as tracer in the determination of intracellular ADPR content.
Determination of Intracellular ADPR Content
PBLs (30 × 106) were cultured as described above for 24 h in the presence or absence of 0.1 mm NAM, NA, or NMN. Cells were withdrawn and centrifuged for 5 min at 300 × g. Cell pellets were lysed in 0.2 ml of 5% trichloroacetic acid at 4 °C. Cell extracts were centrifuged for 3 min at 16,000 × g; and the supernatants were collected and neutralized with diethyl ether extractions. [14C]ADPR (10000 cpm) was added to the extracts, which were then injected into a first HPLC analysis; the column was a PL-SAX (50 × 4.6 mm, 8 μm; CPS Analitica, Milano, Italy), solvent A was 0.02 m NH4HCO3, pH 7.5, and solvent B was 0.5 m NH4HCO3, pH 7.5. The solvent program was a linear gradient starting at 100% A and increasing to 100% B in 30 min; flow rate was 0.5 ml/min. Fractions were collected every min, and the radioactive fraction (the ADPR elution time was 14.5 min) was dried, resuspended in 0.25 ml of water, and subjected to the analytical phosphate HPLC analysis described above (the ADPR elution time was 30 min). A representative chromatogram of each one of the two HPLC analyses is shown in Fig. 6B.
FIGURE 6.

Preincubation with NAM, NA, or NMN increases the [ADPR]i in PBLs. A, freshly isolated PBLs were incubated in the presence of 0.1 mm NAM, NA, or NMN for 24 h, and intracellular ADPR content was evaluated on cell extracts. Results are the mean ± S.D. from determinations with cells from six different subjects. The basal [ADPR]i in human PBLs was 1.08 ± 0.51 nmol/mg of protein (n = 6). B, shown are representative chromatograms of the two HPLC analyses for the quantification of ADPR in cell extracts. The circle indicates the fraction co-eluting with [14C]ADPR (added as tracer), collected, and submitted to a second HPLC analysis (see “Experimental Procedures”).
siRNA Transfection
Transient transfection of human PBLs was performed using the Nucleofector System. Freshly isolated PBLs (5 × 10⁶) were transfected using the Nucleofector program X-005, solution V, with 2 μm CD38-targeting StealthTM duplex short interference RNA (CD38-siRNA), 2 μm TRPM2-targeting StealthTM duplex short interference RNA (TRPM2-siRNA), or with 2 μm StealthTM Negative Control (control siRNA). After transfection, PBLs were resuspended in 2.5 ml complete medium and incubated in 5% CO2 at 37 °C. All experiments were performed 24 h after transfection.
The CD38- and TRPM2-targeting StealthTM siRNAs for humans (siRNA#1, CD38-HSS101578; siRNA#2, TRPM2-HSS110995) were obtained from Invitrogen; the negative control siRNA for transfection of human cells was also from Invitrogen.
Real Time PCR
Total RNA was extracted from human PBL and Jurkat cells using the RNeasy micro kit (Qiagen, Milano, Italy) according to the manufacturer's instructions and reverse transcribed into cDNA using the iScriptTM cDNA Synthesis Kit (Bio-Rad). The cDNA was used as the template for real-time PCR analysis; reactions were performed in an iQ5 real-time PCR detection system (Bio-Rad). The human specific primers were designed by using Beacon Designer 2.0 software (Bio-Rad), and their sequences were as shown in Table 1.
TABLE 1.
Human specific primers for real-time PCR analysis
| Human gene | Sequence, 5′-3′ | |
|---|---|---|
| CD38 | Forward | GGACACGCTGCTAGGCTACC |
| Reverse | CATCACATGGACCACATCACAGG | |
| TRPM2 | Forward | GTCTTCCACCTGAACATCCTCTCC |
| Reverse | CCGCATCTCCTCGCACACC | |
| GAPDH | Forward | CCTGTTCGACAGTCAGCCG |
| Reverse | CGACCAAATCCGTTGACTCC | |
Each sample was assayed in triplicate in a 25-μl amplification reaction containing 25 ng of cDNA, 0.2 μm concentrations each of sense and antisense primers, and 10 μl of 2× iQ SYBR Green Supermix Sample (Bio-Rad). The amplification program included 40 cycles of two steps, each comprising heating to 95 and to 60 °C. Fluorescent products were detected at the last step of each cycle. To verify the purity of the products, a melting curve was produced after each run. Values for human genes were normalized to GAPDH mRNA expression. Statistical analysis of the quantitative real-time PCR was obtained using the iQ5 Optical System Software Version 1.0 (Bio-Rad) based on the 2−ΔΔCt method, which calculated relative changes in gene expression of the target normalized to GAPDH. The quantitative PCR efficiencies were determined by a series of 5-fold dilutions for each experiment and each gene and were always between 90 and 95% (33, 34).
Western Blot
Jurkat or Bcl2-Jurkat cells, resting or PHA-activated PBLs were incubated (or not) with 33 nm FK866 for 24 h. Cells were then lysed in 50 mm Tris-HCl, 150 mm NaCl, 1% Nonidet P-40, pH 8, containing a mixture of protease inhibitors (lysis buffer). 15 μg of total proteins were then loaded on a 10% SDS-PAGE. The level of Bcl2 expression was determined by Western blot using the anti-Bcl2 mouse monoclonal Ab (Santa Cruz Biotechnology, Inc., Santa Cruz, CA).
Twenty-four hours after transfection with the CD38- or TRPM2-targeting siRNAs, PBLs were lysed in lysis buffer, and 15 μg of total protein were then loaded on a 10% SDS-PAGE. The level of CD38 or TRPM2 expression was determined by Western blot using the anti-CD38 mouse monoclonal Ab (Sigma) or the anti-TRPM2 polyclonal Ab (Bethyl Laboratories, Inc., Montgomery, TX), respectively.
Bioluminescence intensity of Bcl2, CD38, or TRPM2 was estimated by the Chemidoc System (Bio-Rad) and normalized in each sample to the level of actin expression (revealed with an anti-actin polyclonal Ab from Santa Cruz Biotechnology).
Proliferation Assay
Cell cultures incubated with the indicated stimuli either in the presence or absence of drugs were analyzed for the adenosine triphosphate (ATP) content with the ATPLite one step kit from PerkinElmer Life Sciences following the manufacturer's instruction. Briefly, 100 μl of cell culture were incubated with ATPLite one step solution, and luminescence was evaluated using VictorX5 (PerkinElmer Life Sciences). ATP content and luminescence were directly proportional to cell number in a given cell culture. Preliminary experiments performed by labeling cell cultures with [3H]thymidine in parallel with determination of ATP content indicated that these two methods were equally adequate to evaluate cell proliferation (35).
IL-2 Release
PBLs (107/ml) were incubated (or not) with 0.1 mm NAM, NA, or NMN for 24 h and then incubated for a further 24 h in the absence or in the presence of 5 μg/ml concanavalin A (ConA). IL-2 concentration in cell supernatants was determined with the IL-2 DuoSet ELISA kit (R&D Systems, Minneapolis, MN) according to the manufacturer's instructions.
Statistical Analysis
All parameters were tested by paired t test or by or by a one-way analysis of variance. p values <0.05 were considered significant.
RESULTS
Nampt Inhibition by FK866 Down-regulates Anti-CD3 mAb-mediated [Ca2+]i Increase in Jurkat Cells and in Activated T Lymphocytes
We reported previously that activated, but not resting T lymphocytes as well as T lymphocyte cell lines undergo massive NAD+ depletion upon FK866-mediated Nampt inhibition. As a consequence, proliferation was impaired, IFN-γ and TNF-α production were reduced, and eventually autophagic cell demise occurred (11).
Here we sought to establish whether these dramatic effects can be accounted for by a perturbed homeostasis of cellular Ca2+. Jurkat or PBLs were incubated with FK866, and cell viability was verified by propidium iodide staining. In line with our previous data (11), a 24-h incubation with 33 nm FK866 did not significantly affect cell viability (97 ± 8% of untreated cells).
As shown in Fig. 1A, stimulation with an anti-CD3 monoclonal antibody (anti-CD3 mAb) (JT3A, Ref. 35) did not evoke any Ca2+ increase in Jurkat cells that were pretreated with FK866 for 24 h. Similarly, no Ca2+ increase was observed in FK866-treated Jurkat cells stimulated with the mitogen PHA or concanavalin A (Fig. 1A).
FIGURE 1.
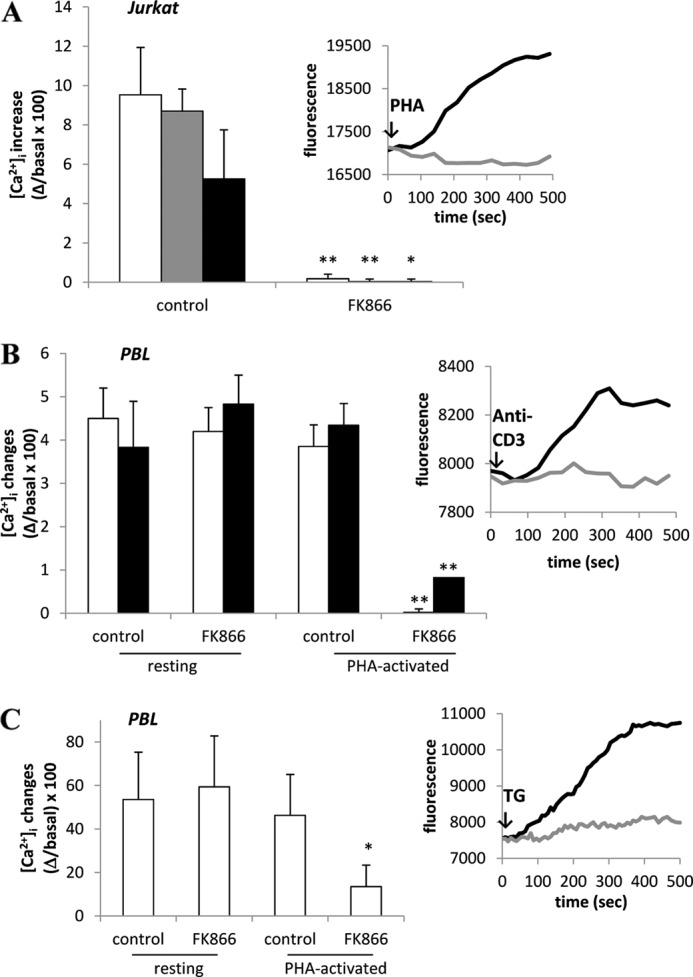
FK866 prevents the [Ca2+]i increase induced by different mitogens and reduces the Ca2+ content of TG-responsive Ca2+ stores in Jurkat and in activated PBLs. A, Jurkat cells were incubated (or not, control) with 33 nm FK866 for 24 h and loaded with Fluo-3. Cells were then stimulated with 20 ng/ml anti-CD3 mAb (white bars), 5 μg/ml PHA (gray bars), or 5 μg/ml ConA (black bars) in HBSS. Inset, shown are representative traces of control (black trace) or FK866-treated (gray trace) Jurkat cells upon the addition of PHA. B, freshly isolated human PBLs were activated (or not, resting) with 5 μg/ml PHA for 24 h. PBLs were then incubated (or not, control) with 33 nm FK866 for a further 24 h and loaded with Fluo-3. PBLs were then stimulated with either anti-CD3 mAb (white bars) or ConA (black bars). Inset, shown are representative traces of PHA-activated PBLs, incubated (gray trace) or not (black trace) with FK866 and then stimulated with anti-CD3 mAb in HBSS. C, freshly isolated human PBLs were activated or not (resting) with 5 μg/ml PHA for 24 h. PBLs were then incubated (or not, control) with 33 nm FK866 for 24 h and loaded with Fluo-3. PBLs were then treated with 10 μm TG in HBSS. Inset, shown are representative traces of PHA-activated PBLs, incubated (gray trace) or not (black trace) with FK866 and then treated with TG. Fluorescence changes were recorded with a fluorescence plate reader. Results are the mean ± S.D. from five determinations (A) or from determinations with cells from five (B) or four (C) different subjects. *, p < 0.005; **, p < 0.0001 compared with the corresponding control.
Next, we investigated the effect of FK866-mediated Nampt inhibition on resting PBLs. Anti-CD3 mAb- or ConA-stimulated [Ca2+]i increase was not affected by FK866-treatment (Fig. 1B). Conversely, treatment with FK866 strongly inhibited the anti-CD3 mAb- or ConA-induced [Ca2+]i increase in PBLs that had been preactivated with PHA for 24 h (Fig. 1B). In parallel, we confirmed that intracellular NAD+ content in PHA-preactivated PBLs and Jurkat cells was greatly decreased by a 24-h incubation with 33 nm FK866 (5.42 ± 1.49 and 0.22 ± 0.12 nmol/mg in untreated and FK866-treated, PHA-activated PBLs, respectively, n = 5, p < 0.0001; 6.61 ± 0.52 and 0.12 ± 0.05 nmol/mg in untreated and FK866-treated Jurkat cells, respectively, n = 5, p < 0.0001), in agreement with published results (11). These results indicate that intracellular NAD+ depletion strongly affects cell responsiveness in terms of [Ca2+]i increase in Jurkat cells and in activated PBLs.
The Ca2+ response to anti-CD3 mAb stimulation was previously shown to involve the production of the NAD+-derived second messenger cADPR (23). In FK866-treated Jurkat cells, intracellular cADPR levels were strongly decreased as compared with the untreated cells (4.3 ± 0.7 and 29.5 ± 2.4 pmol/109 cells, respectively, n = 3, p < 0.0001), and anti-CD3 mAb addition (20 ng/ml for 30 min at 37 °C) did not stimulate cADPR production (4.8 ± 0.9 pmol/109 cells, n = 3, p > 0.05 as compared with FK866-treated cells). Therefore, these data suggest that that a lack of cADPR generation could be responsible for the reduced Ca2+ response to mitogens in FK866-treated cells.
Nampt Inhibition by FK866 Depletes Thapsigargin-sensitive Ca2+ Stores in Jurkat and in Activated T Lymphocytes
Because mitogens failed to induce a full [Ca2+]i increase in FK866-treated Jurkat and in pre-activated, FK866-treated PBLs, we investigated the effect of FK866 on the repletion state of the TG-sensitive Ca2+ stores in these cells. TG is known to empty the cADPR- and inositol 1,4,5-trisphosphate-sensitive ER Ca2+ stores by inhibiting the ATP-dependent Ca2+ pumps of the ER (36). As a consequence, the depletion of intracellular Ca2+ stores activates Ca2+ influx through a store-operated Ca2+ entry mechanism (37).
In PHA-preactivated PBLs, incubated with 33 nm FK866 for 24 h, the TG-sensitive stores, as measured in Ca2+-free medium, were depleted by FK866 by ∼70% (not shown). The TG-induced [Ca2+]i rise in PHA-preactivated PBLs, measured in Ca2+-containing medium, was also strongly reduced by FK866 (Fig. 1C). Conversely, the TG-induced [Ca2+]i rise was not modified by FK866 in resting PBLs (Fig. 1C), in line with results obtained on the anti-CD3 mAb- and ConA-induced [Ca2+]i increase (Fig. 1B).
In FK866-treated Jurkat cells, the addition of TG in a Ca2+-free medium resulted in a remarkably lower (by ∼65%) Ca2+ release, as compared with untreated cells (Fig. 2A). Similarly, the addition of TG in a Ca2+-containing medium also resulted in a strongly reduced (by 85%) Ca2+ rise, demonstrating that Ca2+ influx was greatly impaired in FK866-treated Jurkat cells (Fig. 2B), having a reduced Ca2+ content in TG-sensitive ER stores.
FIGURE 2.

FK866 reduces the Ca2+ content of TG-responsive Ca2+ stores in Jurkat cells but not in Bcl2-Jurkat cells. A, Jurkat (white bars) or Bcl2-Jurkat cells (black bars) were incubated (or not, control) with 33 nm FK866 for 24 h and loaded with Fura-2. Cells were then treated with 10 μm TG in Ca2+-free HBSS. Changes in the [Ca2+]i were recorded with a microfluorimetric system. Results are the mean ± S.D. from five determinations. Inset to panel A, shown are representative traces of control (black trace) or FK866-treated (gray trace) Bcl2-Jurkat cells upon the addition of TG in Ca2+-free HBSS (TG was added at time 0). B, Jurkat (white bars) or Bcl2-Jurkat cells (black bars) were incubated (or not, control) with 33 nm FK866 for 24 h and loaded with Fluo-3. Cells were then treated with 10 μm TG in HBSS. Fluorescence changes were recorded with a fluorescence plate reader. Results are the mean ± S.D. from five determinations. Inset to panel B, shown are representative traces of control (black trace) or FK866-treated (gray trace) Jurkat cells upon the addition of TG in HBSS (addition at time 0). C, Jurkat or Bcl2-Jurkat cells were incubated (or not, control) with 33 nm FK866 for 24 h. Cells were then lysed; Bcl2 expression level was evaluated by Western blot and normalized against actin levels in the same sample. A representative blot and a graph with the mean ± S.D. from n = 3 different experiments are shown. D, freshly isolated human PBLs were activated or not (resting) with 5 μg/ml PHA for 24 h. Cell lysates were then run in parallel with a Jurkat cell lysate. Bcl2 expression level was evaluated by Western blot and normalized against actin levels in the same sample. A representative blot and the graph with mean ± S.D. from n = 3 different experiments are shown. *, p < 0.05; **, p < 0.005 compared with the corresponding control.
Altogether, these results indicate that in Jurkat and in activated, but not in resting PBLs, NAD+ synthesis through the “salvage pathway” is required to maintain the state of replenishment of ER Ca2+ stores necessary to ensure the full response to mitogens in terms of Ca2+ increase.
In FK866-treated Jurkat and in activated PBLs, the decrease in intracellular NAD+ content was followed by a decrease (by ∼20%) in ATP content, in line with Bruzzone et al. (11). Conversely, we found here that in resting PBLs, incubation of cells with FK866 did not affect the intracellular ATP content (27.8 ± 9.5 and 26.7 ± 8.3 nmol/mg of protein in control and in FK866-treated resting PBLs, respectively, n = 3, p > 0.05). Thus, ATP shortage as well as NAD+ shortage requires T cell activation to occur, probably as a consequence of the up-regulation of NAD+-consuming enzymes (11).
We previously found that Bcl2-overexpressing Jurkat cells (Bcl2-Jurkat) do not show any ATP decrease upon treatment with FK866, although FK866 efficiently depletes their intracellular NAD+ (11). Indeed, the major function of Bcl2 and of the related anti-apoptotic Bcl2 family members is to preserve mitochondrial integrity, thus maintaining ATP synthesis and inhibiting release of proapoptotic factors (38). The inhibition of Ca2+ release from the ER is thought to be one of the mechanisms whereby Bcl2 preserves mitochondria integrity and inhibits apoptosis (39). In an attempt to investigate the role of ATP shortage in FK866-mediated impairment of Ca2+ responses, we chose to compare the effect of FK866 on the repletion state of TG-sensitive stores in Jurkat and in Bcl2-Jurkat cells. The effect of Bcl2-overexpression per se on the ER Ca2+ content is controversial (39, 40, 41). In our cells, the TG-induced Ca2+ increase, both in Ca2+-free and in Ca2+ containing buffer, was not significantly different in untreated Jurkat and in untreated Bcl2-Jurkat (Fig. 2, A and B), in line with Hanson et al. (41). However, consistent with Hanson et al. (41) and Rong et al. (42), mitogenic stimulation induced a lower (by 40 ± 7%, n = 4) [Ca2+]i increase in Bcl2-Jurkat than in regular Jurkat cells (not shown). When assessing FK866 capability to affect the replenishment status of TG-sensitive Ca2+-stores in Jurkat and in Bcl2-Jurkat, we found that the Ca2+ content was only reduced in the former but not in the latter (Fig. 2, A and B). In addition, the [Ca2+]i increase induced by anti-CD3 mAb, PHA, or ConA was not affected by FK866 in Bcl2-Jurkat (not shown).
We confirmed by Western blot analysis the higher level of Bcl2 expression in Bcl2-Jurkat (Fig. 2C). The level of Bcl2 expression was not affected by FK866 treatment either in Jurkat or in Bcl2-Jurkat (Fig. 2C). In addition, PBL activation did not significantly modify the level of Bcl2 expression (Fig. 2D), and FK866 treatment did not influence Bcl2 expression either in resting or in PHA-activated PBLs (not shown). These results seem to be consistent with the hypothesis that FK866-induced ATP shortage is likely to down-regulate Ca2+ storage and Ca2+ signaling by impairing SERCA pump activity. Nevertheless, other explanations, beside the lack of FK866-induced ATP shortage might exist to justify the different behavior of Bcl2-Jurkat and resting PBLs, in response to NAD+ depletion. Notably, PBL activation did not significantly modify Bcl2 levels (Fig. 2D), thus ruling out the possibility that a different susceptibility to FK866 may reflect different Bcl2 levels in activated versus resting PBLs.
Increased NAD+ Content in Human PBLs Enhances Ca2+ Response to Mitogens
In an attempt to investigate whether a correlation exists between [NAD+]i levels and Ca2+ responses to anti-CD3 mAb, PHA, or ConA, PBLs were incubated in the presence of different concentrations of NAM for 24 h. Intracellular NAD+ content was significantly increased at all concentrations tested, with 100 μm NAM being already sufficient to determine a significant increase (Fig. 3A). The intracellular NAD+ content was also significantly increased by a 24-h incubation with 100 μm NA or NMN (Fig. 3A). We then analyzed the Ca2+ responses to stimulation with anti-CD3 mAb, PHA, or ConA in PBLs that had been pretreated with the various NAD+ precursors and that accordingly showed higher NAD+ levels. A 24-h preincubation with NAM determined an ∼2-fold increase of the anti-CD3 mAb- or ConA-induced [Ca2+]i increase and an ∼1.5-fold increase of the PHA-induced [Ca2+]i increase (Fig. 3, B–D). Similar results were obtained with PBLs preincubated with NA or NMN before stimulation with mitogens (Fig. 3B). These results indicate that the levels of intracellular NAD+ affect PBL responsiveness to mitogens.
FIGURE 3.

Preincubation with NAM, NA, or NMN increases the intracellular NAD+ content and the mitogen-induced [Ca2+]i rise in PBLs. A, freshly isolated PBLs were incubated in the presence of 0 (control), 0.1, 1, or 10 mm NAM (white bars) or of 0.1 mm NA (gray bar) or of 0.1 mm NMN (black bar) for 24 h, and intracellular NAD+ content was evaluated on cell extracts. Results are the mean ± S.D. from determinations with cells from seven different subjects. *, p < 0.01; **, p < 0.0001 compared with control. B, PBLs were incubated (or not, control) with 0.1 mm NAM, NA, or NMN for 24 h and loaded with Fluo-3. PBLs were then stimulated with 20 ng/ml anti-CD3 mAb (white bars), 5 μg/ml PHA (gray bars), or 5 μg/ml ConA (black bars) in HBSS. Fluorescence changes were recorded with a fluorescence plate reader. Results are the mean ± S.D. from determinations with cells from five different subjects. *, p < 0.05; **, p < 0.01 compared with control. C and D, representative traces, obtained in experiments described in panel B, of control (black traces) or NAM-treated (gray traces) PBLs upon the addition of PHA (C) or ConA (D).
Increase of NAD+ Content in PBLs Determines Ca2+ Increase in TG-sensitive Stores
Next, the state of replenishment of TG-sensitive Ca2+ stores was evaluated in PBLs preincubated or not (control) with NAM, NA, or NMN for 24 h. The addition of TG in the absence of extracellular Ca2+ determined a greater Ca2+ release in PBLs treated with NAD+ precursors as compared with control cells (Fig. 4, A and B), indicating that the Ca2+ content of the TG-responsive stores was significantly increased in PBLs treated with NAD+ precursors. The addition of TG in the presence of extracellular Ca2+ determined a greater Ca2+ increase in PBLs treated with NAD+ precursors as compared with control cells (Fig. 4, C and D). Thus, the levels of intracellular NAD+ seem to regulate Ca2+ content in intracellular stores.
FIGURE 4.

Preincubation with NAM, NA, or NMN increases the Ca2+ content of TG-sensitive stores in PBLs. Freshly isolated PBLs were incubated in the presence of 0.1 mm NAM, NA, or NMN for 24 h and then loaded with Fluo-3 (A and C) or with Fura-2 (B and D). A, TG (10 μm) was then added to Fluo-3-loaded PBLs in Ca2+-free HBSS. B, Fura-2-loaded PBLs were challenged with TG (addition at time 0) in Ca2+-free HBSS. Representative traces of three different experiments are shown: black trace, control PBLs; gray trace, PBLs incubated with NAM for 24 h; light gray trace, PBLs incubated with NA for 24 h. C, TG (10 μm) was then added to Fluo-3-loaded PBLs in HBSS. D, Fura-2-loaded PBLs were challenged with TG (addition at time 0) in HBSS. Representative traces of three different experiments are shown: gray trace, control PBLs; black trace, PBLs incubated with NAM for 24 h. In A and C, fluorescence changes were recorded with a fluorescence plate reader. In B and D, changes in the [Ca2+]i were recorded with a microfluorimetric system. Results are the mean ± S.D. from determinations with cells from five different subjects. *, p < 0.05 compared with control.
No significant changes in the [ATP]i was measured after preincubation of PBLs with 100 μm NAM, NA, or NMN for 24 h; namely, the ATP levels, relative to untreated PBLs, were 1.09 ± 0.17, 0.98 ± 0.07, and 1.11 ± 0.06-fold in NAM-, NA-, or NMN-treated cells, respectively (n = 4). This is not surprising considering that NAD+ synthesis is an ATP-consuming process (4).
The fact that the [ATP]i was not increased in PBLs incubated with NAD+ precursors argued against the possibility that an increased ATP availability to the SERCA pumps could be responsible for the increased Ca2+ content of the TG-sensitive stores. To this purpose, i.e. to estimate the activity of SERCA pumps, PBLs expressing erAEQ were incubated in the presence of coelenterazine n in a buffer that depletes the ER Ca2+ stores (see “Experimental Procedures”). Ca2+ was then readmitted to promote store refilling. The kinetics of ER refilling were not significantly different in PBLs preincubated for 24 h in the presence of NAM (Fig. 5A) or NA (not shown) compared with control PBLs. Data were fitted with the best fitting polynomial curve to extract the EC50, i.e. the time required to reach half-maximal refilling. EC50 values were 82.5 ± 8.2, 81.7 ± 9.5, and 83.4 ± 7.9 s in untreated and NAM- or NA-treated cells, respectively. ER refilling was inhibited in the presence of TG (Fig. 5B). These results suggest that a higher intracellular NAD+ level does not determine an increase of the SERCA pump activity.
FIGURE 5.
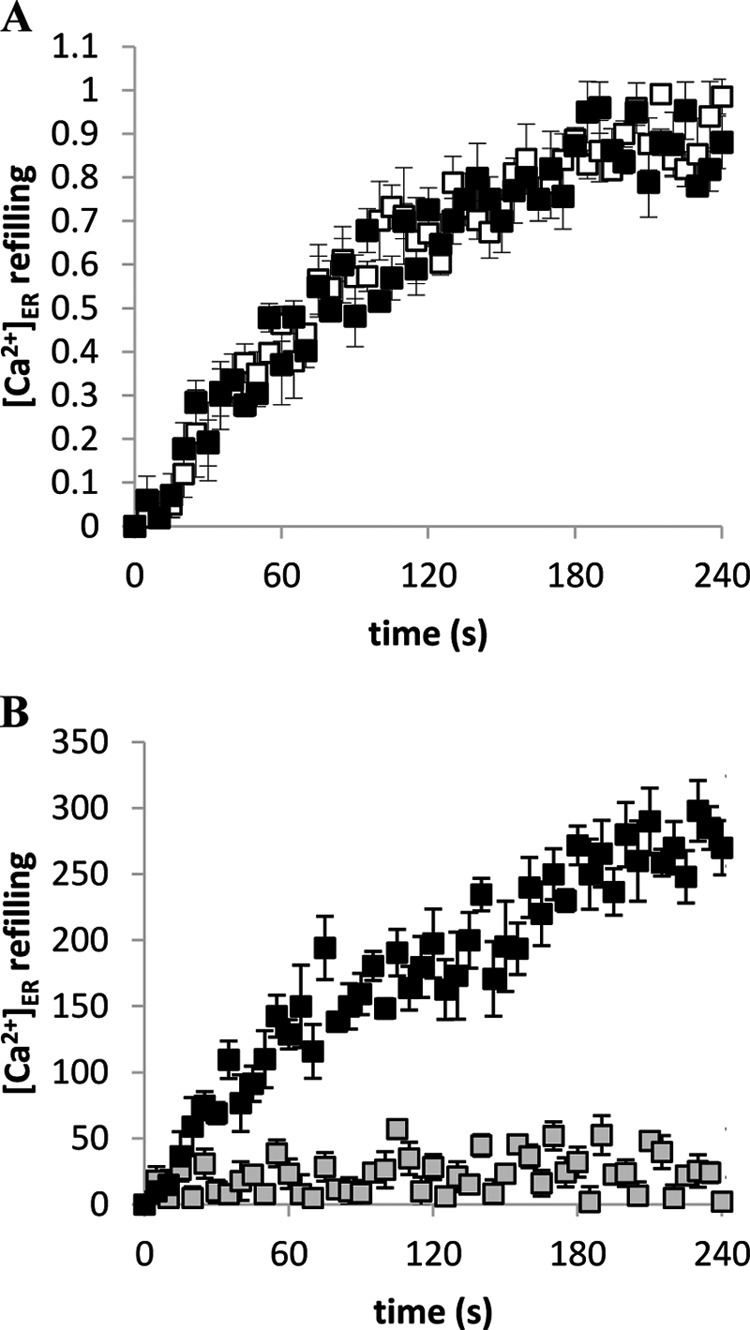
The kinetics of ER Ca2+ refilling is not modified in NAM-preincubated PBLs. Freshly isolated PBLs were transfected with erAEQ and incubated in the presence or absence of 0.1 mm NAM. After 24 h, cells were incubated for 1 h at 4 °C in KRB saline solution supplemented with coelenterazine n, ionomycin, and EGTA. A, cells were then washed with KRB supplemented with 2% BSA and resuspended in KRB, and CaCl2 was added to assess the kinetics of store refilling. White square, control cells; black squares, NAM-treated cells. B, NAM-treated cells were washed and resuspended as in A (black squares) or resuspended in KRB containing 10 μm TG (gray squares) before CaCl2 addition. Changes in the [Ca2+]ER were recorded with a luminescence plate reader. Data were acquired every second and averaged every five acquisitions. In panel A, values represent the difference between each point and the basal value, normalized to the maximal difference (set as 1). In panel B, values represent the difference between each point and the basal value. Results are the mean ± S.D. from determinations with cells from three different subjects.
NAD+-induced Ca2+ Increase in TG-sensitive Stores Is Dependent on ADPR-mediated TRPM2 Gating
The ectoenzyme CD38 catalyzes the conversion of NAD+ to the calcium-mobilizing second messengers cADPR and ADPR. Both signal metabolites, by regulating the [Ca2+]i, control different immune cell functions (17, 19).
Thus, we investigated whether cADPR and/or ADPR, produced by CD38 starting from NAD+, could be responsible for the Ca2+ accumulation in TG-sensitive Ca2+ stores in PBLs where [NAD+]i is increased (Fig. 3A). The intracellular cADPR concentration was not significantly modified in PBLs treated with 100 μm NAM for 24 h (1.08 ± 0.23 and 1.24 ± 0.31 pmol/mg in control PBLs and in PBLs treated with 100 μm NAM for 24 h, respectively, n = 3, p > 0.05). Conversely, the intracellular ADPR concentration was increased by ∼2-fold in PBLs incubated with NAM or NA and by ∼1.5-fold when cells were incubated with NMN (Fig. 6, A and B).
To assess a possible role of CD38-generated ADPR in the NAM- or NA-induced Ca2+ accumulation in TG-sensitive stores, CD38 expression was silenced in PBLs by transfection with specific anti-CD38 siRNA or with scrambled control siRNA. After 24 h, CD38 mRNA levels in cells transfected with anti-CD38 siRNA were decreased to ∼15% of those in control cells (Fig. 7A). Accordingly, Western blot analyses revealed a 65 ± 10% (n = 3) down-regulation of the CD38 protein level, as quantified by evaluating the bioluminescence intensity of the CD38 band, normalized to the β-actin expression level (Fig. 7B). Twenty-four hours after transfection, viability of cells transfected with anti-CD38 siRNA or with scrambled control siRNA was not significantly different (75 ± 8 and 73 ± 11% of untransfected cells for anti-CD38 siRNA or scrambled control siRNA, respectively, n = 3). CD38-silenced cells were incubated for a further 24 h in the presence (or absence) of NAM or NA. Treatment with either NAM or NA failed to increase the Ca2+ content of TG-responsive stores in CD38-silenced PBLs (Fig. 7C). Moreover, in CD38-silenced PBLs, the PHA- or ConA-induced [Ca2+]i increase was not potentiated by preincubation of the cells in the presence of NAM or NA (Fig. 7C).
FIGURE 7.

CD38 and TRPM2 mediate the potentiating effect of NAM or NA on the Ca2+ responses triggered by mitogens or by TG. Twenty-four hours after transfection, PBLs transfected with control siRNA or with TRPM2-siRNA or with CD38-siRNA were subjected to total RNA extraction and RT-PCR for CD38 or TRPM2 expression (n = 3) (A), lysed in lysis buffer and subjected to Western blot analyses for TRPM2 or CD38 and actin expression (n = 3); representative blots for CD38 or TRPM2 expression levels are shown (B). Cells were incubated for a further 24 h in the absence (control) or in the presence of 0.1 mm NAM or NA (C and D). Cells were then loaded with Fluo-3 and treated with either 10 μm TG or 5 μg/ml PHA or 5 μg/ml ConA; fluorescence was recorded with a plate reader. Panel C, white bars, PBLs transfected with control siRNA; black bars, PBLs transfected with CD38-siRNA. Panel D, white bars, PBLs transfected with control siRNA; black bars, PBLs transfected with TRPM2-siRNA. Results are the mean ± S.D. from three different experiments; the Ca2+ increase (calculated as Δ/basal × 100) is represented as relative to the corresponding stimulated control. *, p < 0.05 compared with the corresponding PBLs transfected with control siRNA. E, PBLs were incubated with 0.1 mm NAM or NA without (white bars) or with 0.1 mm 8-Br-ADPR (black bars) for 24 h, loaded with Fluo-3, and treated with TG in Ca2+-free HBSS. Fluorescence was recorded with a plate reader. Results are the mean ± S.D. from five different experiments. F, PBLs were incubated with 0.1 mm NA in the presence or absence of 0.1 mm 8-Br-ADPR for 24 h, loaded with Fura-2, and treated with TG in HBSS. Changes in the [Ca2+]i were recorded with a microfluorimetric system. Light gray trace, TG addition to untreated PBLs; black trace, TG addition to NA-treated PBLs; gray trace, TG addition to NA- and 8-Br-ADPR-treated PBLs. Incubation with 8-Br-ADPR alone did not significantly modify the Ca2+ increase induced by addition of TG (not shown). Representative traces of three different experiments are shown.
ADPR is a known TRPM2 agonist (28, 43–45). To assess a potential role for TRPM2 in the NAM- or NA-induced increase of Ca2+ content in the TG-sensitive Ca2+ stores, the expression of this channel was down-regulated by transfecting a specific siRNA. Twenty-four hours after transfection with an anti-TRPM2 siRNA, TRPM2 mRNA levels were decreased to ∼15% of those in control cells (Fig. 7A). Accordingly, Western blot analyses revealed a 75 ± 12% (n = 3) down-regulation of the TRPM2 protein (Fig. 7B). TRPM2-silenced cells were incubated for a further 24 h in the presence (or absence) of NAM or NA. Treatment with either NAM or NA failed to increase the Ca2+ content of TG-responsive stores in TRPM2-silenced PBLs (Fig. 7D). Moreover, also in TRPM2-silenced PBLs, preincubation of the cells in the presence of either NAM or NA failed to enhance the PHA- or ConA-induced [Ca2+]i increase over untreated controls (Fig. 7D).
To gain further evidence that TRPM2 mediates the NAM- or NA-dependent increased Ca2+ content of the TG-sensitive Ca2+ stores, we made use of 8-Br-ADPR, a TRPM2 antagonist (45). Partida-Sanchez et al. (45) tested the ability of 8-Br-ADPR in antagonizing ADPR-mediated Ca2+ entry in TRPM2-overexpressing Jurkat cells. They also demonstrated the specificity of this compound toward ADPR; 8-Br-ADPR did not inhibit the Ca2+ responses induced by cADPR, NAADP, or inositol 1,4,5-trisphosphate. Importantly, 8-Br-ADPR did not affect the Ca2+ entry occurring through the store-operated Ca2+ entry mechanism. PBLs were incubated in the presence of the NAD+ precursors, NAM or NA, without or with 8-Br-ADPR, and the extent of Ca2+ release triggered by TG in Ca2+-free buffer was compared. Indeed, 8-Br-ADPR abrogated the potentiating effect of NAM or NA (Fig. 7E) on the state of repletion of the TG-sensitive stores. 8-Br-ADPR also abrogated the potentiating effect of NAM (not shown) or NA (Fig. 7F) on the TG-induced Ca2+ rise in a Ca2+-containing medium. Altogether, these results indicate a key role of both CD38 and the ADPR-gated cation channel TRPM2 in regulating the repletion state of TG-responsive Ca2+ stores in human T lymphocytes.
In addition to its role as a plasmamembrane channel, it has been demonstrated that TRPM2 also functions as a Ca2+-releasing channel activated by intracellular ADPR in a lysosomal compartment (46). To discriminate whether NAD+ mediates the increase in Ca2+ responses by mobilizing it from lysosomal stores or enhancing its influx from the extracellular medium, we performed experiments in extracellular Ca2+-free condition or using bafilomycin A1, an inhibitor of V-type H+-ATPase (47). Because cell culture in the absence of extracellular Ca2+ or in the presence of bafilomycin cannot be maintained for 24 h, we preemptively explored whether a 2-h preincubation with NAD+ precursors was sufficient to determine an increase in the NAD+ content and in the ER Ca2+ content. Indeed, the intracellular NAD+ content was increased by ∼1.5-fold in PBLs incubated for 2 h in the presence of NAM or NA compared with controls (Fig. 8A). Notably, the NA- or NAM-induced NAD+ increase was not abolished in the presence of bafilomycin A1 or in the absence of extracellular Ca2+ (Fig. 8A). As shown in Fig. 8B, a 2-h preincubation with NAM or NA increased the Ca2+ content of ER stores, as measured by the addition of TG in a Ca2+-free medium. This increase was abolished if cells were incubated with NAD+ precursors in the presence of an extracellular Ca2+ chelator but not by bafilomycin A1 (Fig. 8B). Similar results were obtained when TG was added in a Ca2+-containing buffer (Fig. 8C). Altogether, these results indicate that plasmamembrane-localized, but not lysosomal, TRPM2 is responsible for the increased Ca2+ responses observed upon supplementation with NAD+ precursors.
FIGURE 8.
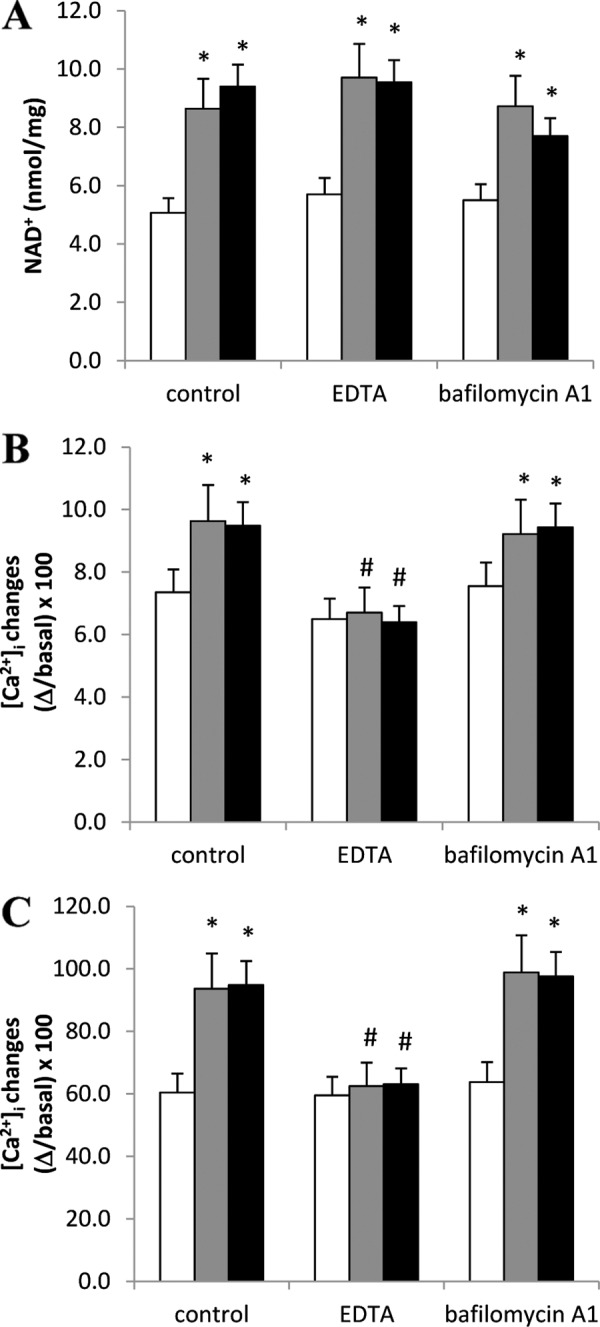
Extracellular Ca2+ influx is required for the NAM- or NA-induced increase of the Ca2+ content in TG-sensitive stores in PBLs. Freshly isolated PBLs were incubated (or not, white bars) for 2 h in complete medium supplemented with 0.1 mm NAM (gray bars) or NA (black bars) in the presence of 50 nm bafilomycin A1 or of 5 mm EDTA as indicated. A, the intracellular NAD+ content was evaluated on cell extracts. Results are the mean ± S.D. from determinations with cells from four different subjects. B and C, at the end of the 2-h incubation, PBLs were loaded with Fluo-3, and TG (10 μm) was added in Ca2+-free HBSS (B) or in HBSS (C). Fluorescence changes were recorded with a fluorescence plate, and results are the mean ± S.D. from determinations with cells from four different subjects. *, p < 0.05 compared with control (in the absence of NAD+ precursors); #, p < 0.05 compared with the corresponding NAM- or NA-treated cells in the absence of extracellular EDTA or bafilomycin A1.
Preincubation with NAM, NA, or NMN Increases Mitogen-induced PBL Proliferation and IL-2 Release
The higher [Ca2+]i increase in response to mitogens observed in PBLs preincubated with the NAD+ precursors prompted us to investigate whether a preincubation with NAM, NA, or NMN would also enhance mitogen-induced proliferation and IL-2 release. Indeed, proliferation was significantly higher in PBLs pretreated with any of the NAD+ precursors (Fig. 9A). Notably, CD38 silencing abrogated the potentiation of the mitogen-induced proliferation in response to NAD+ precursor (Fig. 9B), in line with the results obtained with the mitogen-induced Ca2+ increase (Fig. 7C).
FIGURE 9.
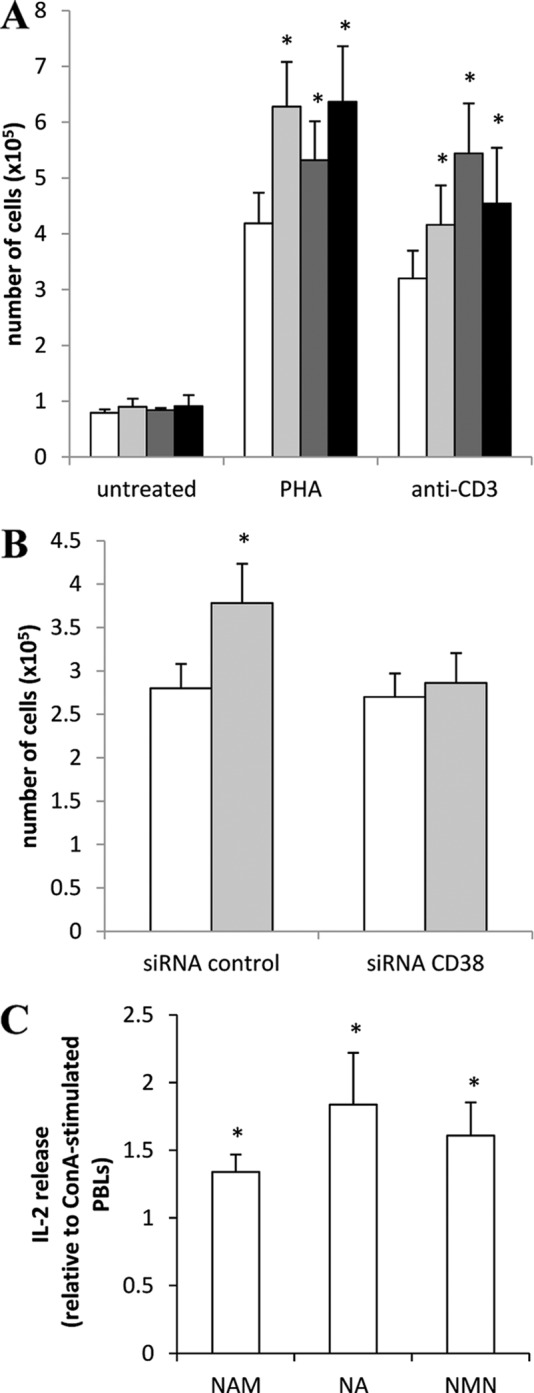
Preincubation with NAM, NA, or NMN increases mitogen-induced PBL proliferation and IL-2 release. A, PBLs (106/ml) were incubated (or not, white bars) with 0.1 mm NAM (light gray bars), NA (dark gray bars), or NMN (black bars) for 24 h and then incubated for a further 5 days in the absence (untreated) or in the presence of 5 μg/ml PHA or 20 ng/ml anti-CD3 mAb. Proliferation was evaluated as described under “Experimental Procedures.” Results are the mean ± S.D. from determinations with cells from four different subjects. *, p < 0.05 compared with cells stimulated with PHA or anti-CD3 mAb in the absence of NAD+ precursors. B, 24 h after transfection, PBLs transfected with control siRNA or with CD38-siRNA were incubated (or not, white bars) in the presence of 0.1 mm NAM (light gray bars). After a further 24 h, cells were stimulated (or not) with anti-CD3. Proliferation was evaluated after further 5 days of incubation. Results are the mean ± S.D. from three different experiments. *, p < 0.05 compared with cells stimulated with anti-CD3 mAb, in the absence of NAM. C, PBLs (107/ml) were incubated (or not) with 0.1 mm NAM, NA, or NMN for 24 h and then incubated for further 24 h in the absence or in the presence of 5 μg/ml ConA. IL-2 release was evaluated as described under “Experimental Procedures.” Results are the mean ± S.D. from determinations with cells from three different subjects. *, p < 0.05 compared with cells stimulated with ConA, in the absence of NAD+ precursors.
Finally, in PBLs that were preincubated with NAM, NA, or NMN, ConA-induced IL-2 release was up-regulated by ∼1.3-, 1.8- and 1.6- fold, respectively (Fig. 9C). These results thus confirm that intracellular NAD+ levels control PBLs responsiveness and activation.
DISCUSSION
In this study we show that the intracellular NAD+ content is a crucial regulator of Ca2+ signaling and of key Ca2+-mediated cell functions in human T lymphocytes. These effects are achieved through different mechanisms, depending on whether cells experience NAD+ shortage or NAD+ abundance.
Lowering the NAD+ content of activated PBLs by Nampt inhibition with FK866 significantly diminished the Ca2+ response to mitogens (Fig. 1B) and to TG as well (Fig. 1C), the latter finding reflecting the low state of replenishment of the ER Ca2+ stores. This effect is due to the FK866-induced ATP depletion, as Jurkat cells overexpressing Bcl2, where the [NAD+]i but not the [ATP]i levels are reduced (11), do not undergo any change in their Ca2+ responses upon FK866 treatment (Fig. 2A). Similarly, in resting PBLs, FK866 does not affect either the ATP content or the Ca2+ responses (see “Results” and Figs. 1, B and C). Thus, in Jurkat cells and in preactivated PBLs, decrease of intracellular ATP prevents the replenishment of TG-responsive ER Ca2+ stores, which is mediated by ATP-dependent, ER-associated Ca2+ pumps (SERCA).
The mitogen-induced [Ca2+]i increase, which is due to an early Ca2+ release from ER stores followed by an influx of extracellular Ca2+ (15, 22), was impaired in FK866-treated cells as a consequence, on one hand, of the depletion of the Ca2+ stores and, on the other hand, of the lack of generation of NAD+-derived Ca2+-mobilizing second messengers due to [NAD+]i decrease.
Nampt inhibition with FK866 has remarkable effects in activated but not in resting PBLs (11), possibly reflecting the fact that NAD+ depletion in response to this drug is much more pronounced in the former than in the latter. Accordingly, incubation with FK866 did not alter the [ATP]i and Ca2+ homeostasis in resting PBLs (Fig. 1, B and C). These data suggest the existence of a “threshold” level of [NAD+]i below which the Ca2+ content in TG-responsive stores becomes affected. The fact that Jurkat cells exhibited the behavior of activated PBLs with respect to FK866-induced changes in Ca2+ homeostasis indicates that the Jurkat cell line represents a suitable model of activated T cells.
Interestingly, increasing NAD+ levels by supplementing cells with different vitamin B3 precursors of NAD+ (NAM, NA, and NMN - refs. 48–53) determined an increase of the Ca2+ content in the TG-sensitive stores and an increase of the mitogen-induced [Ca2+]i increase.
Although the uptake of NAM and NA certainly occurs in intact cells (48, 53), the exact underlying mechanisms are not known. Regarding extracellular NMN, it is still not clear how it enhances the intracellular NAD+ content, thereby improving metabolism in diet- and age-induced type 2 diabetes in mice (54). The existence of a transport mechanism for NMN on the plasmamembrane of intact cells has not been directly demonstrated so far. Although direct NMN influx might occur in certain cell types and tissues, the presence of ectoenzymes with NMN-degrading activities, such as CD38 and CD73 (55, 56), suggests the possibility that NMN-derived metabolites could cross the plasmamembrane. Thus, in cells expressing CD38, NMN can be rapidly degraded to NAM, thereby gaining access into the cell and becoming a direct substrate for Nampt. In cells expressing CD73, NMN would be degraded to nicotinamide riboside, which has been suggested to cross the plasmamembrane through nucleoside transporters and to be intracellularly phosphorylated to NMN by specific nicotinamide riboside kinases (51, 53, 57, 58).
PBL incubation with NAD+ precursors resulted in an increased [NAD+]i and [ADPR]i (Figs. 3A and 6). Production of intracellular ADPR is due to the enhanced NAD+-glycohydrolase activity of CD38 in the presence of an increased concentration of its substrate NAD+. Although CD38 is an ectoenzyme, with the active site facing the extracellular environment (59, 60), its expression/activation in cells leads to the intracellular accumulation of cADPR, the product of its ADP-ribosyl cyclase activity (20, 61–63), and of ADPR, the product of its NAD+-glycohydrolase activity (16, 45).
In previous studies the increased concentration of cADPR upon CD38 activation or de novo expression in human cells was associated with a [NAD+]i decrease due to overconsumption of this dinucleotide (61). On the other hand, in this study we found that increased levels of the substrate NAD+ determined a higher production of ADPR. Similarly, in LPS-activated PBLs, an increased [NAD+]i was followed by an enhanced generation of cADPR (30). Both in CD38-overexpressing HeLa cells and in LPS-activated PBLs, accumulation of intracellular cADPR resulted in a decreased Ca2+ content of TG-sensitive Ca2+ stores (30, 61). Interestingly, our present findings suggest that a CD38-dependent accumulation of intracellular ADPR results in the opposite effect on ER Ca2+ stores, i.e. in an increase of their replenishment state.
These results implicate ADPR as the mechanistic link between CD38 and TRPM2 in mediating the NAD+-dependent changes of intracellular Ca2+ homeostasis in T cells. Physiological intracellular levels of ADPR are sufficient to trigger TRPM2 gating in human T cells (16). In addition, in the same cells it has been demonstrated that TRPM2 represents the main, if not the only, target of ADPR (16). TRPM2 is expressed in many different organs and tissues and in different cell types, including immune cells (neutrophils, megakaryocytes, monocytes/macrophages, and lymphocytes). In addition, TRPM2-regulated functions have been reported in different types of immune cells. In T lymphocytes, ADPR-mediated gating of TRPM2 has been implicated in the regulation of the [Ca2+]i increase and subsequent cell death induced by high concentrations of ConA (16); in B lymphocytes, ADPR-mediated gating of TRPM2 occurs in response to oxidative stress (64); in neutrophils, the bacterial peptide formyl-methionyl-leucyl-phenylalanine (fMLP)-induced Ca2+ influx is regulated by a signaling pathway involving CD38-ADPR-TRPM2 (45, 65). Thus, increasing evidence points to TRPM2 as a central player for proper immune cell activity.
We propose that the increased [ADPR]i generated by CD38 in PBLs that are preincubated with NAD+ precursors triggers TRPM2 opening, leading to extracellular Ca2+ influx and subsequent Ca2+ accumulation in the ER stores. Notably, under our conditions, TRPM2 activation seems to control cell proliferation in response to mitogens.
In B cells, activation of the poly(ADP-ribose) polymerase 1/poly(ADP-ribose) glycohydrolase (PARG) system following an oxidative stress has been demonstrated to determine the opening of TRPM2 due to overproduction of ADPR (64). At present, the possibility that the poly(ADP-ribose) polymerase 1/PARG system could in part be responsible for ADPR generation in PBLs incubated with NAD+ precursors cannot be ruled out.
In conclusion, our study indicates that [NAD+]i is a major determinant of the level of replenishment of TG-sensitive [Ca2+]i stores in T lymphocytes. Lowering [NAD+]i by Nampt inhibitors will strongly affect Ca2+ mediated responses in these immune effectors, thereby contributing to the immunosuppressive activity of these agents. On the contrary, strategies aimed at increasing [NAD+]i content, e.g. via supplementation with selective NAD+ precursors, may increase T cell responsiveness and thereby boost the immune response.
Acknowledgments
We thank Dr. Claus Belka (Ludwig Maximilians Universität München, Department of Radiation Oncology, Munich, Germany) for providing the Bcl2-overexpressing Jurkat cells and the NIMH Chemical Synthesis and Drug Supply Program for generously providing FK866 for this study.
This work was supported by the Italian Ministry of Education, University and Scientific Research, the Italian Ministry of Health, the University of Genova, the Fondazione CARIGE, the Compagnia di S. Paolo, the Regione Liguria, the Fondazione Italiana Sclerosi Multipla (FISM), and the Associazione Italiana per la Ricerca sul Cancro (AIRC, START-UP grant (to A. N.) and AIRC n.8761 (to A. P.)).
- Nampt
- nicotinamide phosphoribosyltransferase
- Naprt1
- nicotinic acid phosphoribosyltransferase
- ADPR
- ADP-ribose
- cADPR
- cyclic ADPR
- [Ca2+]i
- intracellular free Ca2+ concentration
- [Ca2+]ER
- endoplasmic reticulum Ca2+ concentration
- NAM
- nicotinamide
- NA
- nicotinic acid
- NMN
- nicotinamide mononucleotide
- PHA
- phytohemagglutinin
- ConA
- concanavalin A
- erAEQ
- aequorin directed to the endoplasmic reticulum
- Bcl2-Jurkat cells
- Jurkat cells overexpressing Bcl2
- ER
- endoplasmic reticulum
- PBL
- peripheral blood lymphocyte
- SERCA
- sarco(endo)plasmic reticulum calcium ATPase
- TG
- thapsigargin
- HBSS
- Hanks' balanced salt solution
- TRPM
- melastatin-related transient receptor potential.
REFERENCES
- 1. Hasmann M., Schemainda I. (2003) FK866, a highly specific noncompetitive inhibitor of nicotinamide phosphoribosyltransferase, represents a novel mechanism for induction of tumor cell apoptosis. Cancer Res. 63, 7436–7442 [PubMed] [Google Scholar]
- 2. Khan J. A., Tao X., Tong L. (2006) Molecular basis for the inhibition of human NMPRTase, a novel target for anticancer agents. Nat. Struct. Mol. Biol. 13, 582–588 [DOI] [PubMed] [Google Scholar]
- 3. Wosikowski K., Mattern K., Schemainda I., Hasmann M., Rattel B., Löser R. (2002) WK175, a novel antitumor agent, decreases the intracellular nicotinamide adenine dinucleotide concentration and induces the apoptotic cascade in human leukemia cells. Cancer Res. 62, 1057–1062 [PubMed] [Google Scholar]
- 4. Lau C., Niere M., Ziegler M. (2009) The NMN/NaMN adenylyltransferase (NMNAT) protein family. Front. Biosci. 14, 410–431 [DOI] [PubMed] [Google Scholar]
- 5. Berger S. J., Manory I., Sudar D. C., Berger N. A. (1987) Induction of the pyridine nucleotide synthesis pathway in mitogen-stimulated human T-lymphocytes. Exp. Cell Res. 169, 149–157 [DOI] [PubMed] [Google Scholar]
- 6. Rongvaux A., Shea R. J., Mulks M. H., Gigot D., Urbain J., Leo O., Andris F. (2002) Pre-B-cell colony-enhancing factor, whose expression is up-regulated in activated lymphocytes, is a nicotinamide phosphoribosyltransferase, a cytosolic enzyme involved in NAD biosynthesis. Eur. J. Immunol. 32, 3225–3234 [DOI] [PubMed] [Google Scholar]
- 7. Shaffer A. L., Rosenwald A., Hurt E. M., Giltnane J. M., Lam L. T., Pickeral O. K., Staudt L. M. (2001) Signatures of the immune response. Immunity 15, 375–385 [DOI] [PubMed] [Google Scholar]
- 8. Feske S., Giltnane J., Dolmetsch R., Staudt L. M., Rao A. (2001) Gene regulation mediated by calcium signals in T lymphocytes. Nat. Immunol. 2, 316–324 [DOI] [PubMed] [Google Scholar]
- 9. Rongvaux A., Galli M., Denanglaire S., Van Gool F., Drèze P. L., Szpirer C., Bureau F., Andris F., Leo O. (2008) Nicotinamide phosphoribosyl transferase/pre-B cell colony-enhancing factor/visfatin is required for lymphocyte development and cellular resistance to genotoxic stress. J. Immunol. 181, 4685–4695 [DOI] [PubMed] [Google Scholar]
- 10. Holen K., Saltz L. B., Hollywood E., Burk K., Hanauske A. R. (2008) The pharmacokinetics, toxicities, and biologic effects of FK866, a nicotinamide adenine dinucleotide biosynthesis inhibitor. Invest. New Drugs 26, 45–51 [DOI] [PubMed] [Google Scholar]
- 11. Bruzzone S., Fruscione F., Morando S., Ferrando T., Poggi A., Garuti A., D'Urso A., Selmo M., Benvenuto F., Cea M., Zoppoli G., Moran E., Soncini D., Ballestrero A., Sordat B., Patrone F., Mostoslavsky R., Uccelli A., Nencioni A. (2009) Catastrophic NAD+ depletion in activated T lymphocytes through Nampt inhibition reduces demyelination and disability in EAE. PLoS One 4, e7897. [DOI] [PMC free article] [PubMed] [Google Scholar]
- 12. Van Gool F., Gallí M., Gueydan C., Kruys V., Prevot P. P., Bedalov A., Mostoslavsky R., Alt F. W., De Smedt T., Leo O. (2009) Intracellular NAD levels regulate tumor necrosis factor protein synthesis in a sirtuin-dependent manner. Nat. Med. 15, 206–210 [DOI] [PMC free article] [PubMed] [Google Scholar]
- 13. Sestini S., Jacomelli G., Pescaglini M., Micheli V., Pompucci G. (2000) Enzyme activities leading to NAD synthesis in human lymphocytes. Arch. Biochem. Biophys. 379, 277–282 [DOI] [PubMed] [Google Scholar]
- 14. Gallí M., Van Gool F., Rongvaux A., Andris F., Leo O. (2010) The nicotinamide phosphoribosyltransferase. A molecular link between metabolism, inflammation, and cancer. Cancer Res. 70, 8–11 [DOI] [PubMed] [Google Scholar]
- 15. Guse A. H. (2004) Regulation of calcium signaling by the second messenger cyclic adenosine diphosphoribose (cADPR). Curr. Mol. Med. 4, 239–248 [DOI] [PubMed] [Google Scholar]
- 16. Gasser A., Glassmeier G., Fliegert R., Langhorst M. F., Meinke S., Hein D., Krüger S., Weber K., Heiner I., Oppenheimer N., Schwarz J. R., Guse A. H. (2006) Activation of T cell calcium influx by the second messenger ADP-ribose. J. Biol. Chem. 281, 2489–2496 [DOI] [PubMed] [Google Scholar]
- 17. Fliegert R., Gasser A., Guse A. H. (2007) Regulation of calcium signaling by adenine-based second messengers. Biochem. Soc. Trans. 35, 109–114 [DOI] [PubMed] [Google Scholar]
- 18. Lee H. C., Walseth T. F., Bratt G. T., Hayes R. N., Clapper D. L. (1989) Structural determination of a cyclic metabolite of NAD+ with intracellular Ca2+-mobilizing activity. J. Biol. Chem. 264, 1608–1615 [PubMed] [Google Scholar]
- 19. Lee H. C. (2004) Multiplicity of Ca2+ messengers and Ca2+ stores. A perspective from cyclic ADP-ribose and NAADP. Curr. Mol. Med. 4, 227–237 [DOI] [PubMed] [Google Scholar]
- 20. Guse A. H. (2005) Second messenger function and the structure-activity relationship of cyclic adenosine diphosphoribose (cADPR). FEBS J. 272, 4590–4597 [DOI] [PubMed] [Google Scholar]
- 21. Berridge M. J., Bootman M. D., Roderick H. L. (2003) Calcium signaling. Dynamics, homeostasis, and remodeling. Nat. Rev. Mol. Cell Biol. 4, 517–529 [DOI] [PubMed] [Google Scholar]
- 22. Lewis R. S. (2001) Calcium signaling mechanisms in T lymphocytes. Annu. Rev. Immunol. 19, 497–521 [DOI] [PubMed] [Google Scholar]
- 23. Guse A. H., da Silva C. P., Berg I., Skapenko A. L., Weber K., Heyer P., Hohenegger M., Ashamu G. A., Schulze-Koops H., Potter B. V., Mayr G. W. (1999) Regulation of calcium signaling in T lymphocytes by the second messenger cyclic ADP-ribose. Nature 398, 70–73 [DOI] [PubMed] [Google Scholar]
- 24. Carafoli E., Santella L., Branca D., Brini M. (2001) Generation, control, and processing of cellular calcium signals. Crit. Rev. Biochem. Mol. Biol. 36, 107–260 [DOI] [PubMed] [Google Scholar]
- 25. Carafoli E. (2003) The calcium-signaling saga. Tap water and protein crystals. Nat. Rev. Mol. Cell Biol. 4, 326–332 [DOI] [PubMed] [Google Scholar]
- 26. Feske S. (2007) Calcium signaling in lymphocyte activation and disease. Nat. Rev. Immunol. 7, 690–702 [DOI] [PubMed] [Google Scholar]
- 27. Oh-hora M., Rao A. (2008) Calcium signaling in lymphocytes. Curr. Opin. Immunol. 20, 250–258 [DOI] [PMC free article] [PubMed] [Google Scholar]
- 28. Sumoza-Toledo A., Penner R. (2011) TRPM2. A multifunctional ion channel for calcium signaling. J. Physiol. 589, 1515–1525 [DOI] [PMC free article] [PubMed] [Google Scholar]
- 29. Belka C., Rudner J., Wesselborg S., Stepczynska A., Marini P., Lepple-Wienhues A., Faltin H., Bamberg M., Budach W., Schulze-Osthoff K. (2000) Differential role of caspase-8 and BID activation during radiation- and CD95-induced apoptosis. Oncogene 19, 1181–1190 [DOI] [PubMed] [Google Scholar]
- 30. Bruzzone S., De Flora A., Usai C., Graeff R., Lee H. C. (2003) Cyclic ADP-ribose is a second messenger in the lipopolysaccharide-stimulated proliferation of human peripheral blood mononuclear cells. Biochem. J. 375, 395–403 [DOI] [PMC free article] [PubMed] [Google Scholar]
- 31. Brini M. (2008) Calcium-sensitive photoproteins. Methods 46, 160–166 [DOI] [PubMed] [Google Scholar]
- 32. Basile G., Taglialatela-Scafati O., Damonte G., Armirotti A., Bruzzone S., Guida L., Franco L., Usai C., Fattorusso E., De Flora A., Zocchi E. (2005) ADP-ribosyl cyclases generate two unusual adenine homodinucleotides with cytotoxic activity on mammalian cells. Proc. Natl. Acad. Sci. U.S.A. 102, 14509–14514 [DOI] [PMC free article] [PubMed] [Google Scholar]
- 33. Ståhlberg A., Zoric N., Aman P., Kubista M. (2005) Quantitative real-time PCR for cancer detection. The lymphoma case. Expert. Rev. Mol. Diagn. 5, 221–230 [DOI] [PubMed] [Google Scholar]
- 34. Rutledge R. G., Côté C. (2003) Mathematics of quantitative kinetic PCR and the application of standard curves. Nucleic Acids Res. 31, e93. [DOI] [PMC free article] [PubMed] [Google Scholar]
- 35. Musso A., Zocchi M. R., Poggi A. (2011) Relevance of the mevalonate biosynthetic pathway in the regulation of bone marrow mesenchymal stromal cell-mediated effects on T-cell proliferation and B-cell survival. Haematologica 96, 16–23 [DOI] [PMC free article] [PubMed] [Google Scholar]
- 36. Inesi G., Sagara Y. (1992) Thapsigargin, a high affinity and global inhibitor of intracellular Ca2+ transport ATPases. Arch. Biochem. Biophys. 298, 313–317 [DOI] [PubMed] [Google Scholar]
- 37. Parekh A. B., Putney J. W., Jr. (2005) Store-operated calcium channels. Physiol. Rev. 85, 757–810 [DOI] [PubMed] [Google Scholar]
- 38. Youle R. J., Strasser A. (2008) The BCL-2 protein family. Opposing activities that mediate cell death. Nat. Rev. Mol. Cell Biol. 9, 47–59 [DOI] [PubMed] [Google Scholar]
- 39. Pinton P., Rizzuto R. (2006) Bcl-2 and Ca2+ homeostasis in the endoplasmic reticulum. Cell Death Differ. 13, 1409–1418 [DOI] [PubMed] [Google Scholar]
- 40. Rong Y. P., Aromolaran A. S., Bultynck G., Zhong F., Li X., McColl K., Matsuyama S., Herlitze S., Roderick H. L., Bootman M. D., Mignery G. A., Parys J. B., De Smedt H., Distelhorst C. W. (2008) Targeting Bcl-2-IP3 receptor interaction to reverse Bcl-2 inhibition of apoptotic calcium signals. Mol. Cell 31, 255–265 [DOI] [PMC free article] [PubMed] [Google Scholar]
- 41. Hanson C. J., Bootman M. D., Distelhorst C. W., Wojcikiewicz R. J., Roderick H. L. (2008) Bcl-2 suppresses Ca2+ release through inositol 1,4,5-trisphosphate receptors and inhibits Ca2+ uptake by mitochondria without affecting ER calcium store content. Cell Calcium 44, 324–338 [DOI] [PubMed] [Google Scholar]
- 42. Rong Y. P., Bultynck G., Aromolaran A. S., Zhong F., Parys J. B., De Smedt H., Mignery G. A., Roderick H. L., Bootman M. D., Distelhorst C. W. (2009) The BH4 domain of Bcl-2 inhibits ER calcium release and apoptosis by binding the regulatory and coupling domain of the IP3 receptor. Proc. Natl. Acad. Sci. 106, 14397–14402 [DOI] [PMC free article] [PubMed] [Google Scholar]
- 43. Perraud A. L., Fleig A., Dunn C. A., Bagley L. A., Launay P., Schmitz C., Stokes A. J., Zhu Q., Bessman M. J., Penner R., Kinet J. P., Scharenberg A. M. (2001) ADP-ribose gating of the calcium-permeable LTRPC2 channel revealed by Nudix motif homology. Nature 411, 595–599 [DOI] [PubMed] [Google Scholar]
- 44. Sano Y., Inamura K., Miyake A., Mochizuki S., Yokoi H., Matsushime H., Furuichi K. (2001) Immunocyte Ca2+ influx system mediated by LTRPC2. Science 293, 1327–1330 [DOI] [PubMed] [Google Scholar]
- 45. Partida-Sanchez S., Gasser A., Fliegert R., Siebrands C. C., Dammermann W., Shi G., Mousseau B. J., Sumoza-Toledo A., Bhagat H., Walseth T. F., Guse A. H., Lund F. E. (2007) Chemotaxis of mouse bone marrow neutrophils and dendritic cells is controlled by adp-ribose, the major product generated by the CD38 enzyme reaction. J. Immunol. 179, 7827–7839 [DOI] [PubMed] [Google Scholar]
- 46. Lange I., Yamamoto S., Partida-Sanchez S., Mori Y., Fleig A., Penner R. (2009) TRPM2 functions as a lysosomal Ca2+-release channel in β cells. Sci. Signal. 2, ra23. [DOI] [PMC free article] [PubMed] [Google Scholar]
- 47. Bowman E. J., Siebers A., Altendorf K. (1988) Bafilomycins. A class of inhibitors of membrane ATPases from microorganisms, animal cells, and plant cells. Proc. Natl. Acad. Sci. U.S.A. 85, 7972–7976 [DOI] [PMC free article] [PubMed] [Google Scholar]
- 48. Bogan K. L., Brenner C. (2008) Nicotinic acid, nicotinamide, and nicotinamide riboside. A molecular evaluation of NAD+ precursor vitamins in human nutrition. Annu. Rev. Nutr. 28, 115–130 [DOI] [PubMed] [Google Scholar]
- 49. Imai S. (2010) A possibility of nutriceuticals as an anti-aging intervention. Activation of sirtuins by promoting mammalian NAD biosynthesis. Pharmacol. Res. 62, 42–47 [DOI] [PMC free article] [PubMed] [Google Scholar]
- 50. Revollo J. R., Körner A., Mills K. F., Satoh A., Wang T., Garten A., Dasgupta B., Sasaki Y., Wolberger C., Townsend R. R., Milbrandt J., Kiess W., Imai S. (2007) Nampt/PBEF/Visfatin regulates insulin secretion in β cells as a systemic NAD biosynthetic enzyme. Cell Metab. 6, 363–375 [DOI] [PMC free article] [PubMed] [Google Scholar]
- 51. Belenky P., Bogan K. L., Brenner C. (2007) NAD+ metabolism in health and disease. Trends Biochem. Sci. 32, 12–19 [DOI] [PubMed] [Google Scholar]
- 52. Tempel W., Rabeh W. M., Bogan K. L., Belenky P., Wojcik M., Seidle H. F., Nedyalkova L., Yang T., Sauve A. A., Park H. W., Brenner C. (2007) Nicotinamide riboside kinase structures reveal new pathways to NAD+. PLoS Biol. 5, e263. [DOI] [PMC free article] [PubMed] [Google Scholar]
- 53. Nikiforov A., Dölle C., Niere M., Ziegler M. (2011) Pathways and subcellular compartmentation of NAD biosynthesis in human cells. From entry of extracellular precursors to mitochondrial NAD generation. J. Biol. Chem. 286, 21767–21778 [DOI] [PMC free article] [PubMed] [Google Scholar]
- 54. Yoshino J., Mills K. F., Yoon M. J., Imai S. (2011) Nicotinamide mononucleotide, a key NAD+ intermediate, treats the pathophysiology of diet- and age-induced diabetes in mice. Cell Metab. 14, 528–536 [DOI] [PMC free article] [PubMed] [Google Scholar]
- 55. Sauve A. A., Munshi C., Lee H. C., Schramm V. L. (1998) The reaction mechanism for CD38. A single intermediate is responsible for cyclization, hydrolysis, and base-exchange chemistries. Biochemistry 37, 13239–13249 [DOI] [PubMed] [Google Scholar]
- 56. Garavaglia S., Bruzzone S., Cassani C., Canella L., Allegrone G., Sturla L., Mannino E., Millo E., De Flora A., Rizzi M. (2012) The high resolution crystal structure of periplasmic Haemophilus influenzae NAD nucleotidase reveals a novel enzymatic function of human CD73 related to NAD metabolism. Biochem. J. 441, 131–141 [DOI] [PubMed] [Google Scholar]
- 57. Bieganowski P., Brenner C. (2004) Discoveries of nicotinamide riboside as a nutrient and conserved NRK genes establish a Preiss-Handler-independent route to NAD+ in fungi and humans. Cell 117, 495–502 [DOI] [PubMed] [Google Scholar]
- 58. Bogan K. L., Evans C., Belenky P., Song P., Burant C. F., Kennedy R., Brenner C. (2009) Identification of Isn1 and Sdt1 as glucose- and vitamin-regulated nicotinamide mononucleotide and nicotinic acid mononucleotide [corrected] 5'-nucleotidases responsible for production of nicotinamide riboside and nicotinic acid riboside. J. Biol. Chem. 284, 34861–34869 [DOI] [PMC free article] [PubMed] [Google Scholar]
- 59. Howard M., Grimaldi J. C., Bazan J. F., Lund F. E., Santos-Argumedo L., Parkhouse R. M., Walseth T. F., Lee H. C. (1993) Formation and hydrolysis of cyclic ADP-ribose catalyzed by lymphocyte antigen CD38. Science 262, 1056–1059 [DOI] [PubMed] [Google Scholar]
- 60. Zocchi E., Franco L., Guida L., Benatti U., Bargellesi A., Malavasi F., Lee H. C., De Flora A. (1993) A single protein immunologically identified as CD38 displays NAD+ glycohydrolase, ADP-ribosyl cyclase, and cyclic ADP-ribose hydrolase activities at the outer surface of human erythrocytes. Biochem. Biophys. Res. Commun. 196, 1459–1465 [DOI] [PubMed] [Google Scholar]
- 61. Zocchi E., Daga A., Usai C., Franco L., Guida L., Bruzzone S., Costa A., Marchetti C., De Flora A. (1998) Expression of CD38 increases intracellular calcium concentration and reduces doubling time in HeLa and 3T3 cells. J. Biol. Chem. 273, 8017–8024 [DOI] [PubMed] [Google Scholar]
- 62. De Flora A., Zocchi E., Guida L., Franco L., Bruzzone S. (2004) Autocrine and paracrine calcium signaling by the CD38/NAD+/cyclic ADP-ribose system. Ann. N.Y. Acad. Sci. 1028, 176–191 [DOI] [PubMed] [Google Scholar]
- 63. Lee H. C. (2011) Cyclic ADP-ribose and NAADP. Fraternal twin messengers for calcium signaling. Sci. China Life Sci. 54, 699–711 [DOI] [PubMed] [Google Scholar]
- 64. Buelow B., Song Y., Scharenberg A. M. (2008) The Poly(ADP-ribose) polymerase PARP-1 is required for oxidative stress-induced TRPM2 activation in lymphocytes. J. Biol. Chem. 283, 24571–24583 [DOI] [PMC free article] [PubMed] [Google Scholar]
- 65. Yamamoto S., Shimizu S., Kiyonaka S., Takahashi N., Wajima T., Hara Y., Negoro T., Hiroi T., Kiuchi Y., Okada T., Kaneko S., Lange I., Fleig A., Penner R., Nishi M., Takeshima H., Mori Y. (2008) TRPM2-mediated Ca2+ influx induces chemokine production in monocytes that aggravates inflammatory neutrophil infiltration. Nat. Med. 14, 738–747 [DOI] [PMC free article] [PubMed] [Google Scholar]